Showing posts with label recovery. Show all posts

Sunday, December 10, 2017

What You"re Not Being Told About The Real Economy

Authored by Jeffrey Snider via Alhambra Investment Partners,


The year 2000 was a transition year in a lot of ways. Though Y2K amounted to mild mass hysteria, people did have to get used to writing the date with 20 in front of the year rather than 19. It was a new millennium (depending on your view of Year 0) that seemed to have started off under the best possible terms.


Not only were stocks on fire at the outset, the economy was, too. The idea of this “new economy” leading toward a permanent new plateau of low inflation growth, driven by the breathtaking productivity gains in telecommunications and computing, seemed quite real on the surface. US GDP advanced by more than 3% in 15 straight quarters from Q2 1996 through Q4 1999, averaging a sizzling 4.7% in those nearly four years of dot-com supremacy.


The labor market was clearly robust, too. In March 2000, the BLS estimates (current benchmarks) that total payrolls (Establishment Survey) rose by 468k from that February. That brought the 6-month average up to +303k, a record of expansion that also mystified economists for its lack of inflationary wage pressures. In any case, the late nineties had roared up to the doorstep of the 21st century.


We all know what happened in April 2000, as investors suddenly got cold feet about first the high flying NASDAQ. It wasn’t just stock prices and IPOs, of course, as it really meant one of the major economic themes of that age was in danger being undermined, if not thoroughly debunked. The new economy of the 21st century might not have been grounded so solidly in true economics (small “e”) as everyone thought (especially those running the Fed).


The labor market of 2000 was a study in contrasts, starting out as good as it did, but by that June, there was a shocking minus for the monthly headline payroll number. It wasn’t just a one-time problem, either, as despite all assurances in all the usual places payrolls would contract again in August and also in October. To end the year 2000, the 6-month average for the Establishment Survey had fallen to just +109k.


It was, again, a year of transition, beginning as the “sky is the limit” dot-com era and ending in almost a tailspin just two months shy of official recession. In many ways, the economy has never recovered from it, the labor market (the eurodollar’s giant sucking sound) most prominently.


Because of this and really the length of time involved between then and now, we have forgotten what a good economy actually looks like. There have been, of course, brief moments when we get the sense that something just isn’t right, such as the “jobless recovery” of 2002 and 2003, as well as the whole aftermath of the Great “Recession” up until 2014. By and large, however, the economy and the labor market are described in terms that just don’t apply if almost by default (it’s less bad today, so mustn’t it be good?).


The current payroll report for November 2017 suggests a gain of 228k. It is characterized as everything from “solid” to “robust.” Is it? How would we really know?


The best way to confirm that suspicion is to compare the current labor statistics to those in the past, calibrating the most recent numbers by those before that were recorded during what were inarguably the best of times; such as the late nineties.


Using monthly payroll gains, though, can be misleading simply because of geometric progression. A gain of 228k in November is not equivalent to the 228k gain in November 2000. The latter is actually a better single month result starting as it did from a smaller base.
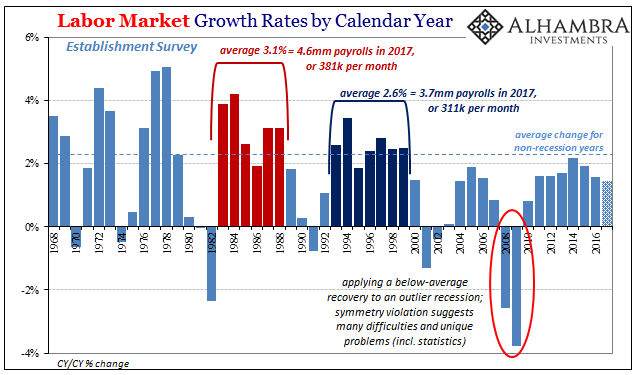


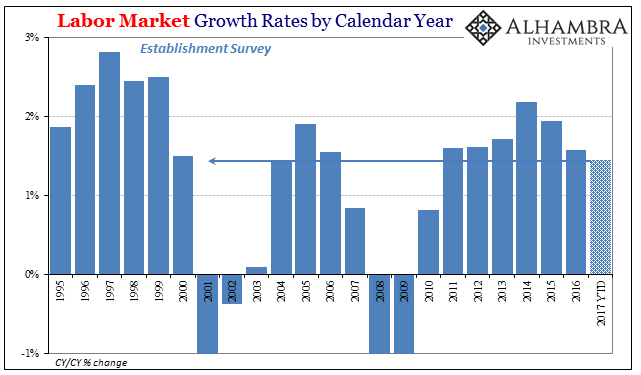
From 1993 through 1999, the labor market gained, on average, 2.6% per year according to the Establishment Survey. Since that time period is universally accepted as one featuring a strong economy, that is our standard for measurement. We can also go back to the eighties for what might amount to as an upper limit of sorts, the economy and labor market at that time being whatever is better than strong and robust – truly awesome.


Translating those average gains into the 2016 base equals an expectation of 3.7mm payrolls gained for 2017 to be as good as the nineties, and 4.6mm, which would signal a splendid economic year consistent with the eighties. Through 11 months so far up to November, the Establishment Survey gives us just 1.9mm for 2017. Assuming December turns out equal or better than November’s “good” number, the year should end with a total payroll expansion around 2.1mm, maybe 2.2mm.


That’s less than two-thirds of the way to the nineties, and significantly less than half of the eighties. This year, no matter how many months at 200k plus, has not been a good one. In fact, payroll gains in the eleven months so far tallied by the BLS’s Establishment Survey are less than those presented in that transitional year of 2000.


This is how you get the newest generation of American adults yearning in greater numbers for something vastly different, a radical political change if for no other reason than the establishment here continuing to say that everything is good when by every reasonable standard it isn’t even close! The “robust” labor market even of the past few years isn’t nearly enough to draw in those still sitting on the sidelines struggling, however, they do (parents’ basements) to just get along, leaving the economy instead it’s “missing” 16.3 million; a number that in a truly robust economy would be falling not rising.
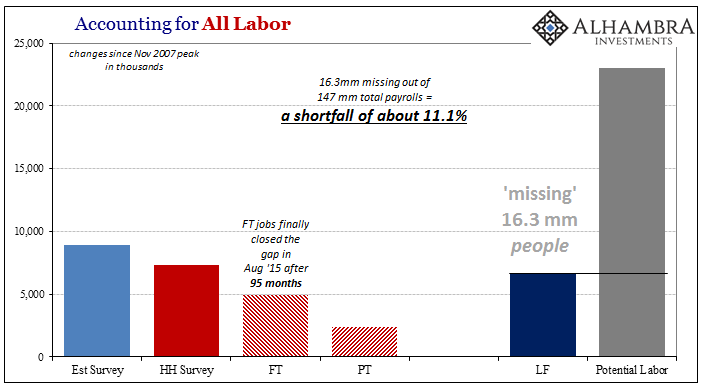


The issue clearly cannot be labor supply (Baby Boomer retirements, heroin, and fentanyl abuse in the Rust Belt) but shrunken labor demand; permanently shrunken economic demand. Therefore, there really should be no expectation for accuracy in the unemployment rate and what that means all around (inflation, baseline growth, monetary policy).

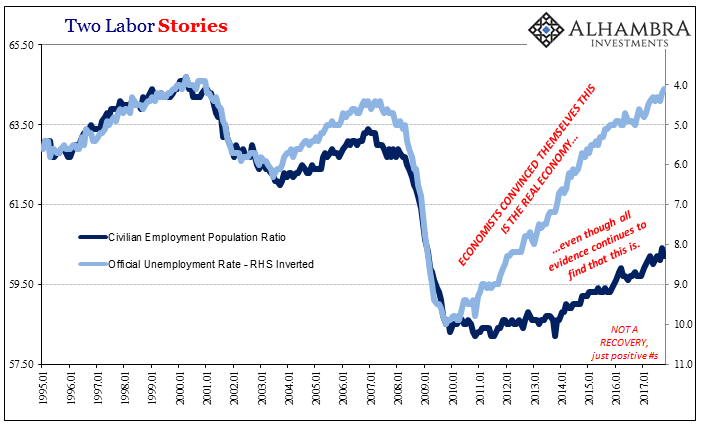


Once again in yet another month where the unemployment rate registers a ridiculous low, wages, and payroll earnings remain stuck at visibly low levels. The average weekly earnings of production and non-supervisory employees rose by just 2.6% year over year in November, after gaining 2.2% in October, 2.6% in September, and 2.7% in August. That’s nothing like in the past when the unemployment rate was where it is now. There is nothing like acceleration in earnings, not even solid growth.


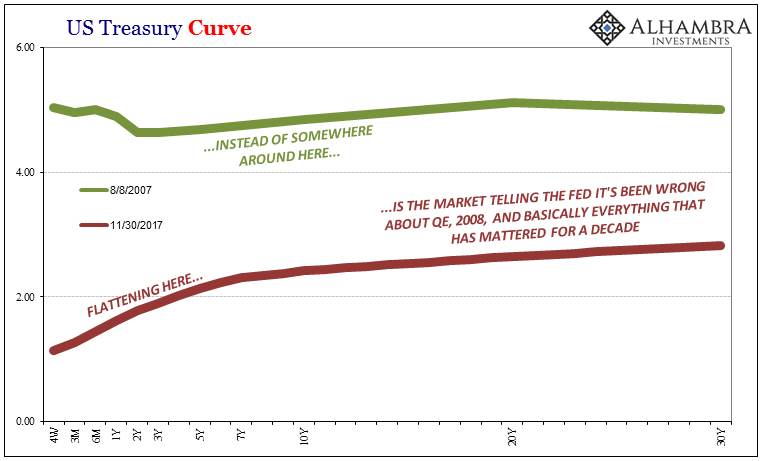
I don’t mean to make all this about the bond market every time (actually it’s appropriate), but the idea that treasuries at the long end have to be wrong has no basis other than misconception or intentional misdirection.
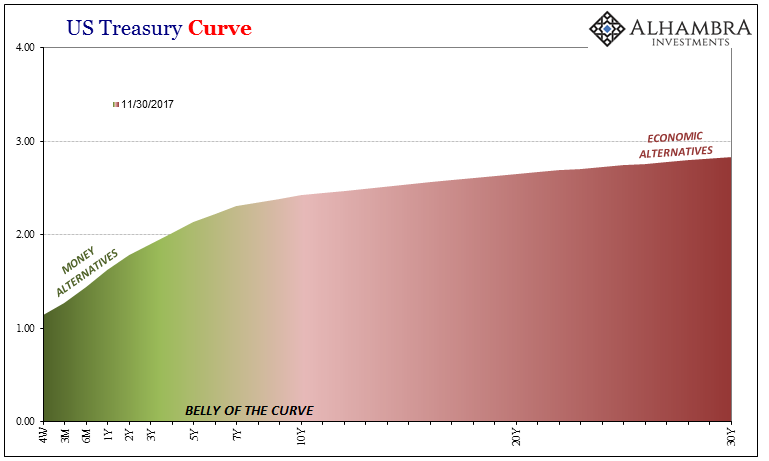


The data, including the BLS data, remains firmly on the side of flattening, and like the Establishment Survey’s paltry 1.9mm in 2017, it’s not even close.


Thursday, December 7, 2017

The End Is Near?


The End Is Near?


Written by Craig Hemke, Sprott Money News & TF Metals Report


The End Is Near? - Craig Hemke


For gold investors, the major thorn in our side continues to be the USDJPY so we need to discuss it again.


Over the past weekend at TFMR, we had a discussion about how so many well-intentioned people could have been so wrong about "the metals" over the past five years. It included this sentence: "What we failed to predict was the successful, collective manipulation of nearly all "markets" by the CBs, their primary dealers and their willing/sycophant media through HFT."


That one sentence could be the subject of a full post or podcast but, for now, let"s just focus upon the market manipulation through HFT. As you know by now, the USDJPY is just about the single most important general input for HFT buy/sell decisions. Whether it"s S&P futures, bond futures or Comex Gold, the direction of the USDJPY generally impacts all of these "markets" more than anything else. The chart below plots the inverse of USDJPY (JPYUSD) with gold futures. Note clear correlation that began in 2008.


In observing the central bank market manipulation...when we see the same pattern again and again...and this pattern is followed by the desired equity or bond market reaction...then you know something is up. How many times have we captured screenshots of the BoJ, Fed, SNB or whomever buying the USDJPY in size at just the right moment to create and paint a double bottom on the chart? From there, how many times have we watched a near perfect and uninterrupted, 45-degree angle recovery ensue?


Here are just a couple of egregious examples that I just chose at random from my desktop folder that holds about 40 charts. (I"ve only been keeping them since late summer.)


Well, since we just used the term "egregious", let"s apply it again to the charts below. Recall that things were sailing along surprisingly well last Monday. Over the previous week, the USDJPY had failed to hold support near 113 and again near 112 and it had fallen to near and just below the very-important 111 level. Then, as we chronicled that day, a sudden spike occurred on NO NEWS and not even any rumors. Just a spike from out of the blue that drove the pair immediately back above 111.


And what followed over the next five days? Well, outside of the sudden plunge on the now disproven stories from Brian Ross at ABC News, the USDJPY has followed the same glide path all the way back to 113. Also, IT"S VERY IMPORTANT TO NOTE where USDJPY reopened Sunday afternoon...RIGHT ON the glidepath. Remove the reaction to Friday"s unexpected headlines and it"s a near-perfect, 45-degree angle for nearly FIVE FULL DAYS.


(And in case you"re wondering which tail wags which dog, note the turn in USDJPY last Monday clearly preceded the turn in the S&P.)


How is this even possible? It"s not...well, at least not in the traditional and "free market" sense...the pre-2008 and pre-2012 sense. All of these things used to move somewhat independently as human, carbon-based traders made rational investment decisions based upon a number of inputs. However, in 2017, where 90% of all trading is now done through HFT....well, the results are pretty clear. The Central Banks and their Primary Dealer trading desks manipulate the key inputs and HFT does the rest. This is why yours truly and so many other "experts and mavens" have been confounded for the past five years. It"s not nefarious intent and it"s not because gold bugs are cruel, heartless charlatans who are intent upon stealing as many dollars as possible from the easily-duped. Instead, it is a failure to anticipate the levels to which The Central Banks would successfully go to keep their system alive.


Understanding this is why you consistently hear me cite the refrain of PHYSICAL DEMAND. It is only through a renewed crisis of confidence that this system can be broken...at least as it pertains to the precious metals. Physical demand will bust The Bullion Banks by breaking their just-in-time and unallocated delivery system. Physical demand will force price to be discovered through the exchange of physical metal, not the alchemized digital garbage that permeates the system today.


We"ll leave you today with stories from each end of The Bank monster. The first, and one that we"ve been following closely since last March, is the continued run-up to renewed war on The Korean Peninsula. WHILE NO ONE IN THEIR RIGHT MIND IS CHEERING THIS ON, it is important to be prepared for all of the unknown unknowns that would come with such a catastrophe, one of them being financial calamity that could again shatter confidence in the current system.


http://theweek.com/articles/740264/why-north-korea...


And the other story deals with gold alchemy and the continued shunting of physical demand into sham/scam paper investments. It seems the World Gold Council is hungry to increase their fees. They are apparently planning to offer a whole new "gold" ETF, perhaps designed to compete with the IAU. Ask yourself, from where will this fund get the 200-300 metric tonnes of gold needed to fund its "inventory"? Once again, The Banks will simply perform the alchemy of leveraging current unallocated stockpiles into more and more digital "gold".


http://www.etf.com/sections/daily-etf-watch/new-ph...


Again, true physical demand is the only antidote to the poison created by the Central Bankers and the Bullion Banks. Sadly, 2018 promises another surge in war, debt, negative interest rates and de-dollarization. Will these events finally prompt enough physical demand to break The Banks? Only time will tell.


Questions or comments about this article? Leave your thoughts HERE.


The End Is Near?


Written by Craig Hemke, Sprott Money News & TF Metals Report


Check out these other articles by our contributors:


Craig Hemke -   Another Tradable Low Coming


John Rubino - Finally, An Honest Inflation Index – Guess What It Shows


Jeff Thomas - Tilt! Game Over


Ask The Expert: Jim Willie

Thursday, November 30, 2017

Great News From McKinsey: Robots Will Take 800 Million Jobs Worldwide By 2030

Stories about robots taking over from humans have become prevalent. Recently we’ve written about a new Manhattan Shake Shack replacing human cashiers with robots, killer robots (a.k.a. lethal autonomous weapons systems), a Californian real estate company replacing commission-based human agents with robots, a cocaine workshop in Brazil with robots packing 150,000 baggies a day and the first robot to be awarded citizenship which hopes for “harmony with humans”. No chance.


In June, we discussed a McKinsey & Co. report which stated that US manufacturing could be poised for a recovery and not because of Trump’s policies. Indeed, McKinsey’s rationale was based on automation weakening the case for labour arbitrage. James Manyika, McKinsey Global Institute director, commented.


“Even if we rebuild factories here and you build plants here, they’re just not going to employ thousands of people -- that just doesn’t happen. Find a factory anywhere in the world built in the last 5 years -- not many people work there.”


Pressing home the bad news for humans everywhere, both in developed and emerging nations. McKinsey has published a new report with truly dire conclusions, as Bloomberg reports.


As many as 800 million workers worldwide may lose their jobs to robots and automation by 2030, equivalent to more than a fifth of today’s global labor force. That’s according to a new report covering 46 nations and more than 800 occupations by the research arm of McKinsey & Co.


The consulting company said Wednesday that both developed and emerging countries will be impacted. Machine operators, fast-food workers and back-office employees are among those who will be most affected if automation spreads quickly through the workplace.


This fits with a Bloomberg chart we’ve used before showing industries most at risk to automation.


There is some "moderately" good news, if the robotic takeover is “less rapid” than McKinsey is currently forecasting.


some 400 million workers could still find themselves displaced by automation and would need to find new jobs over the next 13 years, the McKinsey Global Institute study found.


If you’re one of the 800 million, or maybe 400 million, displaced workers, don’t despair if you like gardening or looking after the elderly. Bloomberg continues.


The good news for those displaced is that there will be jobs for them to transition into, although in many cases they’re going to have to learn new skills to do the work. Those jobs will include health-care providers for aging populations, technology specialists and even gardeners, according to the report.


“We’re all going to have to change and learn how to do new things over time,” Michael Chui, a San Francisco-based partner at the institute, said in an interview.


Somehow, we doubt that the optimistic Mr. Chui is referring to himself, although you never know. We remember working for a high-profile British merchant bank in the 1990s, let’s just call it S.G. Warburg, which, after decades of success had lost its way slightly. The Chairman – often referred to as the “Fat Controller” by his underlings - invited the bank’s leading shareholders to dinner. We’re paraphrasing, but his message was “Don’t worry, we’ve got McKinsey coming in.” Hearing that, the major shareholders decided that the “game was up” and the bank lost its independence afterwards. Meanwhile, after another robot report from McKinsey, we like to find solace in previous predictions of labour market demise.


"We are being afflicted with a new disease of which some readers may not have heard the name, but of which they will hear a great deal in the years to come—namely, technological unemployment" - Keynes, 1930
 
“Labor will become less and less important..More and more workers will be replaced by machines. I do not see that new industries can employ everybody who wants a job” -Leontief, 1952


Wednesday, November 29, 2017

Recovery? We Have Tripled The Number Of Store Closings From Last Year...

Authored by Michael Snyder via The Economic Collapse blog,


Did you know that the number of retail store closings in 2017 has already tripled the number from all of 2016?


Last year, a total of 2,056 store locations were closed down, but this year more than 6,700 stores have been shut down so far. 


That absolutely shatters the all-time record for store closings in a single year, and yet nobody seems that concerned about it.  In 2008, an all-time record 6,163 retail stores were shuttered, and we have already surpassed that mark by a very wide margin.  We are facing an unprecedented retail apocalypse, and as you will see below, the number of retail store closings is actually supposed to be much higher next year.


Whenever the mainstream media reports on the retail apocalypse, they always try to put a positive spin on the story by blaming the growth of Amazon and other online retailers.  And without a doubt that has had an impact, but at this point online shopping still accounts for less than 10 percent of total U.S. retail sales.


Look, Amazon didn’t just show up to the party.  They have been around for many, many years and while it is true that they are growing, they still only account for a very small sliver of the overall retail pie.


So those that would like to explain away this retail apocalypse need to come up with a better explanation.


As I noted in the headline, there are 20 different major retail chains that have closed at least 50 stores so far this year.  The following numbers originally come from Fox Business


1. Abercrombie & Fitch: 60 stores
2. Aerosoles: 88 stores
3. American Apparel: 110 stores
4. BCBG: 118 stores
5. Bebe: 168 stores
6. The Children’s Place: hundreds of stores to be closed by 2020
7. CVS: 70 stores
8. Guess: 60 stores
9. Gymboree: 350 stores
10. HHgregg: 220 stores
11. J.Crew: 50 stores
12. JC Penney: 138 stores
13. The Limited: 250 stores
14. Macy’s: 68 stores
15. Michael Kors: 125 stores
16. Payless: 800 stores
17. RadioShack: more than 1,000 stores
18. Rue21: up to 400 stores
19. Sears/Kmart: more than 300 stores
20. Wet Seal: 171 stores


If the U.S. economy was really doing well, then why are all of these major retailers closing down locations?


Of course the truth is that the economy is not doing well.  The U.S. economy has not grown by at least 3 percent in a single year since the middle of the Bush administration, and it isn’t going to happen this year either.  Overall, the U.S. economy has grown by an average of just 1.33 percent over the last 10 years, and meanwhile U.S. stock prices are up about 250 percent since the end of the last recession.  The stock market has become completely and utterly disconnected from economic reality, and yet many Americans still believe that it is an accurate barometer for the health of the economy.


I used to do a Black Friday article every year, but I have ended that tradition.  Yes, there were still a few scuffles this year, but at this point the much bigger story is how poorly the retailers are doing.


So far this year, more than 300 retailers have filed for bankruptcy, and we are currently on pace to lose over 147 million square feet of retail space by the end of 2017.


Those are absolutely catastrophic numbers.


And some analysts are already predicting that as many as 9,000 stores could be shut down in the United States in 2018.


Are we just going to keep blaming Amazon every time another retail chain goes belly up?


What we should really be focusing on is the fact that the “retail bubble” is starting to burst.  In the aftermath of the last financial crisis, retailers went on an unprecedented debt binge, and now a lot of that debt is starting to go bad.


In fact, in a previous article I discussed the fact that “the amount of high-yield retail debt that will mature next year is approximately 19 times larger than the amount that matured this year”.  This is going to have very serious implications on Wall Street, but very few people are really talking about this.


Most stores try to stay open through Christmas, but once the holiday season is over we will see another huge wave of store closings.


And as individual stores close down, this will put a lot of financial pressure on malls and shopping centers.  Not too long ago, one report projected that up to 25 percent of all shopping malls in the entire nation could close down by 2022, but I tend to think that number is too optimistic.


The retail industry in the United States is dying, and the biggest reason for that is not Amazon.


Rather, the real reason why the retail industry is in so much trouble is because of the steady decline of the middle class.  The gap between the ultra-wealthy and the rest of us is greater than ever, and we can clearly see the impact of this in the retail world.


Retailers that serve the very wealthy are generally doing well, and those that serve the other end of the food chain (such as dollar stores and Wal-Mart) are also doing okay.


But virtually all of the retailers that depend on middle class shoppers are really struggling, and this is going to continue for the foreseeable future.


Most American families are either living paycheck to paycheck or are close to that level, and these days U.S. consumers simply do not have much discretionary income to play around with.  More hard working Americans are going to fall out of the middle class with each passing month, and that is extremely bad news for a retail industry that is literally falling apart right in front of our eyes.


*  *  *


Michael Snyder is a Republican candidate for Congress in Idaho’s First Congressional District, and you can learn how you can get involved in the campaign on his official website. His new book entitled “Living A Life That Really Matters” is available in paperback and for the Kindle on Amazon.com.


Tuesday, November 21, 2017

Britain"s Gravest Economic Challenge Isn"t Brexit

Authored by Paul Wallace, op-ed via Reuters.com,


Few British budgets have mattered as much as the one that Philip Hammond will deliver to the House of Commons on Nov. 22.


The chancellor of the exchequer must shore up Theresa May’s perilously shaky government ahead of a vital Brexit summit of European leaders in mid-December. At the same time Hammond has to keep a grip on the public finances.


But the gravest challenge he faces is economic: Britain’s persistent productivity blight.


Productivity – output per hour worked – is the mainspring of economic growth.


In the decade before the financial crisis of 2007-08 productivity was increasing in Britain by just over 2 percent a year, outpacing the average for the other economies of the G7. But since the crisis British performance has been dismal. Although productivity jumped in the third quarter of 2017, prolonged weakness means that it is barely higher than its pre-crisis peak a decade ago. The recovery in GDP has been driven overwhelmingly by more labor input, a source of growth that is running dry – not least since the vote to leave the European Union delivered a message to curb immigration.


Other advanced economies have also experienced setbacks to productivity growth following the financial crisis. Where Britain stands out is in the severity of its reverse. The shortfall in productivity is the main reason real wages are now 4 percent lower than 10 years ago, a potent reason why the leave campaign prevailed in the Brexit referendum.


Productivity is so central to prosperity and to macroeconomic management – by determining how fast the economy can sustainably grow – that a gaggle of economic researchers have been busy in their labs trying to diagnose the now decade-long disease. Early detective work highlighted the impact of the financial crisis itself, which was especially severe in Britain. This held back productivity by throttling bank credit to new potentially fast-growing ventures and by jamming up the usual way in which capital moves from declining to advancing sectors. 


But as the crisis has receded and British banks have become better capitalized this explanation is less convincing. Longer-term forces appear to be in play in Britain and elsewhere. Firms at the technological frontier continue to forge ahead in raising productivity. However, the diffusion of their best practices within economies has slowed. An aging workforce is now acting as a drag. And the contribution to productivity from improved educational attainment is falling.


One reason the productivity setback has been particularly severe in Britain is that its apparently robust performance before the crisis was overstated and unsustainable. Banking activities ballooned on the basis of what turned out to be economically and socially harmful practices such as risky securitizations. Despite making up less than a tenth of the economy, the financial sector has been responsible for nearly a third of the productivity slowdown. Longstanding weaknesses in qualifications and skills have also become more damaging as business becomes more knowledge-based. Over a quarter of British working-age adults perform poorly in numeracy or literacy or both.


Investment is inadequate, too. Although firms have stepped up their capital spending after it collapsed during the recession, they have done much less so than in previous recoveries. Business investment is only 5 percent above its pre-crisis high a decade ago. At a similar stage in the recoveries following recessions at the start of 1980s and of the 1990s it was 63 percent and 30 percent higher than the respective previous peaks.


The reluctance to invest in turn is rooted in a financial and business culture that is especially and perniciously short-termist in Britain. Firms under pressure from the markets are reluctant to make the strategic investments needed to keep productivity moving ahead. And too many British managers are simply not good enough.


Although a definitive diagnosis of the British productivity disease remains elusive there is a surprising degree of consensus about the treatment needed to resuscitate the patient. The chancellor’s to-do list should include steps to tackle congested roads and overcrowded trains, to support the sciences, to foster R&D in the private sector, and to upgrade Britain’s poor skills. Since competition spurs higher productivity as new and smarter firms drive out older and less productive businesses, Hammond needs Britain to be as open an economy as possible.


The remedies make good sense but they will not rescue the chancellor, who has in any case already announced more spending on infrastructure. First, they will take time to be effective. Second, finding more money for austerity-hit public services such as policing and health will add to the pressures on the public finances. And third, Brexit is now contributing to the productivity malaise as businesses respond to corrosive uncertainties by curbing their investment plans and as Britain becomes less open to trade by leaving the EU. Raising taxes is always an option for a cash-strapped chancellor, but it would be highly unpopular − not least in the bitterly divided Conservative party.


When he presents his budget, Hammond can be expected to put a brave face on things. He will point to the fall in the budget deficit from a peak of almost 10 percent of GDP after the financial crisis to 2.3 percent of GDP in the financial year ending in March 2017. But what matters now is the future path of the public finances. Britain’s poor productivity prospects will box the chancellor in because GDP is the tax base and future revenues will be smaller to the extent that output per hour worked continues to stall.   


The harsh reality is that Brexit will blight the public finances by hurting productivity. While Prime Minister May might see Britain’s overriding priority as ensuring that next month’s summit enables the Brexit talks to move on to trade, she’ll have to broaden her focus if she hopes to stay in office long enough to secure a deal that minimizes the damage Brexit is inflicting on the economy.


Monday, November 20, 2017

The Difference Between GAAP And Non-GAAP Q3 EPS For The Dow Jones Was 16%

The last time we looked at the near-record difference between GAAP and non-GAAP Dow Jones earnings, we found that it had crept to a (virtually) unprecedented 25%. To be sure, that was exactly one year ago, when the economy was perceived as being in worse shape than it is now, thanks to the narrative of a "global coordinated recovery" which is really just record central bank liquidity injections, and Chinese credit creation, both of which have recently hit the brakes.


That said, going back to the question of GAAP vs non-GAAP divergence, one would assume that in light of the so-called global recovery of 2017, company earnings would be more real and not the "pro forma, one-time, non-recurring" fabrication that US corporations are so fond of. Alas, one would be wrong.


As Factset"s John Butters writes in a recent blog post, as of today, all of the companies in the Dow Jones Industrial Average (DJIA) have reported actual EPS for Q3 2017, which brings up several questions: what percentage of these companies reported non-GAAP EPS for Q3 2017? What was the average difference and median difference between non-GAAP EPS and GAAP EPS for companies in the DJIA for Q3 2017? How did these differences compare to recent quarters?


Here are the answers:


For Q3 2017, 21 (or 70%) of the 30 companies in the DJIA reported non-GAAP EPS in addition to GAAP EPS for the third quarter. Of these 21 companies, 16 (or 76%) reported non-GAAP EPS that exceeded GAAP EPS. Over the past six quarters (Q1 2016 – Q2 2017) 68% of the companies in the DJIA reported non-GAAP EPS in addition to GAAP EPS and 80% of these companies reported non-GAAP EPS that exceeded GAAP EPS.


Thus, slightly more companies in the DJIA reported non-GAAP EPS in Q3 2017 relative to the average of the past six quarters, while slightly fewer companies in the DJIA reported non-GAAP EPS above GAAP EPS in Q3 2017 relative to the average over the past six quarters.


For Q3 2017, the average difference between non-GAAP EPS and GAAP EPS for all 21 companies was 284.1%, while the median difference between non-GAAP EPS and GAAP EPS for all 21 companies was 10.1%. The average difference between non-GAAP EPS and GAAP EPS for the DJIA was unusually large in the third quarter because of Merck. The company reported non-GAAP EPS of $1.11 and GAAP EPS of -$0.02 for the quarter. Thus, the percentage difference between non-GAAP EPS and GAAP EPS for Merck for Q3 exceeded 5000% (on an absolute basis).


So let"s normalize: excluding Merck, the average difference between non-GAAP EPS and GAAP EPS for the remaining 20 DJIA companies was 15.8%. How does that number look in context: Over the past six quarters, the average difference between non-GAAP EPS and GAAP EPS for companies in the DJIA was 72.8%, while the median difference between non-GAAP EPS and GAAP EPS was 13.4%.


Finally, if one takes the average of the median DJIA median differences for the past 4 quarters (LTM), one gets just over 14% (and 15.8% if "normalizing" the latest quarter"s data).


This means that while the forward non-GAAP P/E multiple may be 18x based on a 33.4 (non-GAAP) S&P EPS, if one assumes that roughly 14% of the latest earnings, and those projected for the next 5 quarters, are "fluff" then applying a 14% haircut to the forward consensus EPS of 143... 


... which amounts to 123 in EPS for the S&P500 - then the market"s forward GAAP PE multiple is 21x. With the exception of the pre-dot com burst, the market"s forward P/E multiple has never been that high.


Is Financial Argmageddon Bullish For Stocks? One Bank"s Surprising Answer

Everyone knows that after nearly a decade of capital markets central planning by the world"s central banks, "good news is bad news." But did you also know that financial armageddon has become the most bullish catalyst to buy stocks? That"s the understated take-home message from the year ahead preview by Macquarie"s Viktor Shvets published last week. It is also the conclusion that One River Asset Management"s Eric Peters reached in his latest weekend notes.


While we will have much more to comment on Macquarie"s rather macabre 2018 preview, which is arguably one of the most honest, comprehensive, and objective predictions of what to expected from the "central bank/market confidence boosting nexus", we will highlight the one argument that has served to promote countless BTFD algo-driven stock rips, summarized in the following blurb, which is a sublime explanation by Viktor Shvets the worst things are, the more you should buy:


If volatilities jump, CBs would need to reset the ‘background picture’. The challenge is that even with the best of intentions, the process is far from automatic, and hence there could be months of extended volatility (a la Dec’15-Feb’16). If one ignores shorter-term aberrations, we maintain that there is no alternative to policies that have been pursued since 1980s of deliberately suppressing and managing business and capital market cycles. [T]his implies that a relatively pleasant ‘Kondratieff autumn’ (characterized by inability to raise cost of capital against a background of constrained but positive growth and inflation rates) is likely to endure. Indeed, two generations of investors grew up knowing nothing else. They have never experienced either scorching summers or freezing winters, as public sector refused to allow debt repudiation, deleveraging or clearance of excesses. Although this cannot last forever, there is no reason to believe that the end of the road would necessarily occur in 2018 or 2019. It is true that policy risks are more heightened but so is policy recognition of dangers.


We therefore remain constructive on financial assets (as we have been for quite some time), not because we believe in a sustainable and private sector-led recovery but rather because we do not believe in one, and thus we do not see any viable alternatives to an ongoing financialization, which needs to be facilitated through excess liquidity, and avoiding proper price and risk discovery, and thus avoiding asset price volatilities.


Translation: central banks remain trapped by the mountain-sized bubble they have blown with years of QE and ZIRP/NIRP, and once volatility returns, and risk assets plunge, CBs will have no choice but to scramble right back and prevent the pyramid from keeling over and undoing a decade of fake "wealth creation" which was pulled from the future to the tune of $15 trillion in central bank asset purchases, which while still rising is about to go into reverse in just over a year"s time.


If that"s not enough, here is One River"s Eric Peters, with the exact same conclusion:


Anecdote


“The market has an accident, the Fed returns to QE, slashes interest rates, bonds surge, stocks recover,” said the CIO, high atop his prodigious pile, alone. Staring into the distance. Squinting, straining.


“The correlation between bonds and equities remains negative, the risk parity equity/bond portfolios are dented but not destroyed. And we descend to the next lower level in real interest rates. US bond yields turn negative. In essence, we prolong the paradigm that has driven markets for a few decades.”


Far below, economies hummed in harmony, capitalists collecting their expanding share. “A continuation of this paradigm is what everyone believes. And I just doubt that outcome so sincerely.” Hidden within the distant economic whir, labor strived, struggled. Their wage growth anemic, their children indebted, career prospects uncertain.


“It has taken time, but the political context for a regime shift is now established; populism is evident in recent elections. And the academic context for a seismic economic policy shift is in place too.”


The extraordinary response to the global financial crisis prevented depression. But the price of salvation is proving to be as profound as it is impossible to precisely measure -- unexpected election outcomes, political paralysis, an isolationist America, de-globalization, fake news, opioid epidemics.


And connecting it all, a corrosive, woven thread; injustice, unfairness, inequality, hypocrisy, distrust, endemic, growing. “We are on the cusp of great change, the old paradigm is set to shift,” he said, at altitude, the air crisp, clear.


“The market has an accident, monetary policy is seen to be bust, the models have been wrong, we have to change what we do, we can’t go down the same route, we need to move to a different policy mix. Fiscal expansion, infrastructure, labor over capital. We’re moving to something that may be great for the economy, but no good for asset markets. New Regime -- end of story.”


Sunday, November 19, 2017

The U.S. Is Crushing Its Clean Energy Forecasts

Paris, schmarish...


In a February 2007 report, the United States Department of Energy made thirty-year predictions for the country"s energy usage and production. As Statista"s infographic below shows, using data from the non-profit international environmental pressure group Natural Resources Defense Council, these forecasts have so far been smashed.


Infographic: The U.S. Is Smashing Its Clean Energy Forecasts | Statista


You will find more statistics at Statista


Martin Armstrong details that actual CO2 emissions in 2016 have undercut the 2006 predictions by 24 percent.


In terms of the energy mix, power generated from coal was 45 percent beneath the forecast while clean(er) alternatives natural gas and wind/solar power saw overshoots of 79 and 383 percent, respectively.


Renewable energy infrastructure is also expanding at a much faster rate than was thought ten years ago. 2006"s prediction for installed solar was a massive 4,813 percent shy of the 2016 reality. The U.S now also has installed wind capacity of 82 gigawatts, 361 percent more than had been hoped for.


In fact, energy consumption in total was also 17 percent lower than expected... which is odd and perhaps a better indication of the recovery-less recovery"s reality?


Thursday, November 16, 2017

Looking For Inflation In All The Wrong Places

Authored by John Rubino via DollarCollapse.com,


A policeman sees a drunk man searching for something under a streetlight and asks what the drunk has lost. He says he lost his keys and they both look under the streetlight together. After a few minutes the policeman asks if he is sure he lost them here, and the drunk replies, no, and that he lost them in the park. The policeman asks why he is searching here, and the drunk replies, “this is where the light is”.The Streetlight Effect


The drunk in the above story is an idiot, of course. But no more so than modern economists who can’t find inflation because they’re looking only at the part of the economy covered by their government’s Consumer Price Index.


But gradually, grudgingly, a handful of mainstream economists do seem to be figuring out that the soaring value of stocks, bonds, real estate, fine art, collectibles and cryptocurrencies is a legitimate sign of a depreciating currency and future instability.


Inflation, in other words. From yesterday’s Morningstar:


Lack of inflation is a global issue


(Morningstar) – The lack of inflation is a global issue. Unemployment is at cyclical lows in the US, Germany, and Japan, yet in each of these countries there is only small evidence that wages are picking up. No doubt globalisation and technology are common factors that have helped constrain wages across countries.


The de-synchronised nature of the recovery until now has also capped inflation in countries whose currencies have appreciated on cyclical outperformance. From here, however, common global uplift should help neutralise some of these inter-country effects, and allow domestic conditions to play out more powerfully.


Central banks have been puzzled by the lack of inflation, but have not stepped away from its management as the primary goal of policy.


However, they’ve responded to the way QE’s impact has been much stronger in financial markets than the real economy by making financial conditions a larger part of their thinking, even if they’ve not formalised this in policy frameworks.


With inflation projected to lift and financial markets strong, we expect central banks to continue to gradually tighten.


Year to date, bond yields have drifted lower and curves are flatter, while credit spreads have continued to tighten.


Valuations of fixed-income assets have moved further into expensive territory with few exceptions. Term premium is close to historic lows and credit spreads at post-GFC tights.


Given this backdrop, our process continues to suggest defensive positioning remains appropriate until better value is restored. We see higher inflation and/or a faster pace of policy tightening as possible triggers.


This acknowledgement that soaring asset prices are kind-of-sort-of inflation is definitely progress, though the struggle it took to get there was obviously considerable.


A single paragraph stating that asset bubbles constitute an especially destabilizing kind of inflation and therefore caution is advisable going forward would have made the point in a fraction of the time.


But it’s better than nothing. And who knows, maybe it’s the start of a trend.


Monday, November 13, 2017

UBS Makes A Striking Discovery: Ex-Energy, US GDP Growth Is The Slowest Since 2010

Last week, UBS released its Global Economic Outlook forecast for 2018-2019, which coming in at over 220 pages and with more than 270 charts, is rather "difficult to summarize" as UBS" chief economist Arend Kapteyn snarkily notes. Still, as Kapteyn helpfully summarizes, the 3 charts below capture some of the main themes from the report, the first of which is a doozy and crushes the Trump "economic recovery" narrative .


Message 1: The 2017 global growth acceleration was largely (70%) a commodity bounce. This applies even to the US which was 20% of the global growth improvement but, as the 1st chart below shows, it was entirely energy investment. Once you strip that out "underlying" growth is only 1% or so (ex inventories) - the slowest since 2010 - and a significant amount of rotation now needs to take place from energy to non-energy investment just to sustain the current growth pace. The surveys suggest that is possible but the surveys have also consistently overstated growth so far. As Kapteyn adds, due to "skepticism about that rotation is why we are about 20bp below consensus for US growth next year." It also means that contrary to conventional wisdom, the US consumer has not only not turned the corner, but continues to retrench and with the personal savings rate plunging to 10 years lows, there is little hope that personal consumption expenditures will be a significant driver of US growth for the foreseeable future.


More details from UBS:


In Figure 5 we show what we think the contributions to US headline growth have been from the energy sector (structures and equipment investment combined). This is depicted as the grey area. The blue line is headline growth (ex-inventories) and the red line is headline growth minus the energy sector investment contribution, which we call "underlying growth ex-energy". Taken at face value, the chart suggests underlying US growth has been slowing dramatically, from about 2.6% in 2015 to only around 1% in 2017. We do not quite interpret it that way, and view it more as a story of stability and "adding-up constraints". The economy can only produce so much, and when one sector is strong (energy), it absorbs labour disproportionately, while other sectors pull back. Furthermore, when investment is weak the consumer accelerates. US growth post-crisis has hovered around a 2% average and nothing in our recession probability models suggests that there is anything ominous going on. But the point of Figure 5 is to show that as energy investment runs out of steam, other sectors will need to accelerate 

significantly to maintain the current pace of growth.


Message 2: The one (developed market) country that no one thinks can generate inflation (Japan) is likely to create more inflation than any other developed market.


"Japan is cyclically 2 years ahead of most other countries and it has a textbook Phillips curve with higher Phillips curve wage and price coefficients than all the other countries we looked at. The labour market is already extraordinarily tight."


If unemployment goes to 2.5% by end-2018 UBS sees (BoJ) core inflation going up towards 1.5% (70bp above consensus) and Yield Curve Control starting to get tweakend (10y  JGB to drift higher.


Message 3 : The Fed is going to $4 trillion in US Treasuries by 2025 even absent a recession, $1.5 trillion more than they hold today. The is because the Fed will hit a trough determined by the "floor system" for monetary policy coupled with some other balance sheet changes, of around $ 3 ¼ trillion by mid-2020 and currency in circulation growth then starts to drive the dynamics of the balance sheet. If they still want to roll off the MBS book they need to buy UST. That is part of the reason that the aggregate size of the G3 central balance sheet by 2025 will still be roughly as large as where it was late last year. And that"s with some fairly aggressive assumptions about BoJ balance sheet roll-off. So good for term premium.