Showing posts with label SNB. Show all posts

Monday, December 25, 2017

As Good As It Gets?

Authored by Sven Henrich via NorthmanTrader.com,


So they got their tax cut done. In the middle of the night again no less, despite the vast majority of the American people not wanting it. The reason may simply be that the American public is not believing the false narratives that are being sold to them. And who can blame them? It starts at the top after all. When Donald Trump claims the tax plan would personally hurt him everyone knows that’s simply not true. And still his agents insists on defending the lie by lying some more.


So I had to ask, does truth still matter:


The answer may not reveal itself for months to come.


US cooperations will see benefits to GAAP earnings and they will increase dividends and buybacks. All true. But they will not hire more or pay more. We already know this:


And since none of these things have to do with organic business growth corporations will eventually face a situation where in the following years an unfavorable comparison will emerge as the artificial earnings benefits are priced in and then earnings growth will look to drag in comparison as the organic growth won’t make up for the artificial delta. Ironically then pressure for efficiency improvements will arise and companies will rightsize in the name of efficiency gains to make up the difference, i.e. layoffs. So ironically corporate tax cuts in the long term will do the opposite of what they were advertised to do. One can virtually see it coming. But hey. Party away.


Fact is the tax cuts will not pay for themselves and deficits will be gigantic and the US treasury is already set to sell $1.3 trillion in debt next year alone.


My general premise is that deficits will further explode once the economy slows as the tax base will have shrunk. Paul Ryan is already on the record wanting to cut social security and medicare benefits. And the AARP knows who will get hurt:


Short term gain, long term pain, but the architects of this construct will be long gone enjoying their gains.


It’s been said that bull markets end on good news and in this regard this may be as good as it gets.


2017 will go down in history as a year where markets got everything beyond their wildest imagination:


The most liquidity injections by central banks ever. (Over $2 trillion). The loosest financial conditions in cycle history:


A Fed that promised a reduction in its balance sheet but actually only delivered noise:


In addition markets got to enjoy solid earnings growth coming from weakness in the years before. Never mind that most of the price expansion was multiple expansion related:


Other factors favoring asset prices: Negative interest rates across the globe continued to force money into high risk assets (“pushing people“). Central banks such as the SNB kept buying billions of dollars of US stocks. Record inflows of passive ETF inflows chasing returns they can’t find elsewhere. The elimination of organic sellers as part of a normally functioning market place. Buybacks, while not at a record pace, still continuing with billions upon billions of dollars allocated to reduce the float of shares. None of it related to organic growth.


And hence the disconnect of asset valuations from the underlying economy is now larger than during previous market peaks:


My summation here: Things will never be better for bulls. The supply demand equation will never be tilted so uniformly in one direction as they are now.


The combined effect of what I summarized above has produced massive multiple expansion and the end of any corrective activity in markets accompanied by record volatility compression:


The elimination of any price discovery. And what this chart above shows in the macro we see in the daily price action every day: Gaps, ramps & camps with virtually no price discovery in between:


Every day:


This is hubris. It’s not rooted in an economic growth base to back up the valuation growth presumed going forward. And the technical dislocation is not sustainable and I maintain all these gaps will fill into 2018.


Has it gone farther than we expected? Sure. Once you remove sellers from a market who knows where it ends up.


After all we find ourselves in an environment where companies can reach $10 billion market caps in the blink of an eye based on absolutely nothing.


The very definition of a mania.


So when I asked the other day whether we are sitting on a generational opportunity to sell equities I meant this not as a facetious question. Now granted I can’t say whether we top here, today or next year.


After all we now have a president literally promising higher stock prices on twitter:


Stock prices are now a matter of national security. The Fed views a sudden decline in asset prices as a threat to the economy and the president sees stock market levels, the poster child of widening wealth inequality in the population, as a benchmark of his presidency:


What hasn’t been priced in: Less looser financial conditions, less central bank liquidity, no more tax cut carrot. But perhaps more importantly? How sensitive will the consumer be to higher rates? I asked this question in Riddle me this.


Fact is consumers keep piling into debt while rates are rising:


And with rising rates come higher interest payments:


I trust you see the math problem there. Indeed the majority of Americans may find that the tax cut crumbs coming their way may go toward servicing their debt:


Perhaps that’s ok if unemployment stays low forever:


The unemployment chart however suggests that this is as good as it gets.


Thursday, December 7, 2017

The End Is Near?


The End Is Near?


Written by Craig Hemke, Sprott Money News & TF Metals Report


The End Is Near? - Craig Hemke


For gold investors, the major thorn in our side continues to be the USDJPY so we need to discuss it again.


Over the past weekend at TFMR, we had a discussion about how so many well-intentioned people could have been so wrong about "the metals" over the past five years. It included this sentence: "What we failed to predict was the successful, collective manipulation of nearly all "markets" by the CBs, their primary dealers and their willing/sycophant media through HFT."


That one sentence could be the subject of a full post or podcast but, for now, let"s just focus upon the market manipulation through HFT. As you know by now, the USDJPY is just about the single most important general input for HFT buy/sell decisions. Whether it"s S&P futures, bond futures or Comex Gold, the direction of the USDJPY generally impacts all of these "markets" more than anything else. The chart below plots the inverse of USDJPY (JPYUSD) with gold futures. Note clear correlation that began in 2008.


In observing the central bank market manipulation...when we see the same pattern again and again...and this pattern is followed by the desired equity or bond market reaction...then you know something is up. How many times have we captured screenshots of the BoJ, Fed, SNB or whomever buying the USDJPY in size at just the right moment to create and paint a double bottom on the chart? From there, how many times have we watched a near perfect and uninterrupted, 45-degree angle recovery ensue?


Here are just a couple of egregious examples that I just chose at random from my desktop folder that holds about 40 charts. (I"ve only been keeping them since late summer.)


Well, since we just used the term "egregious", let"s apply it again to the charts below. Recall that things were sailing along surprisingly well last Monday. Over the previous week, the USDJPY had failed to hold support near 113 and again near 112 and it had fallen to near and just below the very-important 111 level. Then, as we chronicled that day, a sudden spike occurred on NO NEWS and not even any rumors. Just a spike from out of the blue that drove the pair immediately back above 111.


And what followed over the next five days? Well, outside of the sudden plunge on the now disproven stories from Brian Ross at ABC News, the USDJPY has followed the same glide path all the way back to 113. Also, IT"S VERY IMPORTANT TO NOTE where USDJPY reopened Sunday afternoon...RIGHT ON the glidepath. Remove the reaction to Friday"s unexpected headlines and it"s a near-perfect, 45-degree angle for nearly FIVE FULL DAYS.


(And in case you"re wondering which tail wags which dog, note the turn in USDJPY last Monday clearly preceded the turn in the S&P.)


How is this even possible? It"s not...well, at least not in the traditional and "free market" sense...the pre-2008 and pre-2012 sense. All of these things used to move somewhat independently as human, carbon-based traders made rational investment decisions based upon a number of inputs. However, in 2017, where 90% of all trading is now done through HFT....well, the results are pretty clear. The Central Banks and their Primary Dealer trading desks manipulate the key inputs and HFT does the rest. This is why yours truly and so many other "experts and mavens" have been confounded for the past five years. It"s not nefarious intent and it"s not because gold bugs are cruel, heartless charlatans who are intent upon stealing as many dollars as possible from the easily-duped. Instead, it is a failure to anticipate the levels to which The Central Banks would successfully go to keep their system alive.


Understanding this is why you consistently hear me cite the refrain of PHYSICAL DEMAND. It is only through a renewed crisis of confidence that this system can be broken...at least as it pertains to the precious metals. Physical demand will bust The Bullion Banks by breaking their just-in-time and unallocated delivery system. Physical demand will force price to be discovered through the exchange of physical metal, not the alchemized digital garbage that permeates the system today.


We"ll leave you today with stories from each end of The Bank monster. The first, and one that we"ve been following closely since last March, is the continued run-up to renewed war on The Korean Peninsula. WHILE NO ONE IN THEIR RIGHT MIND IS CHEERING THIS ON, it is important to be prepared for all of the unknown unknowns that would come with such a catastrophe, one of them being financial calamity that could again shatter confidence in the current system.


http://theweek.com/articles/740264/why-north-korea...


And the other story deals with gold alchemy and the continued shunting of physical demand into sham/scam paper investments. It seems the World Gold Council is hungry to increase their fees. They are apparently planning to offer a whole new "gold" ETF, perhaps designed to compete with the IAU. Ask yourself, from where will this fund get the 200-300 metric tonnes of gold needed to fund its "inventory"? Once again, The Banks will simply perform the alchemy of leveraging current unallocated stockpiles into more and more digital "gold".


http://www.etf.com/sections/daily-etf-watch/new-ph...


Again, true physical demand is the only antidote to the poison created by the Central Bankers and the Bullion Banks. Sadly, 2018 promises another surge in war, debt, negative interest rates and de-dollarization. Will these events finally prompt enough physical demand to break The Banks? Only time will tell.


Questions or comments about this article? Leave your thoughts HERE.


The End Is Near?


Written by Craig Hemke, Sprott Money News & TF Metals Report


Check out these other articles by our contributors:


Craig Hemke -   Another Tradable Low Coming


John Rubino - Finally, An Honest Inflation Index – Guess What It Shows


Jeff Thomas - Tilt! Game Over


Ask The Expert: Jim Willie

Monday, November 6, 2017

Tech Stocks Accounted For 75% Of The Market"s October Return

For some context on the unprecedented dominance of the tech sector on the overall market, here is some perspective from BofA"s Savita Subramanian on October returns, when Tech continued to lead the other ten sectors, generating +7.8% on a total return basis. This translates into a whopping 75% of the S&P 500"s return last month!


Furthermore, with virtually every lagging hedge fund rushing to buy the tech sector, chasing such activist central banks as the SNB, the sector"s 24.5% weight in the S&P 500 is now the highest since October 2000.


That said, considering tech companies reported some of the strongest 3Q earnings results, the best revision trends, and rank at the top of BofA"s quant model, is there anything to be concerned about?


According to BofA, the biggest risk is the extreme crowding and positioning by fund managers. As Subramanian expains: "we hear frequently from clients, "you don"t want to sell Tech until year end." And funds certainly reflect this sentiment: Tech is the most overweighted sector by large cap active managers, displacing Discretionary whose relative weight dropped for the sixth consecutive month." As noted above, the recent Tech rally means the sector now represents 24% of the S&P 500 index - a post-tech bubble high - and a remarkable 30% of all active fund holdings today, the highest levels in BofA data history since 2008 (Chart 1).


What about other sectors: in addition to Tech, Utilities (+3.9%), Materials (+3.9%), and Financials (+2.9%) outperformed last month. Laggards were generally defensive: Telecom (-7.6%), Staples (-1.4%) and Health Care (-0.8%) underperformed the most, while Energy (-0.7%) was also in the red despite the rally in oil prices.


YTD, Tech maintains its dramatic lead (+37.2%), contributing just under half of the S&P 500"s 16.9% total return, followed by Materials (+20.3%) and Health Care (+19.4%). Telecom (-11.9%) and Energy (-7.2%) remain in the red.


To be sure, the impact of tech on underlying financial metrics is also staggering, as the following charts from Credit Suisse show: with tech, EBITDA margins are near all time high. Ex tech, they are roughly 3% lower and in secular decline, courtesy of high barriers to entry.


The next chart shows that while tech holds the highest share of S&P market cap, it is also the fastest growing sector.


And while the massive crowding in the tech sector is a red flag for Bank of America, for Credit Suisse this is perfectly normal, and in a report released today, its analyst Andrew Garthwaite writes that "many clients cite data indicating that just a handful of stocks (largely tech) account for almost half of returns. However, we don"t find such analysis to be particularly informative; such dynamics are far from unusual – in fact, it is often the case that a small number of stocks account for an outsized share of market gains, as shown in the chart below."


Of course, it is also that same small number of stocks that gets hammered once the tide reverses. For now, however, with vol at all time lows, traders have yet to express any concerns that the tremendous tech rally of 2017 is in dangers of ending. Ironically, the single biggest threat to the US tech sector may be the US government itself, which is starting to realize that it is leaving just a little too many pounds of flesh on the table...


The Deflating Rally

Authored by Sven Henrich via NorthmanTrader.com,


Record prices continue to be printed on US indices as the global multiple expansion on the heels of still ongoing record central bank intervention has yet to slow down in a significant way.


All central banks were in essence dovish in recent days and weeks, whether the FOMC, the ECB, the BOE and of course the ever active BOJ as well as the SNB as it showed a new record $88B in direct holdings of US stocks.


Yet, despite the record prices on indices, the rally appears to be deflating from within.


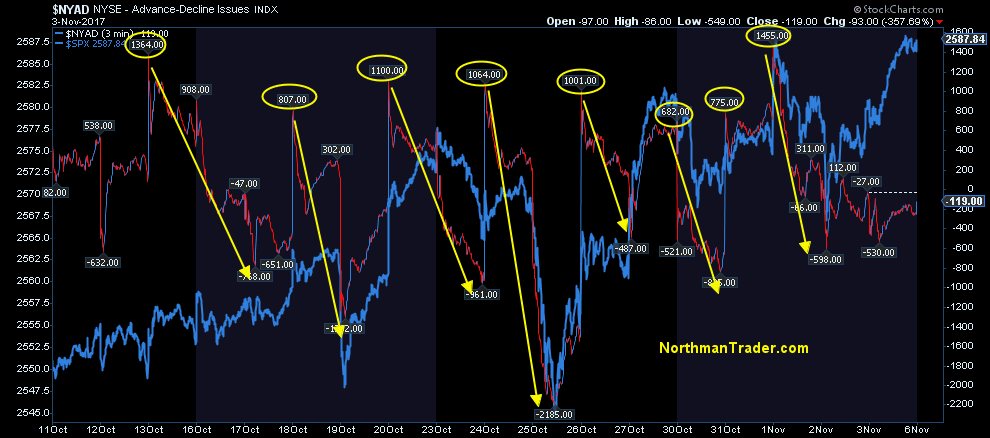
In the past several weeks I’ve pointed out a very specific pattern of positive internals on market opens and then a very distinct pattern of internals weakening throughout most days:


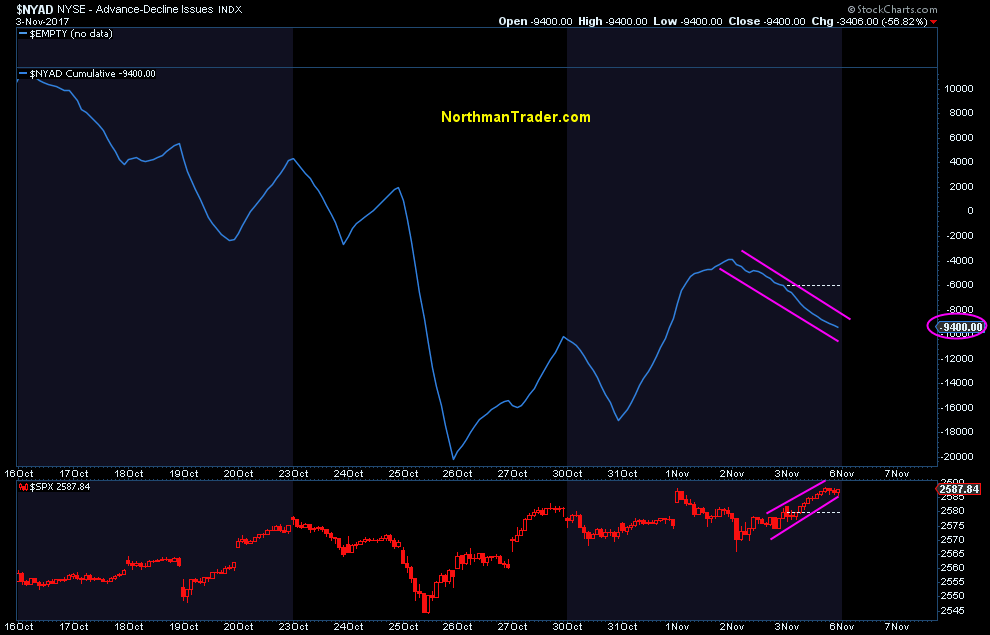
This trend has impacted the cumulative advance/decline picture and shows that recent highs have come on a negative cumulative advance/decline:


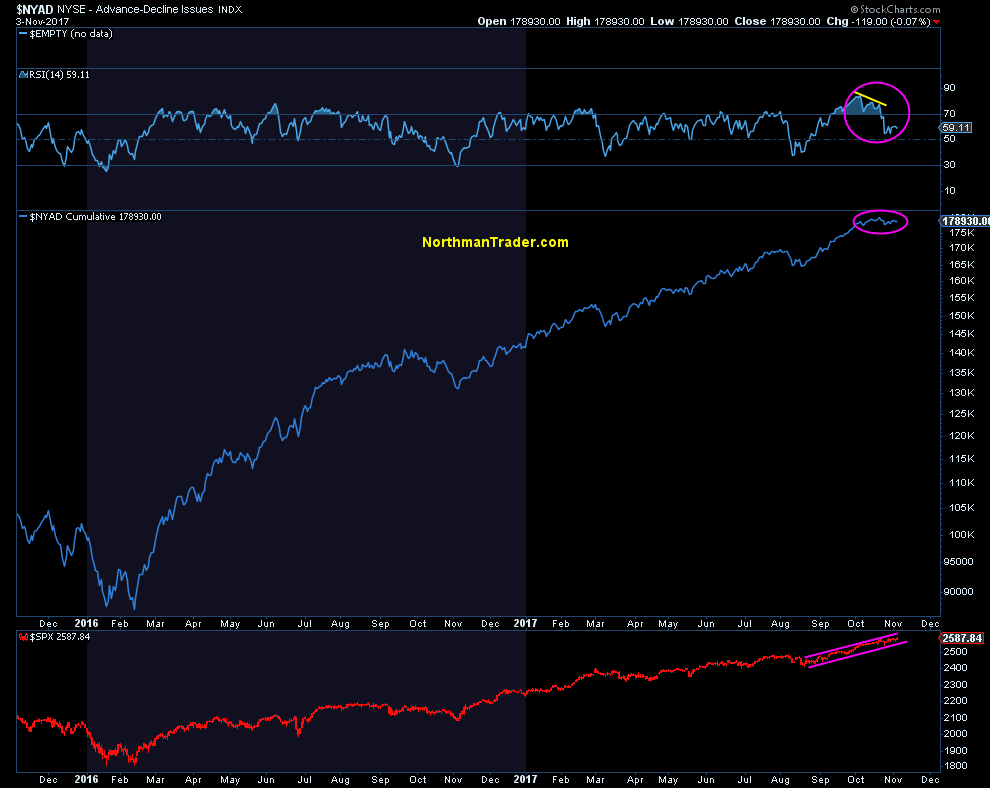
Since this rally began with massive global central bank intervention in February 2016 the cumulative advance/decline picture has often been cited as a sign of underlying core strength in markets. This picture has changed:


Recent highs came on negative divergences in relative strength despite index prices continuing to advance in a seemingly steady trend.


Yet the internal picture is practically collapsing.


Take the recent highs in the Nasdaq.


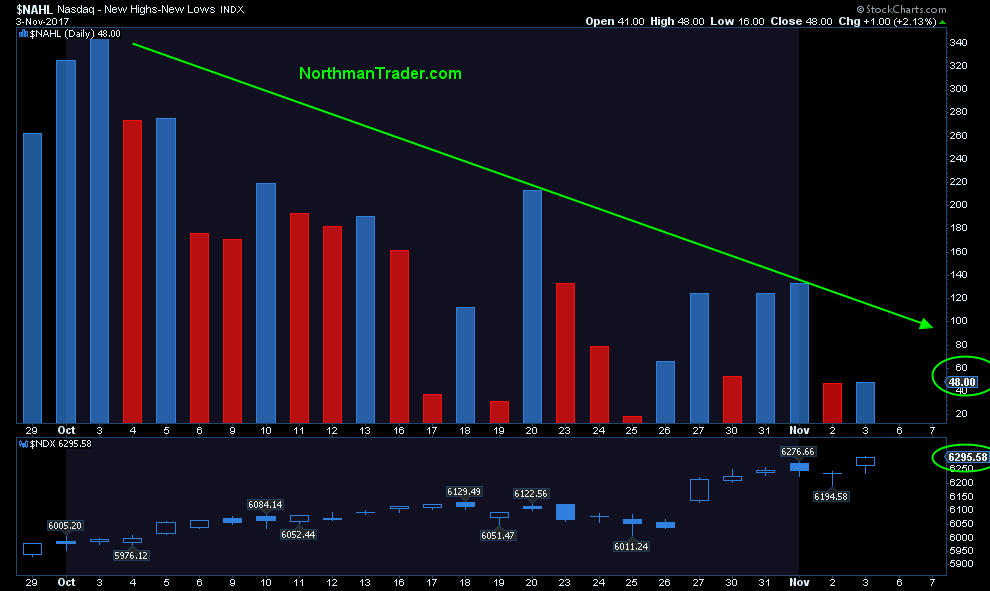
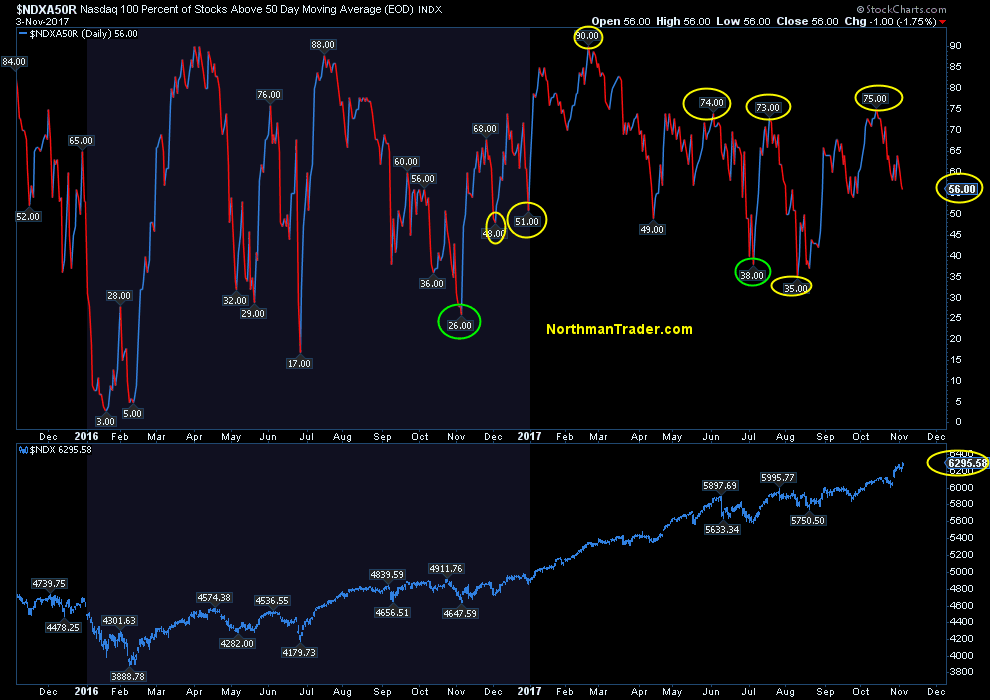
Ever since the beginning of October all new highs in the $NDX have come on fewer new highs versus new lows. Indeed Friday’s $NDX highs came on the lowest expansion yet:


On $NDX itself we can observe a complete collapse in the amount of stocks above the 50MA as $NDX printed new highs. Only 56% of components are still above the 50MA:


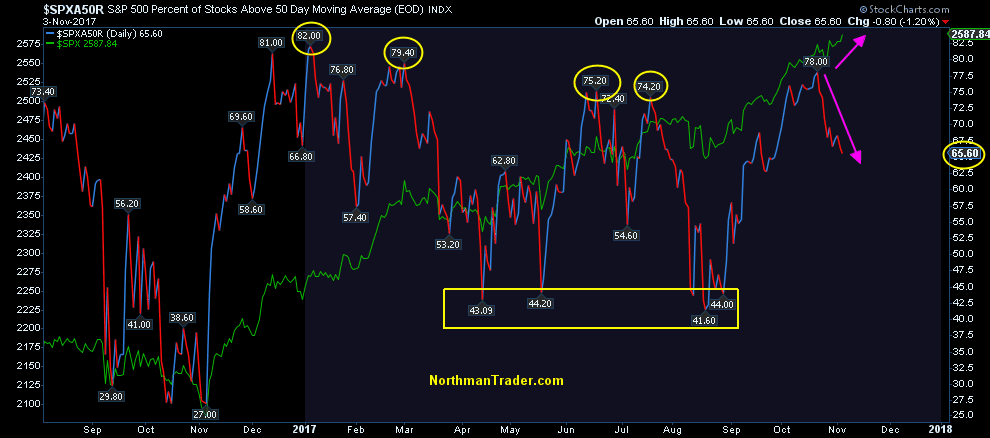
A similar picture can be observed on the $SPX:


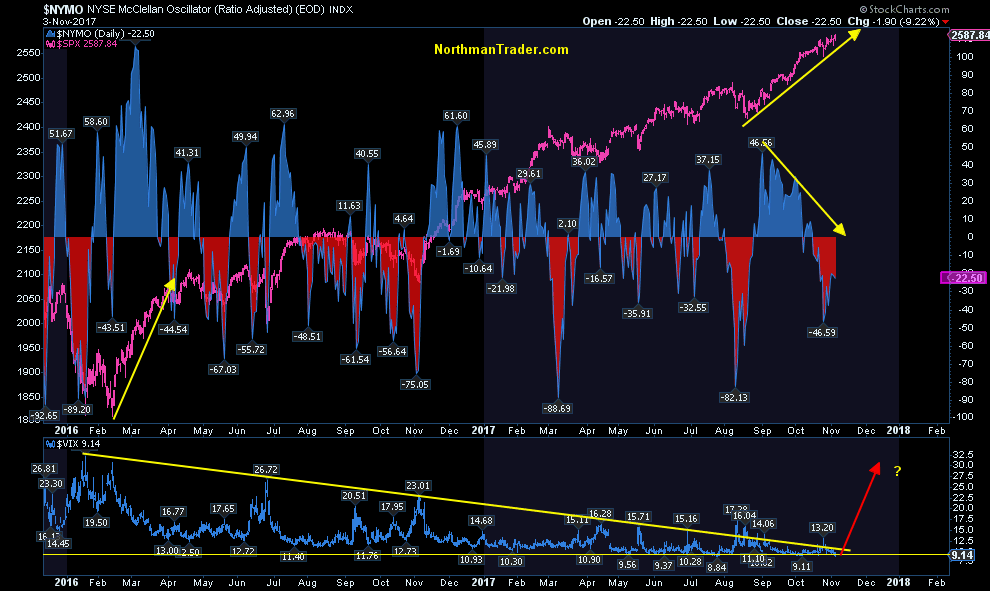
And of particular note: All recent highs have come on a negative $NYMO:


The message: Somebody is selling this market. Every day. And it’s very cleverly done as to not disturb the seeming tranquility in markets.


Note that despite all the selling volatility compression continues at a record pace as during each Friday, no matter what happens in the world, the $VIX is ensured a close below 10 by week’s end:


You’d think we’d have more volatility with such an internal breakdown in stocks. But the concentration of market cap in only a handful of stocks continues to mask the selling underneath.


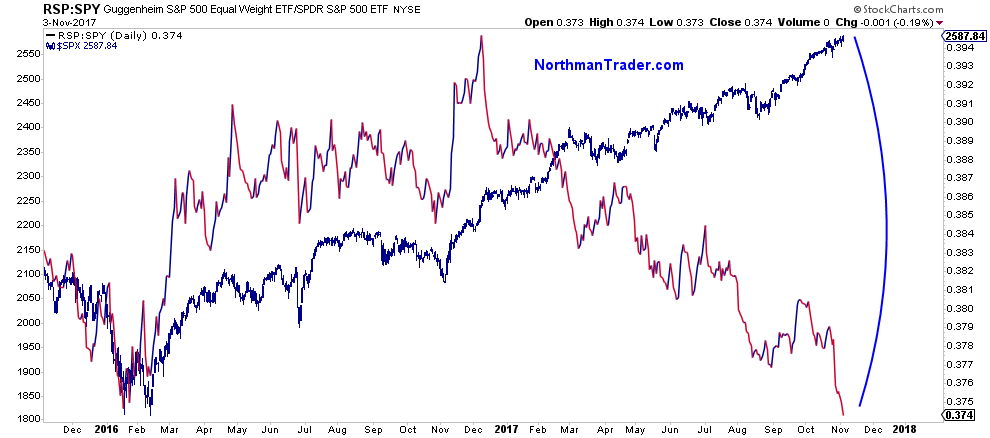
On an equal weight basis we’ve noted the divergence in markets for quite some time. This indicator has now fallen off the cliff as the correlation has completely broken down:


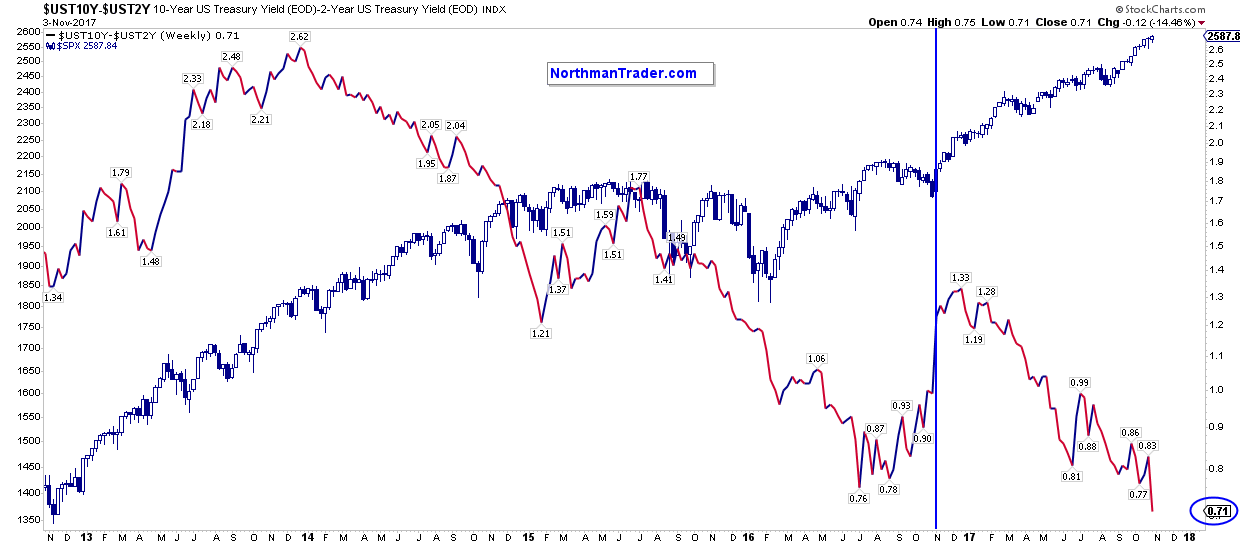
As has the yield curve which hasn’t believed in this rally in months:


2017 has seen more central bank intervention on a global basis than ever. But this party is slowly coming to an end. And while central banks will still intervene in 2018 it will be at a reduced pace. The last time we’ve seen central banks intervene at a reduced pace? 2015. And it produced sizable selling in the summer of 2015 and at the beginning of 2016 forcing record intervention since then.


All global markets have proven is that they can perform splendidly with record intervention:


2018 will then be a test case how well markets can fare with less than record intervention, a new reality. Another new reality: Soon US markets will also have their answer in regards to tax cuts. All will be priced in one way or the other.


And, from the looks of it, someone has begun selling ahead of both of these emerging realities. And once the rest of the market takes notice we suspect Friday $VIX closes below 10 may suddenly become a thing of the past.


Wednesday, October 25, 2017

VXX Short Squeezed As VIX Beta Hits -19, Highest Since September 2008

Whether it is because bond yields finally broke out of 6 month ranges, due to nerves ahead of tomorrow"s ECB tapering announcement, because the SNB is taking a long lunch break, or simply because investors finally realized that stocks have never been more expensive...


... but something odd is taking place today: selling, and nowhere is it more obvious than in the VIX ETN complex, where the VXX is suddenly caught in a vicious short squeeze.


... as the VIX is spiking, up 1.5vols to 12.63 and rising fast.


And while we recently showed that gross Vega outstanding on levered and inverse VIX derivatives including ETNs and ETFs has never been higher...


...as everyone scrambles to buy S&P calls at a rate not seen since 2007...


... here a rather striking update: as of today, the beta of VIX constant maturity futures to the S&P has been increasing during every previous selloff even as the VIX itself has crashed to record lows, and as of this moment, the beta on the vol index has never been higher. Here"s Bank of America looking at various VIX constant maturity futures for 1M, 2M and 3M contracts:


we’ve discussed how VIX constant maturity futures have become more reactive to S&P 500 selloffs than they were historically. The relationship continues to be pronounced, though it is most notable in the front part of the curve as the beta of the 1M VIX constant maturity future and the S&P is now -8.33, the most negative we’ve seen dating back to Sep-08. Furthermore, the betas of the 2M and 3M contracts are also at record levels versus the S&P 500 at -5.65 and -4.26 respectively.


And here"s the punchline: it’s also worth noting that the beta of the VIX spot index to the S&P is currently -18.99, also a record since Sep-08.


So keep a close eye on that VIX - whose response to a market selloff will be unlike anything seen in 9 years; and if the squeeze has indeed begun, all those famous vol-selling Target ex-managers, are about to lose everything.