Showing posts with label NASDAQ. Show all posts

Saturday, December 23, 2017

Silicon Valley Obscenity - 1 In 4 People Are "Food Insecure"

In the years since the first dot-com bubble burst, Silicon Valley has become emblematic of the intensifying wealth inequality that’s making life increasingly unaffordable for millions of working- and middle-class Americans.


And while the unprecedented wealth creation in the region has helped enrich hundreds of thousands of tech workers and entrepreneurs, virtually everybody else in the region – from college students to the cafeteria workers and janitors who service the headquarters of storied tech firms like Google and Facebook – has suffered from rising rents and a cost of living that’s far outstripped wage inflation.


Now, a study has found that more than one in four Silicon Valley residents is food insecure – meaning they go without at least one meal or rely on food pantries due to lack of financial resources, according to researchers at the Second Harvest food bank.


Using hundreds of community interviews and data modeling, a new study suggests that 26.8% of the population – almost 720,000 people – meet this ignominious designation. Furthermore, nearly a quarter are families with children.


“We call it the Silicon Valley paradox,” says Steve Brennan, the food bank’s marketing director. “As the economy gets better we seem to be serving more people.” Since the recession, Second Harvest has seen demand spike by 46%.


The Guardian interviewed local residents who qualify as food insecure for a story about the worsening wealth gap in one of the wealthiest regions in the US.


Karla Peralta is surrounded by food. As a line cook in Facebook’s cafeteria, she spends her days preparing free meals for the tech firm’s staff. She’s worked in kitchens for most of her 30 years in the US, building a life in Silicon Valley as a single mother raising two daughters.


But at home, food is a different story. The region’s soaring rents and high cost-of-living means that even with a full-time job, putting food on the table hasn’t been simple. Over the years she has struggled to afford groceries – at one point feeding her family of three with food stamps that amounted to $75 a week, about half what the government describes as a “thrifty” food budget. “I was thinking, when am I going to get through this?” she said.


In a region famed for its foodie culture, where the well-heeled can dine on gold-flecked steaks, $500 tasting menus and $29 loaves of bread, hunger is alarmingly widespread, according to a new study shared exclusively with the Guardian.


According to the Guardian, the food bank is literally at the center of the Silicon Valley boom – both literally and figuratively. It sits just half a mile from Cisco’s headquarters and counts Facebook’s Sheryl Sandberg among its major donors. But the need it serves is exacerbated by this industry’s wealth; as high-paying tech firms move in, the cost of living rises for everyone else.


As we’ve pointed out, faced with some of the most expensive rental housing in the nation, some Bay Area residents are feeling priced out and are seeking low-cost alternatives like living in their cars, or commuting nearly two hours to work each way.


All of this is happening as the Nasdaq – which includes many of the tech behemoths like Facebook, Google and Apple that are based in the region – reached an all-time high above 7,000 on Monday.


Food insecurity often accompanies other poverty indicators, such as homelessness. San Jose, Silicon Valley’s largest city, had a homeless population of more than 4,000 people during a recent count.


For workers like Karla Peralta – the Facebook cafeteria worker who shared the story of her daily struggles with the Guardian – there’s a stark division between well-heeled salaried tech workers at Facebook, and others like herself who work under contract.


What’s worse, many workers like Peralta are finding themselves mired in an uncomfortable gray area: they make too much to qualify for government assistance, but not enough to get by.


These days Peralta earns too much to qualify for food stamps, but not enough not to worry. She pays $2,000 a month – or three-quarters of her paycheck – to rent the small apartment she shares with her youngest daughter. “Even just the two of us, it’s still a struggle.” So once a month, she picks up supplies at the food bank to supplement what she buys at the store.


She isn’t one to complain, but acknowledges the vast gulf between the needs of Facebook employees and contract workers such as herself. “The first thing they do [for Facebook employees] is buy you an iPhone and an Apple computer, and all these other benefits,” she laughs. “It’s like, wow."


Second Harvest is the only food bank serving Silicon Valley. It’s also one of the largest in the country. In any given month, it provides meals for 257,000 people. It served 66 million pounds of food last year. When the Guardian visited its cavernous, 75,000 square foot main warehouse space, boxes of produce stretched to the ceiling. Strip lights illuminated crates of cucumbers and pallets of sweet potatoes with a chilly glow. Volunteers in PayPal T-shirts packed cabbages and apples that arrived in boxes as big as paddling pools, while in the walk-in freezer turkeys waited to defrost.


To Silicon Valley’s wealthy tech workers, the struggles of the hundreds of thousands of working poor in the region are often invisible.


“Often we think of somebody visibly hungry, the traditional homeless person,” Brennan said. “But this study is putting light on the non-traditional homeless: people living in their car or a garage, working people who have to choose between rent and food, people without access to a kitchen."


He added, “you’re not thinking when you pick up your shirts from dry cleaning, or getting your landscaping done, or going to a restaurant, or getting your child cared for, ‘is that person hungry?’ It’s very easy to assume they are fine."


The cost of housing is one of the biggest contributor to inequality – and the main reason many workers in the region are forced to go hungry. In Santa Clara County, the median price of a family home has reached a new high of $1.125 million, while the supply of homes continues to shrink. A family of four earning less than $85,000 is now considered low income. Meanwhile, the median income in the US is less than $60,000.


These realities mean food insecurity cuts across lines of race, age and employment status.


Minority communities in the Bay Area have been hit the hardest.


The Latino community is “passing through a hard time”, says Vicky Avila-Medrano, a food connection specialist. She runs a program that sends current and former food bank users out into the community, which has been disproportionately affected by the cost-of-living crisis.


“Here in Silicon Valley, we have a big problem. This is a beautiful place to live for people in the tech industry, but we are not working in that industry."


Of course, the problems posed by rising rents aren’t unique to the San Francisco Bay Area. As we noted back in October, rental costs growing faster than disposable income for 22 consecutive months. In September, rent ate up more disposable income than at any prior time in history.


All of this underscores the hypocrisy of the ultra-liberal Bay Area. While well-heeled tech workers spurn anybody who disagrees with their narrow-minded worldview in the name of progress, many of these same workers drift through their daily routines largely ignorant of the dire circumstances of the people who handle their dry cleaning and prepare their food.


Google famously fired former engineer James Damore for publishing an open letter pointing out flaws in the company’s diversity hiring program.


Meanwhile, the more than 10,000 employees who work at the Googleplex in Mountain View, Calif. are some of the biggest contributors to wealth inequality in the region.


While we"re sure the Bay Area"s insistence on social equality in the workplace is well intentioned, progress won"t feed the working poor.


Thursday, December 21, 2017

Long Island Iced Tea Soars 500% After Changing Its Name To Long Blockchain

Now that it is abundantly clear that for a stock to explode higher, all that is necessary - and sufficient - is a press release mentioning the company"s name and throwing in the word "blockchain" in the same sentence (see Riot Blockchain, LongFin Corp, Net Element, and Nova Lifestyle), other public microcaps have decided that if that"s all it takes, then by all means they will gladly take investors" money.


Before...


After...


And so here is today"s farce - Meet "Long Island Iced Tea Corp"... to be known in the future as "Long Blockchain Corp."


Long Island Iced Tea Corp. today announced that the parent company is shifting its primary corporate focus towards the exploration of and investment in opportunities that leverage the benefits of blockchain technology. In connection with the shift in strategic direction, the Company has approved changing its name from “Long Island Iced Tea Corp.” to “Long Blockchain Corp.” and has reserved the web domain www.longblockchain.com. The Company intends to request Nasdaq to change its trading symbol in connection with the name change. The Company will continue to operate Long Island Brand Beverages, LLC as a wholly-owned subsidiary and maintain the focus of this business on the ready-to-drink segment of the beverage industry, specifically, premium, ‘better-for-you’ brands marketed at an affordable price.


In conjunction with the shift in business strategy, the Company has submitted a request to the Securities and Exchange Commission to withdraw its previously filed S-1 registration statement relating to a proposed underwritten public offering, which was filed on November 11, 2017.


Focus in Blockchain


Blockchain acts as a public, decentralized ledger. This ledger provides a single, unified source of data, creating a clearer audit trail and consistency across parties.  The Company believes that emerging blockchain technologies are creating a fundamental paradigm shift across the global marketplace, with far reaching applications across all industries from financial services (smart settlements) to consumer packaged goods (supply chain verification) to healthcare (electronic medical records).


The Company is already in the preliminary stages of evaluating specific opportunities involving blockchain technology. The discussions are only in the preliminary stages but indicate the areas of focus for the Company. These opportunities include potential partnerships, investments or acquisitions involving:


  • A blockchain software developer building blockchain infrastructure for the financial services industry

  • A London-based FCA regulated, institutional provider of FX services that is building multiple blockchain and digital crypto currency technology solutions for global financial markets

  • A new smart contract platform for building decentralized applications that provides scalability beyond currently available options


However, the Company does not have an agreement with any of these entities for a transaction and there is no assurance that a definitive agreement with these, or any other entity, will be entered into or ultimately consummated.


Philip Thomas, Chief Executive Officer of the Company, commented,


We view advances in blockchain technology as a once-in-a-generation opportunity, and have made the decision to pivot our business strategy in order to pursue opportunities in this evolving industry. We are committed to enhancing shareholder value and believe that our new focus is the best path towards this goal. We will, in the coming weeks and months, be taking a series of steps related to our efforts to assemble a world-class team of industry professionals to help us realize this vision. We are pursuing our new direction in a thoughtful and deliberate manner.”


And the result... the stock is up 500%...


Seriously!!


And we wonder who was buying in massive bulk a few weeks ago...


Paging The SEC...


Monday, December 18, 2017

Up Over 2000% In 2 Days - Meet The Big-Data, AI, Blockchain, FinTech Mania Stock Of The Year

Update: Well that escalated quickly...


The stock is now up over 500% today and has been halted numerous times...


*  *  *


Having closed last Thursday on its IPO-day at $5.38, news of the acquisition of Ziddu - a blockchain solutions provider (whatever that means in the real world) - LongFin has since exploded to $44.80 in today"s pre-market... up 730% in 2 days.


Remember LongFin? an independent finance and technology company. The Company offers commodity trading, alternate risk transfer, and carry trade financing services. LongFin also provides hedging and risk management solutions to importers, exporters, and small medium business enterprises. LongFin serves customers worldwide.


As iBankCoin notes, it has all of the trimmings of wanton degeneracy on an industrial scale.


  • Recent IPO: check

  • Small float: check

  • Shady as heck: check

  • AI company: check

and the cherry on the top...


  • a day after coming public, they announce the purchase of a blockchain company: check

*  *  *


On Thursday Dec 14th, LongFin launched as a FinTech company that helped with FX hedging (and slipped from its post-IPO open price to close lower)


US-based Longfin Corp., a Fintech company providing Finance and foreign exchange hedging solutions to importers and exporters and SMEs, started trading on Nasdaq from today.
According to a statement issued by Longfin, its Low Latency Network is connected to multiple exchanges and banks across the regions to provide the cheapest Forex hedging and low-cost financing to small and medium-size importers and exporters across the globe.
Longfin Founder Venkata S. Meenavalli said, "We are the first Asian Entrepreneur promoted Reg A+ company under JOBS Act, to list its shares directly in Nasdaq and the second Indian entrepreneur promoted company to list directly in the Nasdaq since 2010"


On Friday Dec 15th, they acquired Ziddue and became the future face of Cyrptocurrency awesomeness...


Longfin Corp. (NASDAQ: LFIN), a leading global FinTech company, announces the acquisition of Ziddu.com, a Blockchain-empowered solutions provider that offers Microfinance Lending against Collateralized Warehouse Receipts in the form of Ziddu Coins.


And with all those buzzwords, why wouldn"t it be up 730%!!!!


As a reminder, there are no financials on this company, no reg details on shares outstanding, and no direct evidence of a business model that makes any money?


Nasdaq Tops 7,000 For First Time Ever As VIX Crashes

Having passed 6,000 for the first time in April, Nasdaq has now soared 17% since then to surpass 7,000 today...


As soon as cash markets closed last Friday (quad witch), US equity futures spiked... then spiked again on Sunday night"s open, and again at the US equity cash open this morning...


And VIX has been crushed this morning...


Sunday, December 10, 2017

What You"re Not Being Told About The Real Economy

Authored by Jeffrey Snider via Alhambra Investment Partners,


The year 2000 was a transition year in a lot of ways. Though Y2K amounted to mild mass hysteria, people did have to get used to writing the date with 20 in front of the year rather than 19. It was a new millennium (depending on your view of Year 0) that seemed to have started off under the best possible terms.


Not only were stocks on fire at the outset, the economy was, too. The idea of this “new economy” leading toward a permanent new plateau of low inflation growth, driven by the breathtaking productivity gains in telecommunications and computing, seemed quite real on the surface. US GDP advanced by more than 3% in 15 straight quarters from Q2 1996 through Q4 1999, averaging a sizzling 4.7% in those nearly four years of dot-com supremacy.


The labor market was clearly robust, too. In March 2000, the BLS estimates (current benchmarks) that total payrolls (Establishment Survey) rose by 468k from that February. That brought the 6-month average up to +303k, a record of expansion that also mystified economists for its lack of inflationary wage pressures. In any case, the late nineties had roared up to the doorstep of the 21st century.


We all know what happened in April 2000, as investors suddenly got cold feet about first the high flying NASDAQ. It wasn’t just stock prices and IPOs, of course, as it really meant one of the major economic themes of that age was in danger being undermined, if not thoroughly debunked. The new economy of the 21st century might not have been grounded so solidly in true economics (small “e”) as everyone thought (especially those running the Fed).


The labor market of 2000 was a study in contrasts, starting out as good as it did, but by that June, there was a shocking minus for the monthly headline payroll number. It wasn’t just a one-time problem, either, as despite all assurances in all the usual places payrolls would contract again in August and also in October. To end the year 2000, the 6-month average for the Establishment Survey had fallen to just +109k.


It was, again, a year of transition, beginning as the “sky is the limit” dot-com era and ending in almost a tailspin just two months shy of official recession. In many ways, the economy has never recovered from it, the labor market (the eurodollar’s giant sucking sound) most prominently.


Because of this and really the length of time involved between then and now, we have forgotten what a good economy actually looks like. There have been, of course, brief moments when we get the sense that something just isn’t right, such as the “jobless recovery” of 2002 and 2003, as well as the whole aftermath of the Great “Recession” up until 2014. By and large, however, the economy and the labor market are described in terms that just don’t apply if almost by default (it’s less bad today, so mustn’t it be good?).


The current payroll report for November 2017 suggests a gain of 228k. It is characterized as everything from “solid” to “robust.” Is it? How would we really know?


The best way to confirm that suspicion is to compare the current labor statistics to those in the past, calibrating the most recent numbers by those before that were recorded during what were inarguably the best of times; such as the late nineties.


Using monthly payroll gains, though, can be misleading simply because of geometric progression. A gain of 228k in November is not equivalent to the 228k gain in November 2000. The latter is actually a better single month result starting as it did from a smaller base.


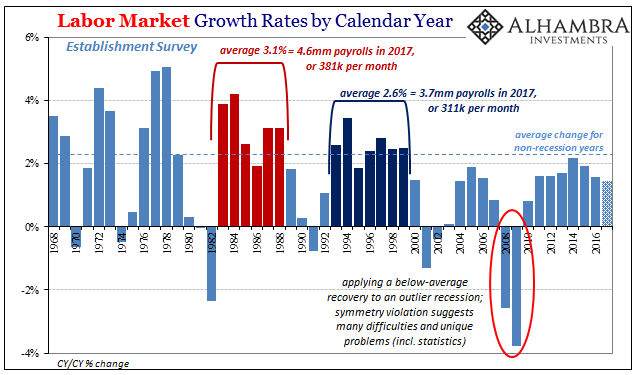
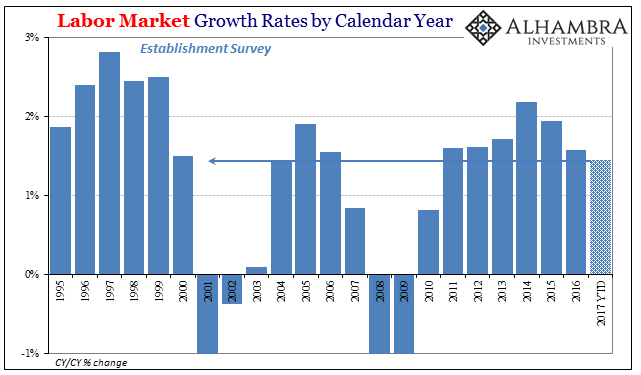
From 1993 through 1999, the labor market gained, on average, 2.6% per year according to the Establishment Survey. Since that time period is universally accepted as one featuring a strong economy, that is our standard for measurement. We can also go back to the eighties for what might amount to as an upper limit of sorts, the economy and labor market at that time being whatever is better than strong and robust – truly awesome.


Translating those average gains into the 2016 base equals an expectation of 3.7mm payrolls gained for 2017 to be as good as the nineties, and 4.6mm, which would signal a splendid economic year consistent with the eighties. Through 11 months so far up to November, the Establishment Survey gives us just 1.9mm for 2017. Assuming December turns out equal or better than November’s “good” number, the year should end with a total payroll expansion around 2.1mm, maybe 2.2mm.


That’s less than two-thirds of the way to the nineties, and significantly less than half of the eighties. This year, no matter how many months at 200k plus, has not been a good one. In fact, payroll gains in the eleven months so far tallied by the BLS’s Establishment Survey are less than those presented in that transitional year of 2000.


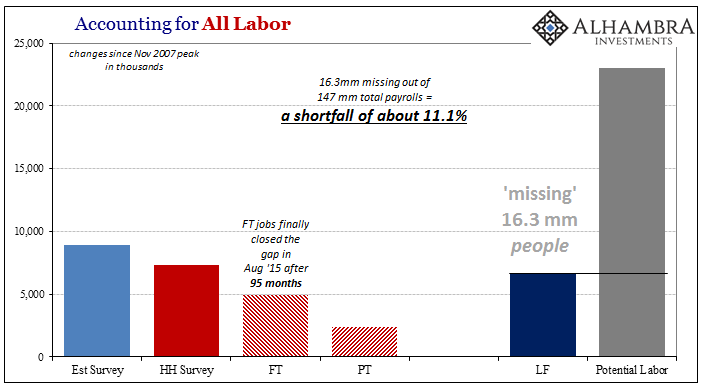
This is how you get the newest generation of American adults yearning in greater numbers for something vastly different, a radical political change if for no other reason than the establishment here continuing to say that everything is good when by every reasonable standard it isn’t even close! The “robust” labor market even of the past few years isn’t nearly enough to draw in those still sitting on the sidelines struggling, however, they do (parents’ basements) to just get along, leaving the economy instead it’s “missing” 16.3 million; a number that in a truly robust economy would be falling not rising.


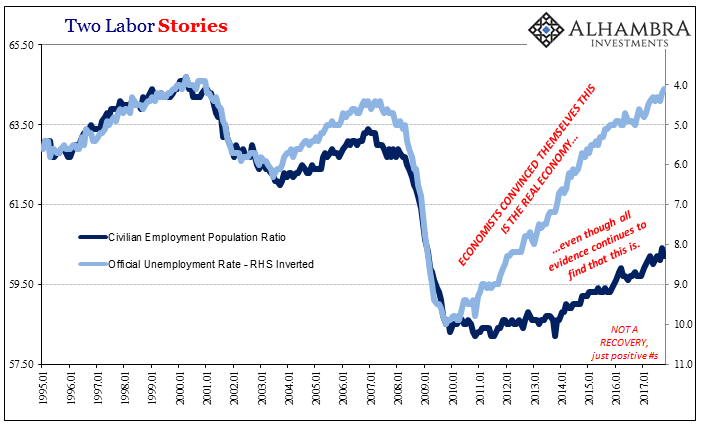
The issue clearly cannot be labor supply (Baby Boomer retirements, heroin, and fentanyl abuse in the Rust Belt) but shrunken labor demand; permanently shrunken economic demand. Therefore, there really should be no expectation for accuracy in the unemployment rate and what that means all around (inflation, baseline growth, monetary policy).


Once again in yet another month where the unemployment rate registers a ridiculous low, wages, and payroll earnings remain stuck at visibly low levels. The average weekly earnings of production and non-supervisory employees rose by just 2.6% year over year in November, after gaining 2.2% in October, 2.6% in September, and 2.7% in August. That’s nothing like in the past when the unemployment rate was where it is now. There is nothing like acceleration in earnings, not even solid growth.


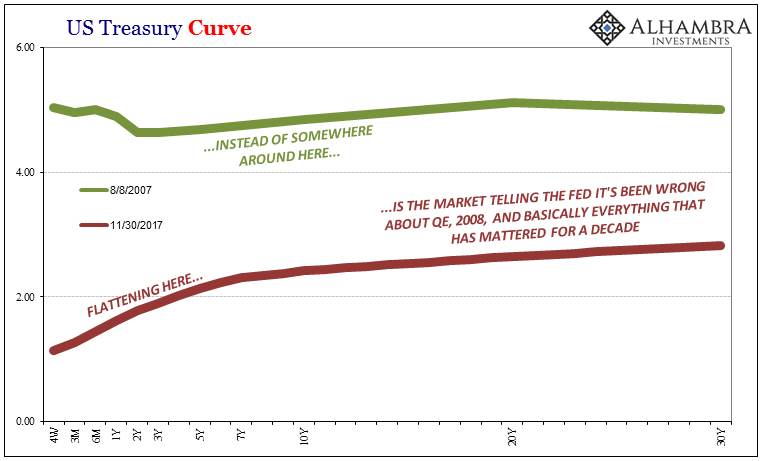
I don’t mean to make all this about the bond market every time (actually it’s appropriate), but the idea that treasuries at the long end have to be wrong has no basis other than misconception or intentional misdirection.


The data, including the BLS data, remains firmly on the side of flattening, and like the Establishment Survey’s paltry 1.9mm in 2017, it’s not even close.


Saturday, December 2, 2017

The Dow Peaked At 14,000 Before The Last Stock Market Crash, And Now Dow 24,000 Is Here

This report was originally published by Michael Snyder at The Economic Collapse


stock-market


The absurdity that we are witnessing in the financial markets is absolutely breathtaking. Just recently, a good friend reminded me that the Dow peaked at just above 14,000 before the last stock market crash, and stock prices were definitely over-inflated at that time. Subsequently the Dow crashed below 7,000 before rebounding, and now thanks to this week’s rally we on the threshold of Dow 24,000. When you look at a chart of the Dow Jones Industrial Average, you would be tempted to think that we must be in the greatest economic boom in American history, but the truth is that our economy has only grown by an average of just 1.33 percent over the last 10 years. Every crazy stock market bubble throughout our history has always ended badly, and this one will be no exception.


And even though the Dow showed a nice gain on Wednesday, the Nasdaq got absolutely hammered. In fact, almost every major tech stock was down big. The following comes from CNN


Meanwhile, big tech stocks — which have propelled the market higher all year — were tanking. The Nasdaq fell more than 1%, led by big drops in Google (GOOGLTech30) owner Alphabet, Amazon (AMZNTech30), Apple (AAPLTech30), Facebook (FBTech30) and Netflix (NFLXTech30).


Momentum darlings Nvidia (NVDATech30) and PayPal (PYPLTech30) and red hot gaming stocks Electronic Arts (EATech30) and Activision Blizzard (ATVITech30) plunged too. They have been some of the market’s top stocks throughout most of 2017.


Many believe that the markets are about to turn down in a major way. What goes up must eventually come down, and at this point even Goldman Sachs is warning that a bear market is coming


“It has seldom been the case that equities, bonds and credit have been similarly expensive at the same time, only in the Roaring ’20s and the Golden ’50s,” Goldman Sachs International strategists including Christian Mueller-Glissman wrote in a note this week. “All good things must come to an end” and “there will be a bear market, eventually” they said.


As central banks cut back their quantitative easing, pushing up the premiums investors demand to hold longer-dated bonds, returns are “likely to be lower across assets” over the medium term, the analysts said. A second, less likely, scenario would involve “fast pain.” Stock and bond valuations would both get hit, with the mix depending on whether the trigger involved a negative growth shock, or a growth shock alongside an inflation pick-up.


Nobody believes that this crazy stock market party can go on forever.


These days, the real debate seems to be between those that are convinced that the markets will crash violently and those that believe that a “soft landing” can be achieved.


I would definitely be in favor of a “soft landing”, but those that have followed my work for an extended period of time know that I do not think that this will happen. And with each passing day, more prominent voices in the financial world are coming to the same conclusion. Here is one recent example


Vanguard’s chief economist Joe Davis said investors need to be prepared for a significant downturn in the stock market, which is now at a 70 percent chance of crashing. That chance is significantly higher than it has been over the past 60 years.


The economist added, It’s unreasonable to expect rates of returns, which exceeded our own bullish forecast from 2010, to continue.”


A stock market crash has followed every major stock bubble in our history, and right at this moment we are in the terminal phase of one of the greatest stock market bubbles ever. There are so many indicators that are screaming that we are in danger, and one of the favorite ones that I like to point to is margin debt. The following commentary and chart were recently published by Wolf Richter


This chart shows margin debt (red line, left scale) and the S&P 500 (blue line, right scale), both adjusted for inflation to tune out the effects of the dwindling value of the dollar over the decades (chart by Advisor Perspectives):


Stock market leverage is the big accelerator on the way up. Leverage supplies liquidity that has been freshly created by the lender. This isn’t money moving from one asset to another. This is money that is being created to be plowed into stocks. And when stocks sink, leverage becomes the big accelerator on the way down.


Markets tend to go down much faster than they go up, and I have a feeling that when this market crashes it is going to happen very, very rapidly.


The only reason stock prices ever got this high in the first place was due to unprecedented intervention by global central banks. They created trillions of dollars out of thin air and plowed those funds directly into the financial markets, and of course that was going to inflate asset prices.


But now global central banks are putting on the brakes simultaneously, and this has got to be one of the greatest sell signals that we have ever witnessed in modern financial history.


Even Federal Reserve Chair Janet Yellen says that she is concerned about causing “a boom-bust condition in the economy”, and yet she insists that the Fed is going to continue to gradually raise rates anyway


Federal Reserve Chair Janet Yellen said the central bank is concerned with growth get out of hand and thus is committed to continuing to raise rates in a gradual manner.


“We don’t want to cause a boom-bust condition in the economy,” Yellen told Congress in her semiannual testimony Wednesday.


While Yellen did not specifically commit to a December rate hike, her comments indicated that her views have not changed with her desire for the central bank to continue normalizing policy after years of historically high accommodation.


I never thought that this stock market bubble would get this large. We are way, way overdue for a financial correction, but right now we are in a party that never seems to end.


But end it will, and when that happens the pain that will be experienced on Wall Street will be unlike anything that we have ever seen before.


Michael Snyder is a Republican candidate for Congress in Idaho’s First Congressional District, and you can learn how you can get involved in the campaign on his official website. His new book entitled “Living A Life That Really Matters” is available in paperback and for the Kindle on Amazon.com.


GetPreparedNow-MichaelSnyderBarbaraFixMichael T. Snyder is a graduate of the University of Florida law school and he worked as an attorney in the heart of Washington D.C. for a number of years.Today, Michael is best known for his work as the publisher of The Economic Collapse Blog and The American Dream


If you want to know what is coming and what you can do to prepare, read his latest book Get Prepared Now!: Why A Great Crisis Is Coming.


Monday, November 27, 2017

Nasdaq Slammed As Japanese Media Signals North Korea "Preparing Toward Ballistic Missile Launch"

Update: While the initial reaction to the headlinews were muted, once the story hit Bloomberg wires, USDJPY snapped lower and gold jumped...


And as USDJPY fades, so stocks drop (S&P and Nasdaq now red)...


*  *  *


Earlier today, Russia"s deputy foreign minister Igor Morgulov warned that while there is a latent danger of an "apocalyptic scenario of developments" on the Korean Peninsula, he brought attention to the apparent "denuclearization" of the Kim regime, pointing out that North Korea’s last provocation was on Sept. 15, when it fired its second missile over Japan in as many months. The 73-day pause is the longest since a 116-day break between October 2016 and February.


That may soon be changing because according to a tweet from Michiyo Ishida, the Tokyo Bureau Chief for Channel News Asia, the Japanese government has deteced a "signal from #NorthKorea on preparation towards a ballistic missile launch according to local media"


The news has yet to be caught by the major newswires, and as a result there has been no response in either the KRW or JPY crosses, however keep an eye on this story should there be confirmation over the course of the trading day. There is also the possibility that this is merely a trial balloon by Japan"s press meant to incite a nationalist mood and push through Abe"s militant agenda.


Monday, November 6, 2017

Divergences sending bearish message to stocks?


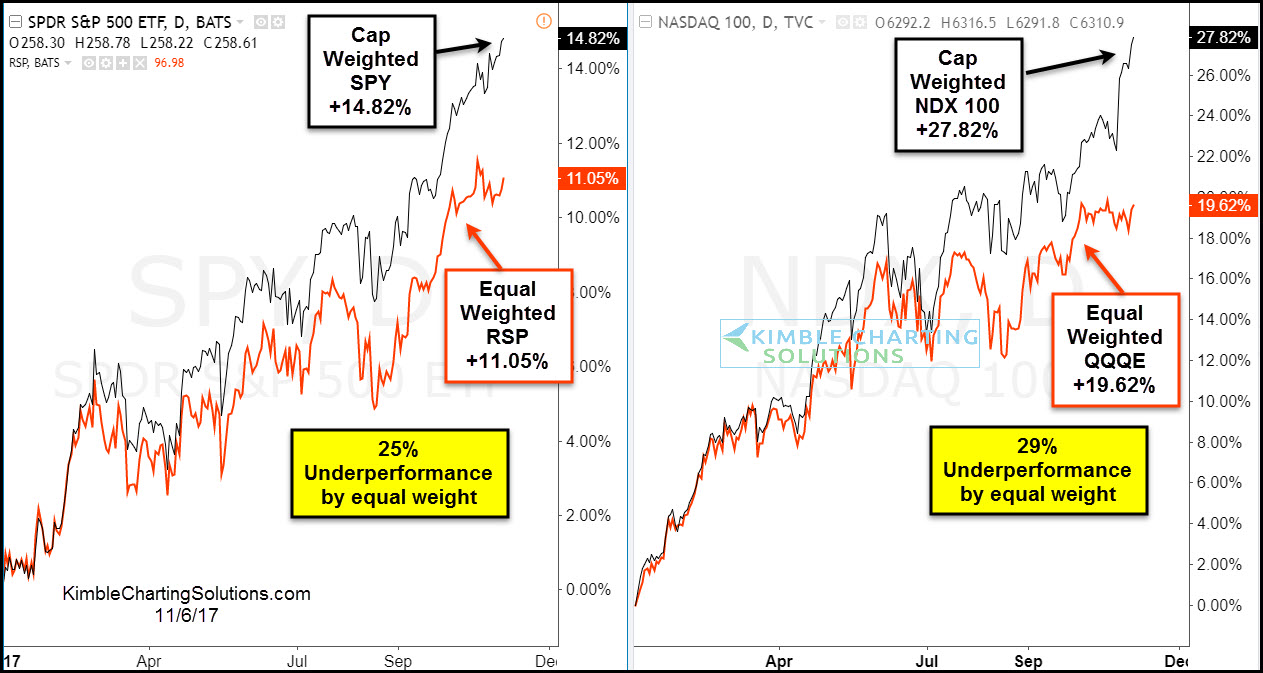
The 2-pack below compares the Cap weighted and Equal weighted performance year to date of the S&P 500 and Nasdaq 100-


CLICK ON CHART TO ENLARGE


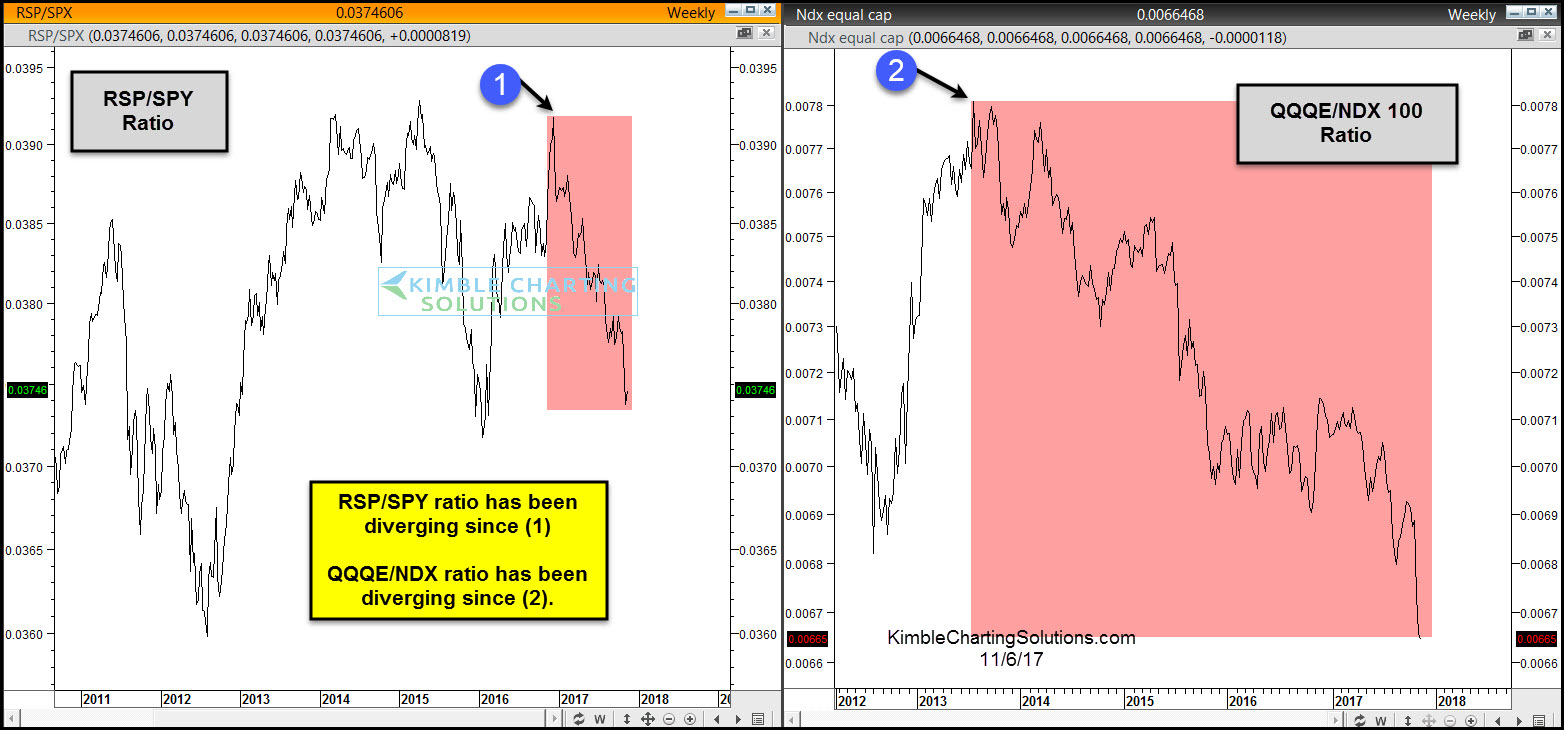
The chart above reflects that the equal-weighted S&P 500 ETF (RSP) and the equal weighted NDX 100 ETF (QQQE) have both underperformed the Cap weighted indices by over 25% this year. Both of the equal-weighted ETF’s over the month have trades sideways, while the Cap weighted are moving higher.


The lagging performance by the equal-weighted ETF’s reflects that fewer stocks are participating in the rally.


Below looks at Cap/Equal weighted ratios for the S&P 500 and NDX 100-


Divergences are taking place by both ratios as the S&P has been diverging since earlier this year and the NDX has been diverging the past few years.


The divergences by themselves do not mean the market has to head south right or a bear market is ready to start. Historically when fewer and fewer stocks are powering a bull market rally, it does reflect a thinning of the market and could result in unimpressive gains going forward.


Stock bulls want to see these ratios heading higher, not continuing to diverge.


Why you see chart pattern analysis with brief commentary:   There is a ton of news and opinions about markets and stocks that make the decision-making process more difficult than it needs to be.   


I believe the Power of the chart Pattern provides all you need to see what is taking place in an asset and determine the action to take. 


This approach has worked well for me and our clients and I encourage you to test it for yourself.


Receive my free research posted on the blog daily here 


Or,  send an email if you would like to see sample research and take me up on a trial of my premium or weekly research where I provide actionable alerts on breakouts and reversals in broad market indices, sectors, commodities, the miners and select individual stocks 


Email services@kimblechartingsolutions.com  


Call us Toll free 877-721-7217 international 714-941-9381 


Website: KIMBLECHARTINGSOLUTIONS.COM 


The Deflating Rally

Authored by Sven Henrich via NorthmanTrader.com,


Record prices continue to be printed on US indices as the global multiple expansion on the heels of still ongoing record central bank intervention has yet to slow down in a significant way.


All central banks were in essence dovish in recent days and weeks, whether the FOMC, the ECB, the BOE and of course the ever active BOJ as well as the SNB as it showed a new record $88B in direct holdings of US stocks.


Yet, despite the record prices on indices, the rally appears to be deflating from within.


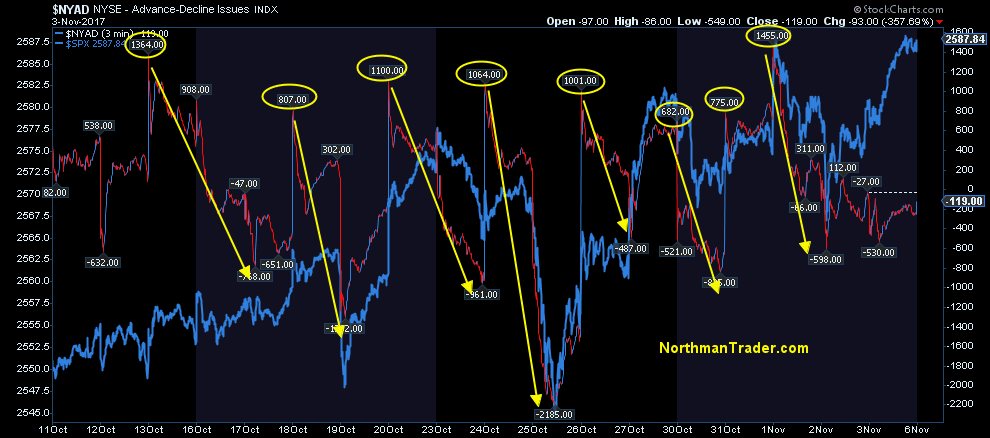
In the past several weeks I’ve pointed out a very specific pattern of positive internals on market opens and then a very distinct pattern of internals weakening throughout most days:


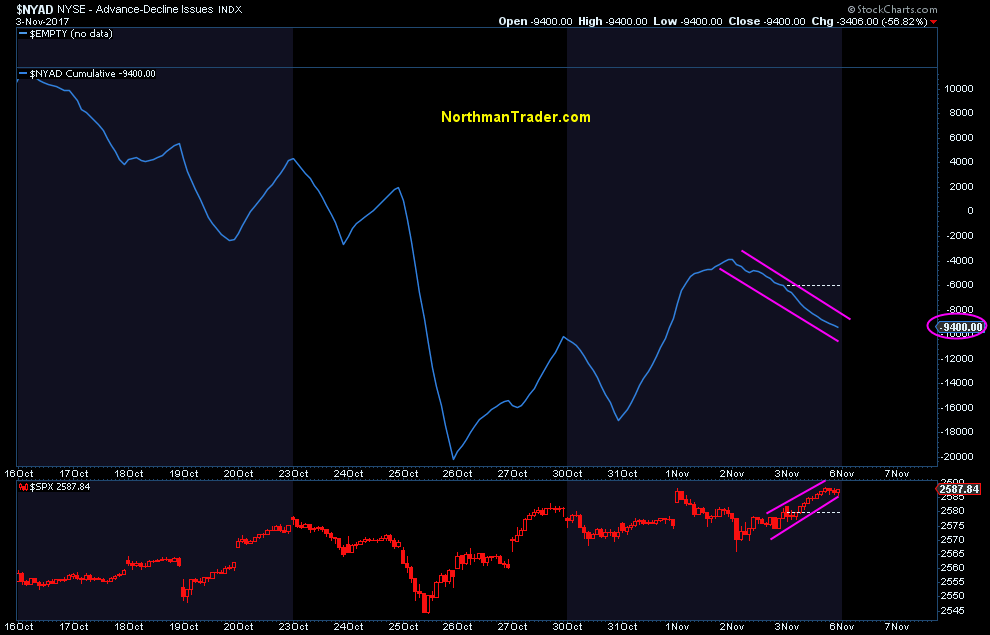
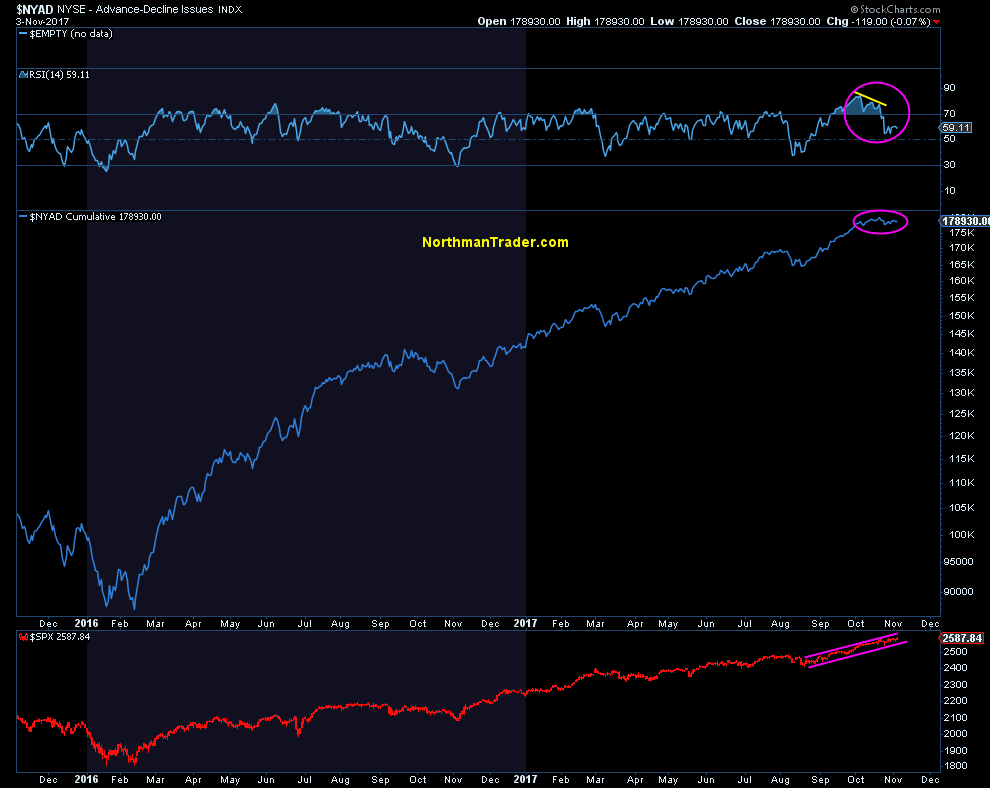
This trend has impacted the cumulative advance/decline picture and shows that recent highs have come on a negative cumulative advance/decline:


Since this rally began with massive global central bank intervention in February 2016 the cumulative advance/decline picture has often been cited as a sign of underlying core strength in markets. This picture has changed:


Recent highs came on negative divergences in relative strength despite index prices continuing to advance in a seemingly steady trend.


Yet the internal picture is practically collapsing.


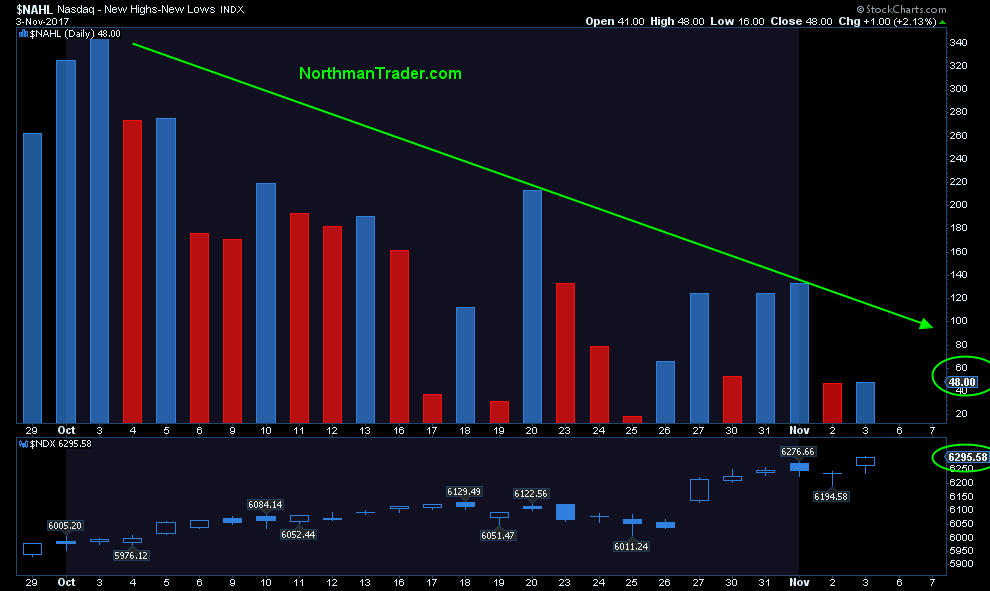
Take the recent highs in the Nasdaq.


Ever since the beginning of October all new highs in the $NDX have come on fewer new highs versus new lows. Indeed Friday’s $NDX highs came on the lowest expansion yet:


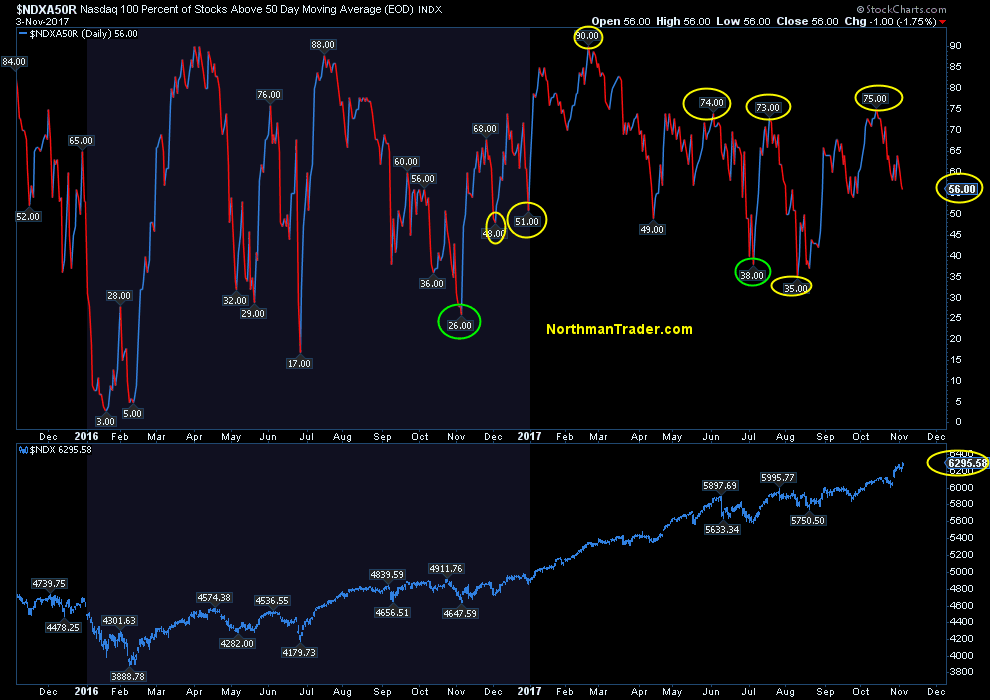
On $NDX itself we can observe a complete collapse in the amount of stocks above the 50MA as $NDX printed new highs. Only 56% of components are still above the 50MA:


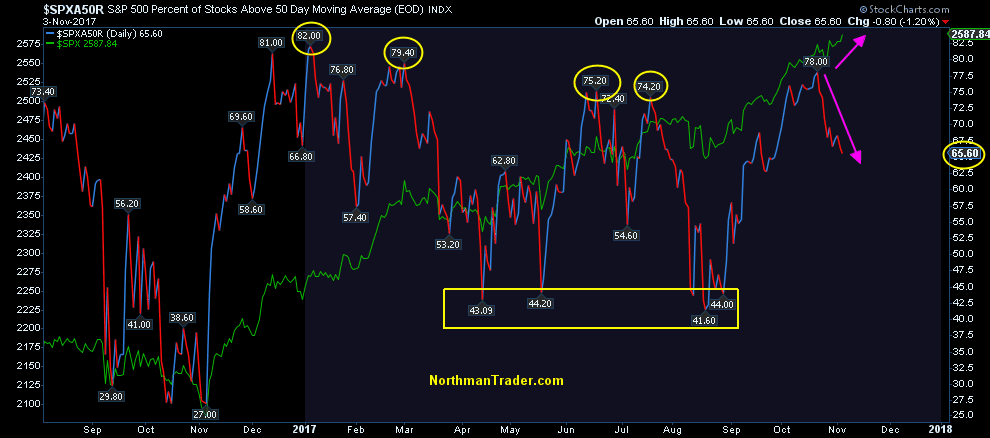
A similar picture can be observed on the $SPX:


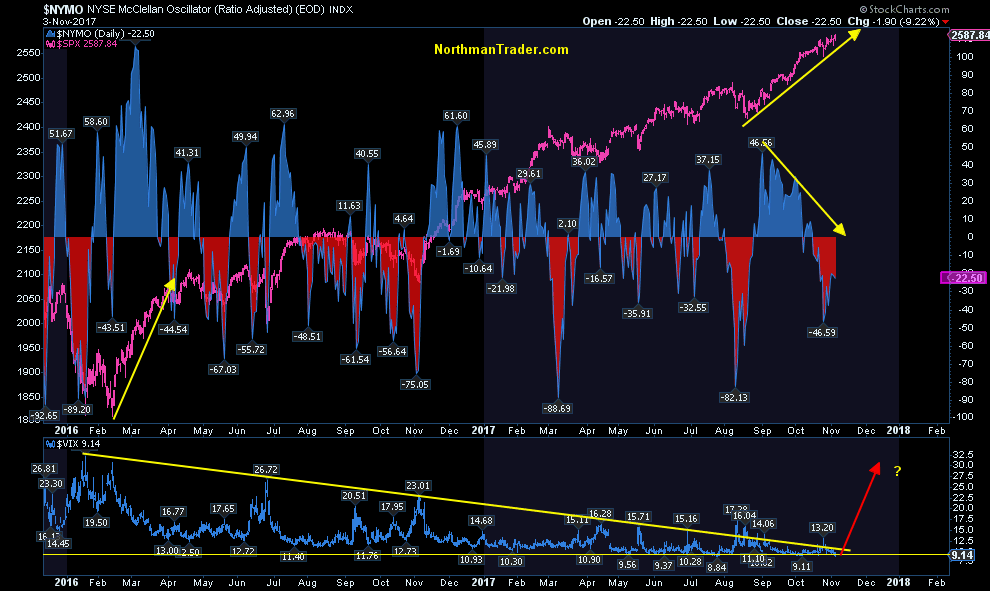
And of particular note: All recent highs have come on a negative $NYMO:


The message: Somebody is selling this market. Every day. And it’s very cleverly done as to not disturb the seeming tranquility in markets.


Note that despite all the selling volatility compression continues at a record pace as during each Friday, no matter what happens in the world, the $VIX is ensured a close below 10 by week’s end:


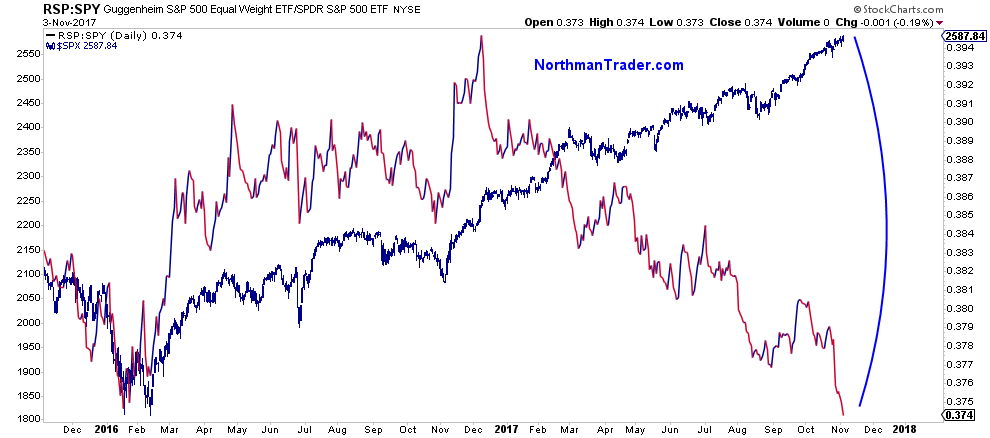
You’d think we’d have more volatility with such an internal breakdown in stocks. But the concentration of market cap in only a handful of stocks continues to mask the selling underneath.


On an equal weight basis we’ve noted the divergence in markets for quite some time. This indicator has now fallen off the cliff as the correlation has completely broken down:


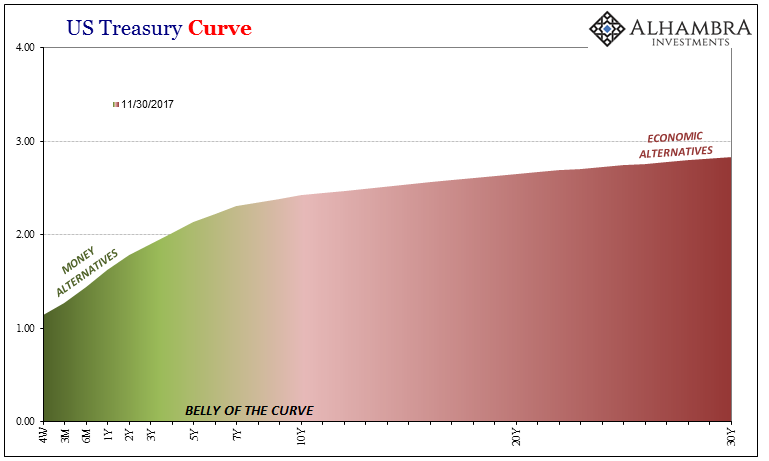
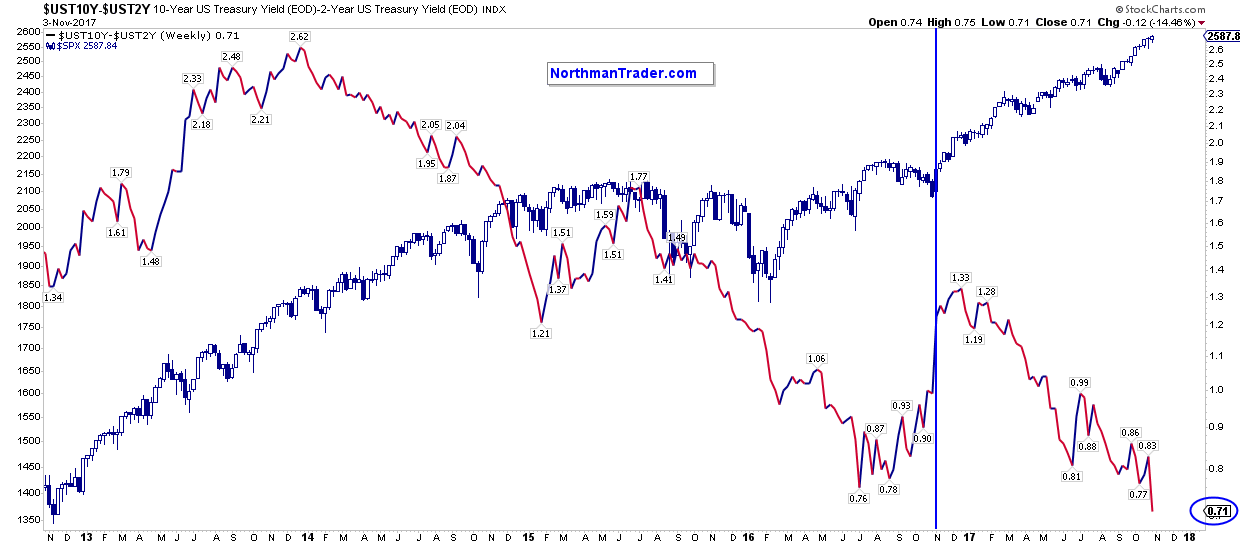
As has the yield curve which hasn’t believed in this rally in months:


2017 has seen more central bank intervention on a global basis than ever. But this party is slowly coming to an end. And while central banks will still intervene in 2018 it will be at a reduced pace. The last time we’ve seen central banks intervene at a reduced pace? 2015. And it produced sizable selling in the summer of 2015 and at the beginning of 2016 forcing record intervention since then.


All global markets have proven is that they can perform splendidly with record intervention:


2018 will then be a test case how well markets can fare with less than record intervention, a new reality. Another new reality: Soon US markets will also have their answer in regards to tax cuts. All will be priced in one way or the other.


And, from the looks of it, someone has begun selling ahead of both of these emerging realities. And once the rest of the market takes notice we suspect Friday $VIX closes below 10 may suddenly become a thing of the past.