Showing posts with label Gold Bugs. Show all posts

Tuesday, December 12, 2017

Finally, Gold Speculators Start To Bail, Setting Up A Big Q1 2018


Finally, Gold Speculators Start To Bail, Setting Up A Big Q1 2018


Posted with permission and written by John Rubino, Dollar Collapse 


Finally, Gold Speculators Start To Bail, Setting Up A Big Q1 2018 - John Rubino


It took a lot longer than it should have, but gold futures traders have finally started behaving “normally.” The speculators who were extremely, stubbornly long – and who are usually wrong when they’re this excited — had maintained their over-optimistic bets when they should have been stampeding for the exits, making the last few months both boring and depressing for gold bugs and related investors.


This departure from the familiar script raised questions about whether the action in futures (aka paper gold) was still relevant in the age of Chinese physical gold exchanges and cryptocurrency. The jury’s still out on that one, but for now the numbers are reassuring.


The following table (courtesy of GoldSeek) shows speculators cutting way back on long bets and adding to short bets, while the “commercials” – who tend to be right at sharp turns — did the opposite, going a lot less short.


Same thing only more so in silver, where another week like the last one will bring net positions into balance for both groups, which has historically been extremely bullish.


Here’s the same data depicted graphically for gold: Note how both the speculators (silver columns) and the commercials (red columns) held their positions from spring into fall, producing the previously-mentioned boredom and depression. Also note the sharp drop in the most recent reporting week.


The numbers we’re seeing here are as of Tuesday the 5th, and the final three days of last week were a bloodbath for precious metals, so it’s highly likely that the next COT numbers – due out on Friday the 15th – will show absolute panic among speculators, leading to an even bigger swing in the right direction.


If history is still reliable, January will be a great month to own precious metals and mining stocks.


Questions or comments about this article? Leave your thoughts HERE.


Finally, Gold Speculators Start To Bail, Setting Up A Big Q1 2018


Posted with permission and written by John Rubino, Dollar Collapse 


Check out these other articles by our contributors:


CPM Group’s Jeff Christian Responds “NEGATIVELY” To The SRSrocco Report On Silver Investment Demand - Steve St. Angelo


Eric Sprott Forecasts Status Quo Now, But Big Rally in 2018 (Weekly Wrap-Up, December 8, 2017)

Saturday, December 9, 2017

Precious Metals Experience a Sharp Decline in Demand as Bitcoin Continues to Steal The Show


Precious Metals Experience a Sharp Decline in Demand as Bitcoin Continues to Steal The Show


Written by Nathan McDonald, Sprott Money News


Precious Metals Experience a Sharp Decline in Demand as Bitcoin Continues to Steal The Show - Nathan McDonald


The Perth Mint, one of the largest sellers of bullion in the world, posted its results and demand is down. Big time.


Additionally, the US Mint has posted figures for its key products, all of which experienced lessened demand throughout the month of November.


The Perth Mint sold 23,901 ounces of gold throughout last month, a drastic drop from October, which saw steady gains. In fact, it was down by 46.4% from October, and 56.3% from November 2016 - a stunning reversal from the previously seen strong demand.


But why is this happening? Have precious metals suddenly lost their luster - has their 10,000 year history as a store of value suddenly evaporated within the matter of a month? Of course not. This is absurd and ludicrous and sounds like a copy and pasted line from any MSM financial outlet.


What is happening is simple. Bitcoin is stealing the show. Bitcoin is decimating the demand for precious metals and will continue to do so until it experiences a massive correction, or becomes out of vogue.


The miraculous rise in the price of Bitcoin has contrarian investors backing up in horror while the cryptocurrency enthusiasts continue to HODL at all cost, forgoing the huge gains they have already experienced in the hope that they will continue to see parabolic gains.


Perhaps they are correct, as the price of Bitcoin has blown through first the $10,000 dollar mark, then $11,000, then $12,000, then $13,000, then $14,000, and then the $15,000 price point. Yes, this all occurred in one week. You can"t make this up!


This is one of the greatest wealth transfers we have seen in centuries, and for those who are ringing the register, you can"t blame them, as long-term holders are likely experiencing gains that they will never again see in their lives.


Still, some in the industry continue to "clutch" their digital coins, as they state Bitcoin could reach $40,000 by the end of this month. This is a wild prediction and one that if proven correct, is truly historic.


I have no idea how much higher Bitcoin is going, nor do I believe anyone else does. This is a totally new asset and one that is impossible to evaluate, especially given its very brief history.


What I am more certain of, with each growing day, is my prediction that precious metals are going to experience a dramatic and sharp reversal. This is a move that is going to be propelled forward throughout the duration of 2018 and one that will eventually see the "barbarous relics" test and break their old highs - a move that is going to be propelled by the eventual top in Bitcoin.


Take heart, gold bugs - better days are coming, and take some advice from your cryptocurrency cousins. HODL!


Questions or comments about this article? Leave your thoughts HERE.


Precious Metals Experience a Sharp Decline in Demand as Bitcoin Continues to Steal The Show


Written by Nathan McDonald, Sprott Money News


Check out these other articles by our contributors:


Thursday, December 7, 2017

The End Is Near?


The End Is Near?


Written by Craig Hemke, Sprott Money News & TF Metals Report


The End Is Near? - Craig Hemke


For gold investors, the major thorn in our side continues to be the USDJPY so we need to discuss it again.


Over the past weekend at TFMR, we had a discussion about how so many well-intentioned people could have been so wrong about "the metals" over the past five years. It included this sentence: "What we failed to predict was the successful, collective manipulation of nearly all "markets" by the CBs, their primary dealers and their willing/sycophant media through HFT."


That one sentence could be the subject of a full post or podcast but, for now, let"s just focus upon the market manipulation through HFT. As you know by now, the USDJPY is just about the single most important general input for HFT buy/sell decisions. Whether it"s S&P futures, bond futures or Comex Gold, the direction of the USDJPY generally impacts all of these "markets" more than anything else. The chart below plots the inverse of USDJPY (JPYUSD) with gold futures. Note clear correlation that began in 2008.


In observing the central bank market manipulation...when we see the same pattern again and again...and this pattern is followed by the desired equity or bond market reaction...then you know something is up. How many times have we captured screenshots of the BoJ, Fed, SNB or whomever buying the USDJPY in size at just the right moment to create and paint a double bottom on the chart? From there, how many times have we watched a near perfect and uninterrupted, 45-degree angle recovery ensue?


Here are just a couple of egregious examples that I just chose at random from my desktop folder that holds about 40 charts. (I"ve only been keeping them since late summer.)


Well, since we just used the term "egregious", let"s apply it again to the charts below. Recall that things were sailing along surprisingly well last Monday. Over the previous week, the USDJPY had failed to hold support near 113 and again near 112 and it had fallen to near and just below the very-important 111 level. Then, as we chronicled that day, a sudden spike occurred on NO NEWS and not even any rumors. Just a spike from out of the blue that drove the pair immediately back above 111.


And what followed over the next five days? Well, outside of the sudden plunge on the now disproven stories from Brian Ross at ABC News, the USDJPY has followed the same glide path all the way back to 113. Also, IT"S VERY IMPORTANT TO NOTE where USDJPY reopened Sunday afternoon...RIGHT ON the glidepath. Remove the reaction to Friday"s unexpected headlines and it"s a near-perfect, 45-degree angle for nearly FIVE FULL DAYS.


(And in case you"re wondering which tail wags which dog, note the turn in USDJPY last Monday clearly preceded the turn in the S&P.)


How is this even possible? It"s not...well, at least not in the traditional and "free market" sense...the pre-2008 and pre-2012 sense. All of these things used to move somewhat independently as human, carbon-based traders made rational investment decisions based upon a number of inputs. However, in 2017, where 90% of all trading is now done through HFT....well, the results are pretty clear. The Central Banks and their Primary Dealer trading desks manipulate the key inputs and HFT does the rest. This is why yours truly and so many other "experts and mavens" have been confounded for the past five years. It"s not nefarious intent and it"s not because gold bugs are cruel, heartless charlatans who are intent upon stealing as many dollars as possible from the easily-duped. Instead, it is a failure to anticipate the levels to which The Central Banks would successfully go to keep their system alive.


Understanding this is why you consistently hear me cite the refrain of PHYSICAL DEMAND. It is only through a renewed crisis of confidence that this system can be broken...at least as it pertains to the precious metals. Physical demand will bust The Bullion Banks by breaking their just-in-time and unallocated delivery system. Physical demand will force price to be discovered through the exchange of physical metal, not the alchemized digital garbage that permeates the system today.


We"ll leave you today with stories from each end of The Bank monster. The first, and one that we"ve been following closely since last March, is the continued run-up to renewed war on The Korean Peninsula. WHILE NO ONE IN THEIR RIGHT MIND IS CHEERING THIS ON, it is important to be prepared for all of the unknown unknowns that would come with such a catastrophe, one of them being financial calamity that could again shatter confidence in the current system.


http://theweek.com/articles/740264/why-north-korea...


And the other story deals with gold alchemy and the continued shunting of physical demand into sham/scam paper investments. It seems the World Gold Council is hungry to increase their fees. They are apparently planning to offer a whole new "gold" ETF, perhaps designed to compete with the IAU. Ask yourself, from where will this fund get the 200-300 metric tonnes of gold needed to fund its "inventory"? Once again, The Banks will simply perform the alchemy of leveraging current unallocated stockpiles into more and more digital "gold".


http://www.etf.com/sections/daily-etf-watch/new-ph...


Again, true physical demand is the only antidote to the poison created by the Central Bankers and the Bullion Banks. Sadly, 2018 promises another surge in war, debt, negative interest rates and de-dollarization. Will these events finally prompt enough physical demand to break The Banks? Only time will tell.


Questions or comments about this article? Leave your thoughts HERE.


The End Is Near?


Written by Craig Hemke, Sprott Money News & TF Metals Report


Check out these other articles by our contributors:


Craig Hemke -   Another Tradable Low Coming


John Rubino - Finally, An Honest Inflation Index – Guess What It Shows


Jeff Thomas - Tilt! Game Over


Ask The Expert: Jim Willie

Sunday, November 26, 2017

Is Crypto The Only Truth?

In the nearly thirteen years that I"ve been writing Slope of Hope, perhaps the most ironic post (out of over 20,000) was one I did last January called Bitcoin"s Massive Bullish Base. The reason it"s ironic is because Slope is largely dedicated to seeking out short-selling ideas for stocks, whereas the post was about going long a cryptocurrency. Seven-hundred percent later, It turned out to be the greatest trade idea in the blog"s history, which actually doesn"t feel that great for the reason just cited.


1125-bullbase


In any case, the "bullish base" had merit (just like in the old days for stocks - - remember those?) and, in the months following the post, it"s quite evident what an explosive rally we"ve had. I"ve tinted the original "base" in green.


1125-bitcoin


As cryptos continue to roar higher, and as Bitcoin itself vaults toward $10,000, the world is increasingly awash in excitement, come-ons, scholarly essays, scam artists, and everything in between. Anything that goes from one penny (2009 price) to almost ONE MILLION times that, is going to catch some attention. There aren"t many financial instruments that go from one thousand dollars to a billion dollars in value in the span of eight years. Bitcoin makes Amazon and Apple look like complete garbage investments.


Do cryptocurrencies represent the last bastion of an honest market? After all, you don"t have any central banks screwing around with them (like they do with stocks and bonds), and you don"t have meddlesome governments trying to get their grimy fingers and regulations wrapped around these instruments. It could be argued that, after eight years of absurd and grotesque intervention on so many other financial assets, Bitcoin finally represents a sliver of honest price discovery.


Personally, I"m of two separate minds when it comes to Bitcoin (which I"ll use as a catch-all with respect to cryptocurrencies, since it by far the largest and best-known). One is that, in the same sense that some celebrities are "famous for being famous", like these wastes of space.............


.......Bitcoin is getting more valuable because it"s getting more valuable. Call it the Greater Fool Theory if you like, or just plenty of free global publicity, but as the frenzy feeds on itself, more and more people are piling in, terrified of missing out on what appears to be free money.


Another part of me is thinking that Bitcoin has become the recipient of all the animal spirits that gold was SUPPOSED to inherit. It wasn"t that many years ago, particularly around 2010 and 2011, that the world was going almost as crazy for gold as they are currently going for Bitcoin. Do you remember articles like this one? They were EVERYWHERE.


1125-goldten


Writers would speculate that gold, which almost got to $2,000/ounce in September of 2011, was on its way to $3000.........$5000............$10,000. The predictions got increasingly loony, but given the insanity going on with central bank intervention, it actually made a lot of sense that "sound money" would be the place where sensible souls were squeezed into.


As you well know,. however, just when gold mania was peaking at about $1900 per ounce, it went into an almost-any-asset-is-better bear market of its own, stumbling, fumbling, and languishing its way down to a complete lame-o loss of 35% over a period of about six years. Gold has, particularly compared to just about any other asset imaginable, completely sucked.


1125-goldlanguish


My declaration that it "sucked" is risk-free now, because any five-year old kid could draw the same conclusion. It would be foolhardy to say the same thing during its heydey, though, even as it was descending in 2012, 2013, etc., since gold bugs were fanatical about their rightness. It took years before someone could shamelessly roll their eyes at precious metals and get away with it, because PM types had a zealotry few religions could match. Now they have fallen into embarrassed silence. There"s only so long you can declare that change is "just around the corner".


This zealotry is present with cryptos these days. Just try to hop onto Twitter or a comments stream and bash (or even question) cryptos. You"ll be torched. So there has been, it seems, a transference of these passions from the world of precious metals to the world of cryptos, and it"s easy to see why; cryptos have made investors tons of money, where gold has let all of its believers down unless they bought it, I dunno, 1999 or something.


It"s an odd thing, though. I mean, let"s face it, gold should be intrinsically more appealing to the human spirit than a bunch of 1s and 0s. Put a stack of gold coins in front of a bunch of five years old that are playing, and put down a few sheets of paper with SHA-256 hash codes printed on them, and watch to see what the kids find more enjoyable. Gold looks pretty, it feels substantial, and it seems like.........money.


Jump back forty years, and you can witness a time when people regarded gold with the same fervor as Bitcoin.......doesn"t this chart look familiar?


1125-goldzoom


If you think Bitcoin is heading for some kind of blowoff top, perhaps gold"s history can suggest what"s next. If financial history repeats itself, perhaps something like this is in store:


1125-goldcrash


I"m pretty ambivalent about cryptos myself, because I"ve never bought one, and God knows even I"m not fool enough to try shorting any of them. As a chartist, just as I was impressed by Bitcoin"s bullish base, I"m likewise impressed by the breakout we"ve seen in Ethereum:


1125-ether


All the same, with all the mayhem surrounding this phenomenon, particularly the celebrities trying to come up with their own cryptos (my favorite: Coinye West), it sure does have all the typical attributes of a fad-based bubble. If so, the fall should be more interesting as the rise. Whether this happens or not only time can tell, but I, for one, don"t want to follow a genius like Newton on a road like the one he took four centuries ago.


Saturday, October 21, 2017

Key Charts: Gold is Cheap and US Recession May Be Closer Than Think

by Dominic Frisby of Money Week


Every year, Ronald-Peter Stoeferle and Mark J Valek of investment and asset management company Incrementum put together the report In Gold We Trust – 160-plus pages of charts and thoughts, mostly gold-related, on the state of the world’s finances.


There’s so much to look at and consider. It’s a sort of digital equivalent of a coffee-table book.


Yesterday I got an email from them, containing a “best of” – a compendium of some of the best charts from this year’s report.


I thought in today’s Money Morning, we might flick through some of them…


Commodities are very cheap compared to stocks


For those of you who have been, like me, despairing of the gold price these last five years, this first chart shows the average annual price of gold for each year.


Suddenly the last five years don’t feel quite as bad. In the mid-$1,200s is sort of normal (since 2008, at least).


Gold chart


This next chart got me very excited. It shows the ratio of the Goldman Sachs commodities index to the S&P 500 – the ratio of commodities to stocks, in other words.


Commodities are as cheap on a relative basis as they were in the late 1990s and at the beginning of the 1970s. In other words, very cheap indeed.


Gold chart


I’m quite bullish on industrial metals and energy at present. I think such “late cycle” assets will do well in  a stock bull market which is mature and, probably, a lot closer to the end than the beginning of its cycle. I don’t, however, think that commodities are the irresistible bargain they were in 1999.


The chart above, however, would suggest otherwise. It is screaming, “buy commodities, sell stocks”. The inference is that there is some inflation around the corner.


Could a US recession be around the corner?


Here’s one for the contrarians: in a recent Bloomberg survey, not one economist out of 89 expects a US GDP contraction in 2017, 2018 or 2019. Meanwhile the Vix (the index of volatility) is at all-time lows. There is, in short, a heck of a lot of complacency out there.


Gold chart


Are we now in a rate-hiking cycle? In the US we seem to be, even if interest rates now stand at only 1.25%. The Bank of England meets next week. Inflation, as judged by the Consumer Price Index (CPI) – the Bank’s target  measure – came in at 3% yesterday, the last report before the Bank’s meeting. Surely even Mark Carney has to put up rates now.


That could be a significant turning point. According to this next chart, 16 of the last 19 rate rise cycles have led to recessions.


Gold chart


That doesn’t necessarily mean that interest-rate rises cause recessions – often it’s the over-expansion caused by the loose monetary policies which preceded the rate rises – but nevertheless there does seem to be some kind of relationship. Perhaps more rate rises could result in the recession that nobody is forecasting.


Following on from that, the next chart hints that all is not as well with the economy as we might believe. As someone who did a show at the Edinburgh Festival on tax and is now writing a book on the same subject, any cool tax charts are bound to get the blood flowing, and this is no exception.


The S&P 500 may be rising – but gross tax revenues aren’t. The amount of tax being paid, whether on a personal or corporate level, is indicative of how much people are earning and how much economic activity is taking place. Tax receipts are in decline. The omens are not good.


Gold chart


You could draw the same chart for net corporate tax receipts. The pattern is the same.


It’s another hint that the economy is not faring quite as well as the stockmarket suggests it is.


What if gold were money again?


Finally some charts for the hard money advocates.


The first shows, basically, the ratio of the money supply – ie, the amount of money that has been printed – compared to savings.  The higher the blue bar, the less money is being saved.


Gold chart


If the narrative of this chart is believed, this is not going to end well – although I stress that you could have made the same point in 2014, 2015 and 2016 , so perhaps we will be making the same observation for another three years.


Lastly, some simultaneously sensible yet ridiculous projections of the gold price in the future.


During the 1980 Iranian hostage crisis, gold went to $850 an ounce – for a day. On that day – 21 January – the US dollar was, effectively, fully backed by gold. At $850 an ounce, the market value of the 260 million ounces of gold owned by the US and mostly stored in Fort Knox (don’t mention the audit) reached $221bn. Yet only some $160bn paper dollars were in issue.


So US gold was actually worth 140% of US paper. So low was confidence in the dollar (indeed all paper money at the time), that the US had, in a way, been put back onto a gold standard. One Zurich banker declared: “The US Treasury is once again solvent, thanks to the high price of gold”.


Many gold bugs – including yours truly at one stage – were waiting for that day to come again. Because money supply and debt are so high, central banks will lose control, confidence will be lost and gold will soar as a result.


I now see such a scenario as most unlikely – though I stress it has happened many times before, so there’s no reason it can’t happen again. And in such a light, we consider the table below.


There are all sorts of different measures of money supply.


M0 and M1 are basically cash and other money equivalents that are easily convertible into cash. M2 is M1 plus short-term time deposits in banks and money market funds. M3 is M2 plus longer-term time deposits and money market funds. The exact definitions vary from country to country.


The following table shows what price gold would be if it were equivalent to 20%, 40% or 100% of the various measures of US money.


Gold chart


In the event of some kind of fiat crisis akin to that of 1980, the numbers start getting pretty big. 140% of M1 – the intraday 1980 number – would give us a gold price somewhere near $18,000. Nice work if you can get it. Although I imagine bitcoin will get to $18,000 long before gold does.


But this all makes the assumption that, at some stage, prevailing attitudes to gold – that it is an analogue relic in a digital world – will change. And that it will be ascribed some kind of value as money in extremis. I’m not so sure that day will ever happen, or at least not in the near term. Others will disagree.


In any case, the main takeaways from the charts are then that both gold and commodities are cheap, relative to both money supply and to stockmarkets; and that, based on tax receipts, contrarian forecasting and rate cycles, some kind of contraction is more likely than many think.


Food for thought, I think you’ll agree.


News and Commentary


Gold prices hold firm as dollar sags (Reuters.com)


Dollar Gains, Treasuries Fall on U.S. Tax Hopes (Bloomberg.com)


Asia-Pacific stocks start lower, edge back into positive territory (MarketWatch.com)


Trump leaning toward Powell for Fed chair, officials say (Politico.com)


Gold purchases on Moscow Exchange won’t change reserves’ outlook - Russia (Reuters.com)


Source: ZeroHedge


How one of the first big property bubbles led to the Great Depression (MoneyWeek.com)


Warning of "ecological Armageddon" after dramatic 75% plunge in insect numbers (Yahoo News)


S&P 500 Is Now Overvalued On 18 Of 20 Metrics (ZeroHedge.com)


2 Charts Show S&P A Bubble and Risk of Crash (ZeroHedge.com)


China’s Greater Bay Area gets a big green light (StansBerryChurcHouse.com)


Gold Prices (LBMA AM)


20 Oct: USD 1,280.25, GBP 974.27 & EUR 1,084.76 per ounce
19 Oct: USD 1,283.40, GBP 975.64 & EUR 1,087.42 per ounce
18 Oct: USD 1,280.65, GBP 972.53 & EUR 1,090.47 per ounce
17 Oct: USD 1,289.70, GBP 973.47 & EUR 1,097.02 per ounce
16 Oct: USD 1,305.15, GBP 981.08 & EUR 1,107.03 per ounce
13 Oct: USD 1,293.90, GBP 972.88 & EUR 1,093.73 per ounce
12 Oct: USD 1,294.45, GBP 977.96 & EUR 1,092.26 per ounce


Silver Prices (LBMA)


20 Oct: USD 17.08, GBP 12.96 & EUR 14.46 per ounce
19 Oct: USD 17.03, GBP 12.93 & EUR 14.40 per ounce
18 Oct: USD 16.95, GBP 12.86 & EUR 14.42 per ounce
17 Oct: USD 17.11, GBP 12.96 & EUR 14.55 per ounce
16 Oct: USD 17.41, GBP 13.09 & EUR 14.75 per ounce
13 Oct: USD 17.20, GBP 12.94 & EUR 14.55 per ounce
12 Oct: USD 17.20, GBP 13.06 & EUR 14.50 per ounce


Recent Market Updates


- How Gold Bullion Protects From Conflict And War
- Silver Bullion Prices Set to Soar
- Brexit UK Vulnerable As Gold Bar Exports Distort UK Trade Figures
- Puerto Rico Without Electricity, Wifi, ATMs Shows Importance of Cash, Gold and Silver
- U.S. Mint Gold Coin Sales and VIX Point To Increased Market Volatility and Higher Gold
- Global Outlook – Mad, Mad, Mad, MAD World: News in Charts
- Young Guns of Gold Podcast – ‘The Everything Bubble’
- London House Prices Are Falling – Time to Buckle Up
- Perth Mint Gold Coins Sales Double In September
- Survey shows UK and US Pensions Crisis is Imminent
- Gold Investment In Germany Surges – Now World’s Largest Gold Buyers
- Yahoo Hacking Highlights Cyber Risk and Increasing Importance of Physical Gold
- Safe Haven Silver To Outperform Gold In Q4 And In 2018


Important Guides


For your perusal, below are our most popular guides in 2017:


Essential Guide To Storing Gold In Switzerland


Essential Guide To Storing Gold In Singapore


Essential Guide to Tax Free Gold Sovereigns (UK)


Please share our research with family, friends and colleagues who you think would benefit from being informed by it.

Wednesday, July 26, 2017

"Psycho"

Gold remains inside its 5 year wedge with no clear trend yet revealed.


But there are a number of near-term potential catalysts such as the German Elections, Debt Ceiling Debate & Commitment of Traders positioning  which may help give some clarity.


In the meantime, "People are literally losing their minds.”


So says Santiago Capital"s Brent Johnson in this clip regarding gold, global markets and cognitive dissonance.


 Whether it"s those on the Left that cannot handle Trump in the White House, or those on the Right who can’t understand how CNN is still in business.  Whether it"s the gold bugs who can’t understand why gold is not over $10k/ounce, or the equity bears who think equities are overvalued by at least 50%.   They cannot reconcile the fact that their minds are saying one thing while simultaneously trying to comprehend the information being broadcast on their T.V.s and computer monitors.


Tracing the source of this cognitive dissonance back to the real “Seven Psychopaths” (voting members of the FOMC), Johnson asks you to just listen (and keep an open mind) to see whether you are guilty of psychotic thinking as well.


While referencing characters from real life and the movies,  Johnson wonders whether the bears are overly focused on the equity market (symptom) rather than where the real psychos are focused, which is the bond market (problem). 


And also wonders, based on studies showing that “The feeling of knowing” is based on an involuntary brain mechanism much like lover or anger, is it reason or biology that is determining our opinions on the markets?


Johnson believes the danger that most people don’t see is in interest rates.  And whether due to a currency crisis, sovereign debt crisis, or the simple forgiveness of G20 sovereign debt,  rates may very well rise further and faster than most currently see possible. 


In the end, fundamentals always win.  But in the short term, markets are Psycho.


Monday, July 17, 2017

Stockholm Syndrome Gold Report, 16 July 2017

Stockholm Syndrome is defined as “…a condition that causes hostages to develop a psychological alliance with their captors as a survival strategy during captivity.” While observers would expect kidnapping victims to fear and loathe the gang who imprison and threaten them, the reality is that some don’t.


There is a loose analogy between being held hostage and being an investor in a regime of irredeemable paper currency and zero interest rates. In both cases, the victim has little hope of escape and must seek to somehow survive under malevolent conditions.


Key behaviors in Stockholm Syndrome are positive feelings for their captors, a refusal to work with law enforcement afterwards, and even a belief in the terrorist’s humanity.


Key behaviors of investors today show eerie parallels: a desire to bid on dollars with their assets, a refusal to support the gold standard, and even a belief that the dollar is money. This last always shows when someone—even a gold bug—says gold is going up, or gold is the best performing currency, or gold has good returns.


These words up, performance, and returns indicate that the victim accepts the dollar as money, the dollar as the measure of value, the dollar as the unit of account. The victim seeks to view gold in terms of his captor’s paradigm. Much the way the kidnapping victim seeks to understand his capture and even geopolitics in terms of his captor’s world view.


Many victims are so thoroughly in thrall, that they scoff at the very idea of earning interest from a productive enterprise. They seek only the latest bubble, wherein they can make a profit: more dollars. Or, if not more dollars, at least more purchasing power. For years, they sought to do this in the gold and especially silver markets. Some gold bugs go even farther, and opposed a gold standard. Perhaps they don’t want sound money, they want gold to go up which means something external that gold can go up against.


We watched bemused, as a speaker at the Metal Writers Conference in Vancouver on May 29 told a standing-room-only crowd that bitcoin would hit $1 million (it went up after that, but is now down about 15% from that day). A 436X return would be nice, but of course the profits can only come from later speculators. There is an ugly little word for schemes in which profits come from those who buy in later. It is named for a gentleman who came from Italy, promoting his scheme in Boston.


We blame the game, not the player. It is important to emphasize this—don’t blame the players, blame the game—and we probably don’t do it enough. The fault lies not with those who bet on gold or bitcoin or anything else, nor even with those who regard betting as investing. The fault lies with the Fed and the other central banks who have the hubris to think they can centrally plan their way to prosperity. And the gun to force it on us, whether we agree or not. And the madness to cause the interest rate to fall for 36 years and counting (the Fed is not going to push the interest up much farther in this cycle, if they even dare one more hike). When freedom seems so remote as to be hopeless, it may be natural (we leave this to psychologists to say) to find a way to compromise, to get along to go along.


As to us, we will go on working towards that day of freedom, a big part of which is helping people see the monetary system for what it is: the current implementation of the fifth plank proposed by Karl Marx. Another part is to pay interest on gold…


Last week, we said:


“Peak hype, peak desperation, all selling in the streets with little buying… we are not technicians and do not focus on sentiment… but this description sounds like the definition of capitulation.


…


Also, we would add something important. Even if this is a capitulation low, that does not necessarily a mean a moonshot to $5,000 or even $2,000. We don’t expect that, and won’t expect it without evidence of a much more serious shift in the fundamentals. We would expect a normal trading bounce within the range and perhaps a few bucks over $1,300.”


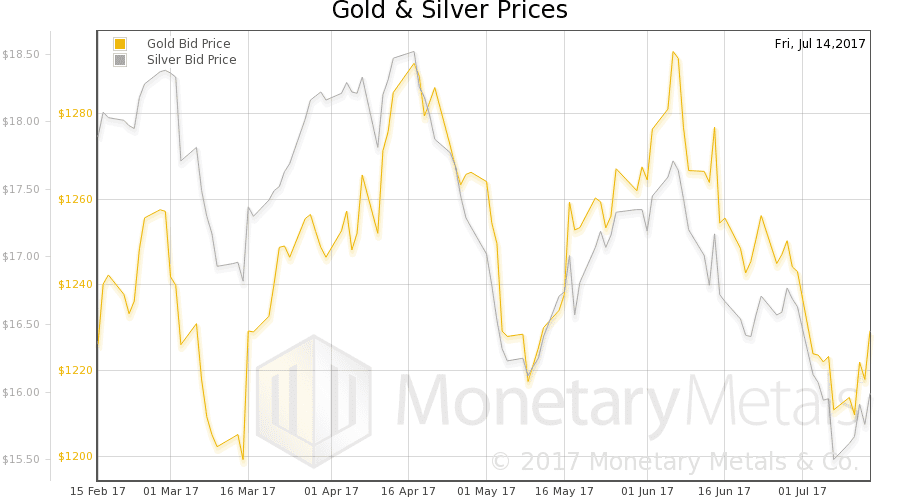
This week, the prices of the metals bounced somewhat, within the trading range. Gold closed last week at $1212, and this week at $1229. In silver, last week’s close was $15.56, and this’s week was $15.96.


Will the bounce continue? Have the fundamentals firmed up?


We will show graphs of the true measure of the fundamentals. But first charts of their prices and the gold-silver ratio.


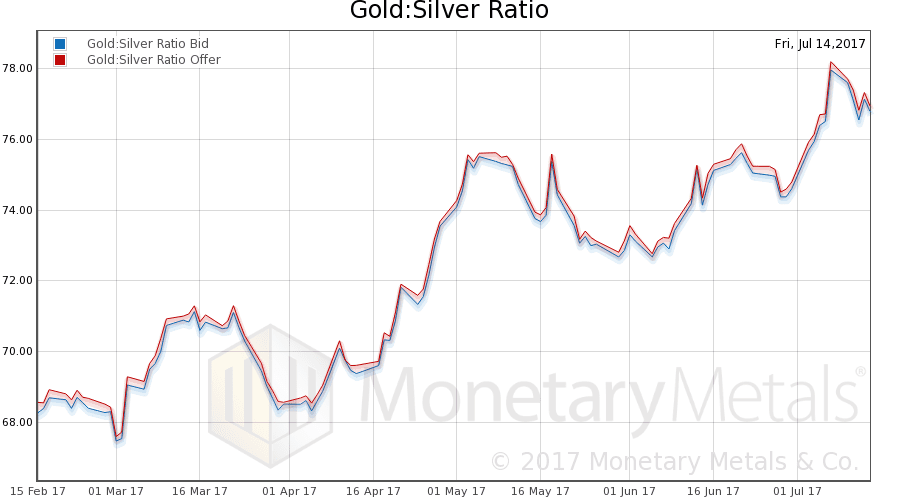
Next, this is a graph of the gold price measured in silver, otherwise known as the gold to silver ratio. The ratio moved down this week.


In this graph, we show both bid and offer prices for the gold-silver ratio. If you were to sell gold on the bid and buy silver at the ask, that is the lower bid price. Conversely, if you sold silver on the bid and bought gold at the offer, that is the higher offer price.


For each metal, we will look at a graph of the basis and cobasis overlaid with the price of the dollar in terms of the respective metal. It will make it easier to provide brief commentary. The dollar will be represented in green, the basis in blue and cobasis in red.


Here is the gold graph.


The dollar fell a bit this week (the mirror image of the rising price of gold). Now it is the dollar hostages who use gold as their preferred hostage-bargaining chip to feel a bit better. One ounce of this commodity now fetches 17 more of the kidnapper’s paper scrip than it did a week ago.


As the dollar fell, the cobasis fell (especially in farther-out contracts). The August cobasis is still above zero (i.e. temporary backwardation).


Our calculated gold fundamental price is not much changed, still above the market price by a goodly margin (chart here).


Now let’s look at silver.


As the dollar has dropped (i.e. silver trades for more gang-scrip than last week), the cobasis has come down. But it’s still higher than gold’s cobasis, and this is the September contract, a month further from expiry than the August gold contract.


Our calculated silver fundamental is rising again, also a healthy margin above the market price.


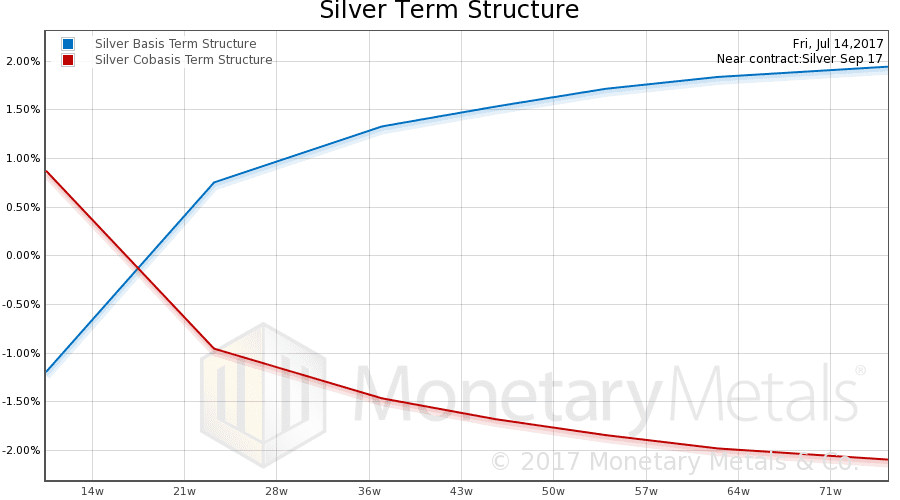
We thought it would be worth addressing the question: “is there a shortage in silver?” Let’s do it with a device that’s famously worth 1,000 words. This picture shows the term structure of the silver futures market.


What we see is what Sherlock Holmes observed that people heard in the night in the story Silver Blaze. There are no interesting features. Other than the temporary backwardation in the September contract, we see a rising basis and falling cobasis as we look out to December 2018. The rising basis looks a lot like the yield curve in the dollar, though slightly lower (6-month LIBOR is 1.5%).


If a real shortage developed in silver, the above curve would look quite different. And we would be publishing pictures of it.


Monetary Metals will be exhibiting at FreedomFest in Las Vegas in July. If you are an investor and would like a meeting there, please click here. Keith will be speaking, on the topic of what will the coming gold standard look like.


© 2017 Monetary Metals

Sunday, June 11, 2017

Palladium Pandemonium - Short Squeeze Sends Precious Metal Spreads Parabolic

Authored by Kevin Muir via The Macro Tourist blog,


I know just enough about the palladium market to get myself into some serious trouble - which means, I don’t know much. But this morning, the popular trader Kid Dynamite tweeted about a surprising development in the palladium futures market.


https://www.thefringenews.com/wp-content/uploads/2017/06/themacrotourist.comKidJun0917-7bcd862d612454508c5cd6c5abcbfdb3819682bb.png


Usually, metals’ futures markets trade in contangos. The future price is higher than the spot price to account for the opportunity cost of holding (or financing) the long position in the underlying metal.


https://www.thefringenews.com/wp-content/uploads/2017/06/themacrotourist.comGCCurveJun0917-920adceb89e083811e85ebf736817e5737299e95.png


There is also a cost of storage which needs to be incorporated into this calculation. Arbitrageurs keep the prices in line, and whenever the futures price rises too much, they sell the future, buy the spot, finance the position and arrange for storage. On expiry, they deliver into the futures contract, earning their profit. If the future prices are too cheap, then either arbitrageurs unwind, or might even borrow the metal short to sell in the spot market, and cover by taking delivery for their futures long position. Also natural long buyers who are willing to wait, could buy the forward contract, content to own their metal at a discount to spot later. Assuming there is a properly functioning metals market, the futures price should not deviate too far from the cost of carry.


Which is why today’s action in the palladium market is so interesting. Buyers are willing to pay a large premium for the contracts that expire earlier (which is the exact opposite of what should occur).


Have a look at the prices for the different palladium contracts.


https://www.thefringenews.com/wp-content/uploads/2017/06/themacrotourist.comPACTJun0917-cfc17cdf8627853f8627c49f0dffc2067940fb00.png


The volumes are small at the front end of the curve, so I can already hear the complaints - that’s not a real market, someone just got squeezed on delivery.


Yet, if there was simply a problem with the June delivery, then we would see the June contract trading at a big premium, and the rest of the curve would be in contango. Instead, the whole curve has inverted.


Here is the chart of the September 2017 versus December 2017 palladium spread.


https://www.thefringenews.com/wp-content/uploads/2017/06/themacrotourist.comPAUZJun0917-f32b8a6cbffa9e883b8b34e0824f1fa8d5c9ebab.png


This is a real spread market that you can trade. So right now, you can enter into a contract to sell palladium in September, receive it back in December, and pocket $24 extra dollars for your work. It’s not just a June delivery problem, the whole curve is inverted.


https://www.thefringenews.com/wp-content/uploads/2017/06/themacrotourist.comPACurveJun0917-ffeefe1b1243bdcc426f4c133b5f9ebb9dfc237f.png


So what’s going on? Well, let’s take a peek of the spot price of palladium.


https://www.thefringenews.com/wp-content/uploads/2017/06/themacrotourist.comSpotJun0917-7137e44a8ed806fba169183cac36fb030afb74ca.png


It’s up on a stick and breaking out to new highs. Not only that, it’s doing this as the rest of the precious metals are sucking wind.


I realize palladium is more of an industrial metal than a pure precious metal, but not only is it breaking to new highs for this move, but it is actually pushing up against the highs that were hit during the great precious metals bull market of 2011.


https://www.thefringenews.com/wp-content/uploads/2017/06/themacrotourist.comPalladiumLTJun0917-f910591cedf819ee8a3f7c7c1e27b7cbce14a311.png


One of my trading buddies, the always insightful Ari Pine trades a ton of precious metals, and has been encouraging me to watch the palladium/platinum spread for some time now.


https://www.thefringenews.com/wp-content/uploads/2017/06/themacrotourist.comSpreadJun0917-264d22324a56e6e9a4819fd5e73b063de03c31cc.png


I wish I had listened. Ari was spot on correct that something was happening in the palladium market that deserved our attention (for Ari’s views on gold, click here for his interview on the great Futures Radio Show Podcast).


Palladium has been gaining versus platinum for the past year. Why do we care about this spread? Well, palladium and platinum’s main use is in the fabrication of catalytic converters for automobiles.


And maybe this offers a clue as to why palladium is soaring. I grabbed this palladium FAQ off the web that explains the two metals’ use in cars.


https://www.thefringenews.com/wp-content/uploads/2017/06/themacrotourist.comUsesJun0917-6209979aaa0a207c20afa6e57323e96a93b5746f.png


Palladium is mainly used in gasoline engines, while platinum plays a larger role in diesel cars. The Volkswagen emissions scandal effectively killed diesel’s future in passenger vehicles, so maybe this palladium outperformance can be explained by the dramatic switch from diesel to gasoline.


Combine this extra demand with the fact that palladium is a small market that was already suffering from challenging global supply, you had the recipe for a squeeze.


This slide is from North American Palladium’s website presentation from 2015 (it’s tough to find up to date information about palladium):


https://www.thefringenews.com/wp-content/uploads/2017/06/themacrotourist.comSupplyJun0917-1e05f8aae9973befc1314d0313929b7da5792391.png


When I was discussing palladium with Ari this morning, he wryly commented, “now that we have noticed the big curve inversion, the move is probably over.” That’s part of the reason I enjoy talking with him. Ari is probably even more cynical than me.


But I told him that this palladium move was a high standard deviation event. And I reminded him of one of my favourite lines. You know the problem with fading a 4 standard deviation move? It’s almost always right, but not before it becomes a 6 or 7 standard deviation move…


*  *  *


P.S.: For those gold bugs out there, some day I envision this same inversion occurring in the gold futures market, and this palladium episode should be filed away in the playbook for what to expect.