Showing posts with label BLS. Show all posts

Tuesday, December 26, 2017

Home Prices In 80% Of US Cities Grow Twice Faster Than Wages... And Then There"s Seattle

According to the latest BLS data, average hourly wages for all US workers in November rose at a stubbornly low 2.5% relative to the previous year, well below the Fed"s "target" of 3.5-4.5%, as countless economists are unable to explain how 4.1% unemployment, and "no slack" in the economy fails to boost wage growth. Another problem with tepid wage growth, in addition to crush the Fed"s credibility, is that it keeps a lid on how much general price levels can rise by. With record debt, it has been the Fed"s imperative to boost inflation at any cost (or rather at a cost of $4.5 trillion) to inflate away the debt overhang, however weak wages have made this impossible.


Well, not really. Because a quick look at US housing shows that while wages may be growing at roughly 2.5%, according to the latest Case Shiller data, every single metro area in the US saw home prices grow at a higher rate, while 16 of 20 major U.S. cities experienced home price growth of 5% or higher: double the average wage growth, and something which even the NAR has been complaining about with its chief economist Larry Yun warning that as the disconnect between prices and wages become wider, homes become increasingly unaffordable.


And while this should not come as a surprise - considering we have pointed it out on numerous occasions in the past - one look at the chart below suggests that something strange is taking place in Seattle, which has either become "Vancouver South" when it comes to Chinese hot money laundering, or there is an unprecedented mini housing bubble in the hipster capital of the world. Also worth keeping an eye on: price appreciation in Sin City has quietly surged in recent months, and in September home prices surged 10.2% Y/Y, the only other double digit price increase in the US after Seattle. Considering that Las Vegas was the epicenter of the last housing bubble when prices exploded higher only to crash, it may be a good idea to keep a close eye on price tendencies in this metro area. 


Confirming the recent jump in home prices, at the national level in Octoner home prices for the Top 20 metro areas rose 6.4% YoY according to Case Shiller, the fastest rate since June 2014. As Bloomberg adds, "a lingering shortage of previously owned homes is keeping housing prices elevated. That’s allowed homeowners to recover the equity lost during the housing collapse and recession a decade ago."


“Home prices continue their climb supported by low inventories and increasing sales,” David Blitzer, chairman of the S&P index committee, said in a statement. But that climb may be interrupted by the Federal Reserve hiking interest rates next year, he said. “Since home prices are rising faster than wages, salaries, and inflation, some areas could see potential homebuyers compelled to look at renting."


Meamwhile, for those looking to buy for the first time, conditions are less favorable. Growth in property values is outpacing wage gains and limiting affordability, representing a headwind for the market.


Finally, putting the above data in context, here are two charts courtesy of real-estate expert Mark Hanson, the first of which shows how much household income increase is needed to buy the median priced home in key US cities...


... while the next chart shows the divergence between actual household income, and the income needed to buy the median priced house.


Thursday, December 14, 2017

Stockman Slams "Bubble Finance And The Era of No-See-Um Recessions"

Authored by David Stockman via Contra Corner blog,


Today"s single most dangerous Wall Street meme is that there is no risk of a stock market crash because there is no recession in sight. But that proposition is dead wrong because it"s a relic of your grandfather"s economy. That is, a reasonably functioning capitalist order in which the stock market priced-out company earnings and the underlying macroeconomic substrate from which they arose.


Back then, Economy drove Finance: You therefore needed a main street contraction to trigger tumbling profits, which, in turn, caused Wall Street to mark-down the NPV (net present value) of future company earnings streams and the stock prices which embodied them.


No longer. After three decades of monetary central planning and heavy-handed falsification of financial asset prices, causation has been reversed.


Finance now drives Economy: Recessions happen when central bank fostered financial bubbles reach an asymptotic peak and then crash under their own weight, triggering desperate restructuring actions in the corporate C-suites designed to prop up stock prices and preserve the collapsing value of executive stock options.


Accordingly, you can"t see a recession coming on Janet Yellen"s dashboard of 19 labor market indicators or any of the other "incoming" macroeconomic data---industrial production, retail sales, housing starts, business investment---- so assiduously tracked by Wall Street economists.


Instead, recessions gestate in the Wall Street gambling parlors and become latent in carry trades, yield curve and credit arbitrages and momentum driven excesses. Eventually, these latencies---central bank fostered bubbles-----erupt suddenly and violently. So doing, they spew intense, unexpected contractionary impulses into the main street economy via the transmission channel of C-suite "restructuring" actions.


Within weeks of a bubble implosion, therefore, a No-See-Um Recession is born and goes rampaging across the economic landscape. But it comes as a shock to economists and especially the Keynesian apparatchiks at the Fed because they are focused on the macroeconomic externals rather than the coiled spring internals of the financial markets.


In this context, it can be said that the Great Recession was the first major business cycle contraction that reflected the new regime of central bank driven Bubble Finance.


What happened was that a garden-variety macroeconomic slowdown which incepted in 2007 went rogue when it was monkey-hammered by the Lehman bankruptcy and the related crash of fundamentally insolvent Wall Street gambling houses thereafter.


This is evident in much of the macroeconomic data, but the snapshot of retail sales below aptly illustrates the case.


From July 2006 through August 2008 (the ninth orange bar in the shaded area) the US economy oscillated along a flatline of weak and inconsistent retail sales growth. Although in its wisdom the NBER dated the recession as incepting in December 2007, the retail sales pattern during the first nine months of the downturn was not appreciably different than during the 17 months just prior.


But in September 2008 retail sales went into free fall----coterminous with the Wall Street meltdown and the desperate Washington interventions via the massive Fed liquidity injections and the TARP bailout.  During that month, retail sales plunged at a 21% annualized rate-----followed by 50% annualized rates of collapse in November and December and nearly a 30% rate of shrinkage in January 2009.


As demonstrated more fully below, those four months were ground zero of the Great Recession. They constituted a macroeconomic air pocket ignited by panic on Wall Street and in the corporate C-suites---exacerbated by the frenzied sky-is-falling machinations of Treasury Secretary Paulson and Ben Bernanke.


Stated differently, the violently collapsing Greenspan mortgage, credit and Wall Street gambling bubbles triggered four to eight months of macroeconomic freefall that no one saw coming. As late as July, the Fed minutes denied that a significant downturn was even likely in 2008, while the Wall Street stock peddlers were insisting that the goldilocks economy was alive and well.


The clueless Keynesian monetary central planners in the Eccles Building had thus fostered the first big No-See-Um Recession, but remained ignorant as to why it suddenly happened; and, consequently, doubled down on Bubble Finance policies that were destined to generate a future replay of the same.


Needless to say, that"s where we are now. The Wall Street casino has again become a coiled spring of excesses, deformations and unsustainabilities---that is, recession latencies waiting to burst.


For instance, there is no other way to describe current razor thin credit spreads in the junk and investment grade sectors alike. Central bank financial repression has fostered a relentless scramble for yield among fund managers that has caused the high yield spread to contract by more than 700 basis points from its post-recession high.


Likewise, the investment grade BBB spread at 1.32% now stands at just 29% of its June 2009 level. And since then the massive explosion of investment grade corporate debt has been concentrated in the BBB tranche of the bond market (one notch above junk), where it now comprises 50% of outstandings compared to just 25% a decade ago.


Needless to say, cheap high yield and BBB debt has had but a single major application since the post-recession recovery of the corporate bond market. To wit, it has funded trillions of financial engineering deals in the form of LBOs and levered recaps in the junk sector and massive stock purchases and dividends in the BBB sector.


So doing, these Fed-fueled financial engineering flows back into the casino have functioned to shrink the stock float and balloon the supply of speculative capital on Wall Street. At length, stock bubbles get aggravated and recession latencies intensified.


When the bond bubble finally implodes, of course, the overwhelmingly largest stock purchaser of the present bubble cycle---LBO shops and financial engineering addicted C-suites---will be forced to the sidelines. The coiled spring of financial engineering will thereupon unwind violently, triggering the next No-See-Um Recession.


And it will be self-reinforcing in a manner that is obvious, but to which the nation"s monetary central planners remain completely oblivious. That is, they continue to pronounce the "all clear" on financial instabilities and signs of incipient financial bubbles based on the alleged improved condition of bank balance sheets---especially the dozen largest mega-banks which account for 80% of deposits.


But the coiled spring this time is not in the mega-banks, but in the trillions of fixed income and high yield mutual funds and ETFs which have arisen to absorb the massive flow of corporate debt. And their liabilities are the ultimate "demand deposit", callable by investors on a moments notice and at the hint of a financial crash.


Nor is the $6.1 trillion corporate bond sector---double the $3.3 trillion outstanding in late 2007----the only coiled spring of recession latency lurking on Wall Street. The massive expansion of the ETF market since 2007 is probably even more potent as a bubble crash accelerant and therefore ignition channel for the coming No-See-Um Recession.


Outstandings have increased by 10X in the last decade and at more than $5 trillion are 3.3X the level  extant on the eve of the financial crisis. Yet in the context of a dramatic market break---whether triggered by a black, orange or red swan---they  will function as pure downside accelerants as fund managers are forced to dump their holdings in order to buy-in and liquidate the torrent of ETF shares which will be on offer.


Image result for images of the size of the ETF market


Then, too, the violent break in September 2008 occurred long before the massive "short vol" play of the present moment had metastasized in the trading pits. Yet today an estimated $1 trillion is invested in risk parity funds, double and triple inverse VIX ETFs and a menagerie of bespoke vol shorts concocted by Wall Street for its hedge fund customers.


Indeed, the current massive short vol trade is the ultimate coiled spring that will aggravate and accelerate the next bubble collapse, and thereby function as the mother of all recession latencies. Yet we are quite certain that our bubble blowing monetary central planners have given no consideration at all to this ticking time-bomb---even as they gum endlessly over the meaning of hairline noise in the BLS" latest (and useless) JOLTS report.


In this context, we do not profess to know the catalyst for the next bubble implosion, but we can readily identify the speed with which the post-Lehman collapse occurred in the stock market, and the manner in which that triggered massive restructuring actions, inventory liquidations and sweeping job cuts by the corporate C-suites.


What we do know, however, is that the financial market internals and their coiled springs of recession latencies are far more widespread and combustible than last time around. So it is worth specifying in more granular detail the recession transmission channel that operated through the corporate C-suites during the on-set of the Great Recession. The fall-winter dislocation of 2008-2009, in fact, is a roadmap for what comes next.


The S&P chart below is indexed to 100 as of September 1, 2008 and represents the eve of the Wall Street meltdown. By October 10, the S&P index was down 30% and by November 20 it closed at 58.7% of its September 1 level.


So in roughly 50 trading days the broad market lost 41% of its capitalization.


Again, that was the heart of the bubble implosion. Thereafter the market gyrated along the flatline until it hit a one-day capitulation low on March 9 at a 47% loss. So fully 90% of the capitulation low occurred during the first 50 days, and it was the speed and violence of this bubble collapse that triggered what amounted to mayhem in the C-suites.


Needless to say, the response of the corporate C-suites was swift and violent. The Challenger survey of monthly corporate layoff announcements accordingly surged during the 4-6 months that the stock market was establishing a bottom 50% below the November 2007 bubble peak.


But as will be further documented below from the BLS payroll employment data, this spree of excess payroll liquidations occurred in a very concentrated pulse and then reverted to low order clean-up until hiring growth resumed about a year after the stock market crash.


Image result for challenger monthly layoff announcement in 20o7-2009


Another measure of C-suite liquidation activity is represented by corporate restructuring charges. The latter not only capture severance expense associated with job terminations but also plant and store closures, charge-offs for bad debts and excess/obsolete inventories and numerous other categories of asset write-downs.


But it all shows up on the true bottom line---GAAP net income---which plunged to negative $15 per S&P 500 share in Q4 2008.


As shown below, that represented a negative $34 per share swing from the level of Q4 2007 and more than a 40% drop from Q4 2006. Still, the housecleaning was relatively short lived and confined to the period of maximum C-suite panic over company stock prices and option values.


Related image


The panic in the C-suites was aggravated substantially by a household sector buying strike----especially on high price tag durables and automobiles.


In fact, the drop in auto sales was spectacular: After drifting steadily lower earlier in the year, dealer sales took a further sharp plunge after August 2008. Altogether, the dollar value of sales off the dealer lots contracted by a stunning 33% before hitting bottom in March 2009.


Needless to say, the above plunge of dealer sales occurred at a time when their lots were already bulging with excess vehicle inventory. Accordingly, the production cut back at domestic assembly plants was downright brutal----with the seasonally adjusted assembly rate dropping from 9.1 million units in July 2008 to just 3.6 million units at the January 2009 bottom.


Indeed, that staggering 60% drop in six months-----which also sent GM and Chrysler into Chapter 11---represented anything but your grandfather"s economy. This was a collapsing Wall Street bubble ripping through the main street economy with malice aforethought.


The recession transmission channel through the C-suite liquidation process is starkly evident in the business inventory data and the BLS data on payroll employment change. As to the former, the chart below makes clear that business inventories had continued to build through the spring and summer of 2008, reaching a peak level of $1.54 trillion in July.


Eventually, $225 billion of that inventory (15%) was liquidated before restocking commenced in November 2009, but the key point is that more than 60% of the destocking occurred during the concentrated period of stock market collapse between September and March. The C-suite was desperately attempting to lighten the load.


Finally, the payroll data surely leaves nothing to the imagination. Nearly 5.5 million jobs were liquidated during eight months stretching from September 2008 through April 2009. That represented nearly 65% of all job losses during the entire Great Recession.


Stated differently, desperate to appease the Wall Street casino via "restructuring" actions to increase ex-items earnings,  corporate America essentially embarked on a scorched earth policy of shooting jobs first and asking questions later.


In short, there can be little doubt that Finance drives Economy in the world of monetary central planning, and that the only place to look for the next recession is in the coiled springs of Bubble Finance.


Needless to say, you can once again find them metastasizing rapidly from one end of the casino to the other; and you will also find not a single word about them in today"s swan song by our Keynesian School Marm.


Then again, Janet Yellen"s cluelessness is also why Wall Street is telling you that the macroeconomic dashboard shows nary a sign of recession, and that its safe to plunge into the casino at 110X the Russell 2000 and 280X AMZN"s miserly earnings.


Call that misdirection like never before. But also know that another No-See-Um Recession is coming right at you.


Sunday, December 10, 2017

What You"re Not Being Told About The Real Economy

Authored by Jeffrey Snider via Alhambra Investment Partners,


The year 2000 was a transition year in a lot of ways. Though Y2K amounted to mild mass hysteria, people did have to get used to writing the date with 20 in front of the year rather than 19. It was a new millennium (depending on your view of Year 0) that seemed to have started off under the best possible terms.


Not only were stocks on fire at the outset, the economy was, too. The idea of this “new economy” leading toward a permanent new plateau of low inflation growth, driven by the breathtaking productivity gains in telecommunications and computing, seemed quite real on the surface. US GDP advanced by more than 3% in 15 straight quarters from Q2 1996 through Q4 1999, averaging a sizzling 4.7% in those nearly four years of dot-com supremacy.


The labor market was clearly robust, too. In March 2000, the BLS estimates (current benchmarks) that total payrolls (Establishment Survey) rose by 468k from that February. That brought the 6-month average up to +303k, a record of expansion that also mystified economists for its lack of inflationary wage pressures. In any case, the late nineties had roared up to the doorstep of the 21st century.


We all know what happened in April 2000, as investors suddenly got cold feet about first the high flying NASDAQ. It wasn’t just stock prices and IPOs, of course, as it really meant one of the major economic themes of that age was in danger being undermined, if not thoroughly debunked. The new economy of the 21st century might not have been grounded so solidly in true economics (small “e”) as everyone thought (especially those running the Fed).


The labor market of 2000 was a study in contrasts, starting out as good as it did, but by that June, there was a shocking minus for the monthly headline payroll number. It wasn’t just a one-time problem, either, as despite all assurances in all the usual places payrolls would contract again in August and also in October. To end the year 2000, the 6-month average for the Establishment Survey had fallen to just +109k.


It was, again, a year of transition, beginning as the “sky is the limit” dot-com era and ending in almost a tailspin just two months shy of official recession. In many ways, the economy has never recovered from it, the labor market (the eurodollar’s giant sucking sound) most prominently.


Because of this and really the length of time involved between then and now, we have forgotten what a good economy actually looks like. There have been, of course, brief moments when we get the sense that something just isn’t right, such as the “jobless recovery” of 2002 and 2003, as well as the whole aftermath of the Great “Recession” up until 2014. By and large, however, the economy and the labor market are described in terms that just don’t apply if almost by default (it’s less bad today, so mustn’t it be good?).


The current payroll report for November 2017 suggests a gain of 228k. It is characterized as everything from “solid” to “robust.” Is it? How would we really know?


The best way to confirm that suspicion is to compare the current labor statistics to those in the past, calibrating the most recent numbers by those before that were recorded during what were inarguably the best of times; such as the late nineties.


Using monthly payroll gains, though, can be misleading simply because of geometric progression. A gain of 228k in November is not equivalent to the 228k gain in November 2000. The latter is actually a better single month result starting as it did from a smaller base.


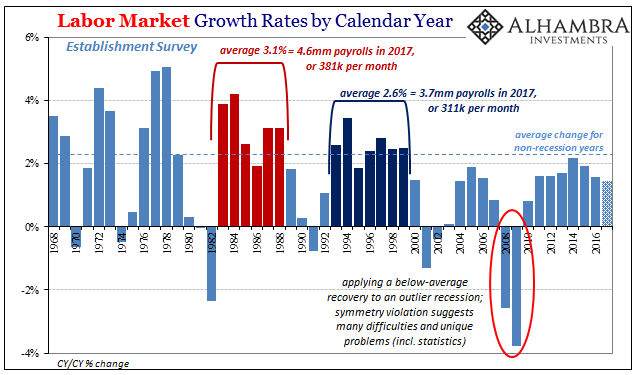
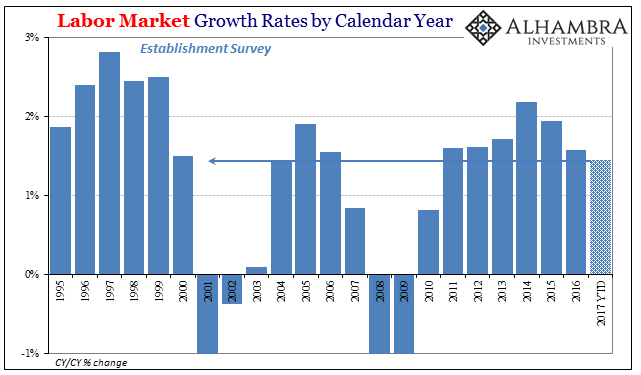
From 1993 through 1999, the labor market gained, on average, 2.6% per year according to the Establishment Survey. Since that time period is universally accepted as one featuring a strong economy, that is our standard for measurement. We can also go back to the eighties for what might amount to as an upper limit of sorts, the economy and labor market at that time being whatever is better than strong and robust – truly awesome.


Translating those average gains into the 2016 base equals an expectation of 3.7mm payrolls gained for 2017 to be as good as the nineties, and 4.6mm, which would signal a splendid economic year consistent with the eighties. Through 11 months so far up to November, the Establishment Survey gives us just 1.9mm for 2017. Assuming December turns out equal or better than November’s “good” number, the year should end with a total payroll expansion around 2.1mm, maybe 2.2mm.


That’s less than two-thirds of the way to the nineties, and significantly less than half of the eighties. This year, no matter how many months at 200k plus, has not been a good one. In fact, payroll gains in the eleven months so far tallied by the BLS’s Establishment Survey are less than those presented in that transitional year of 2000.


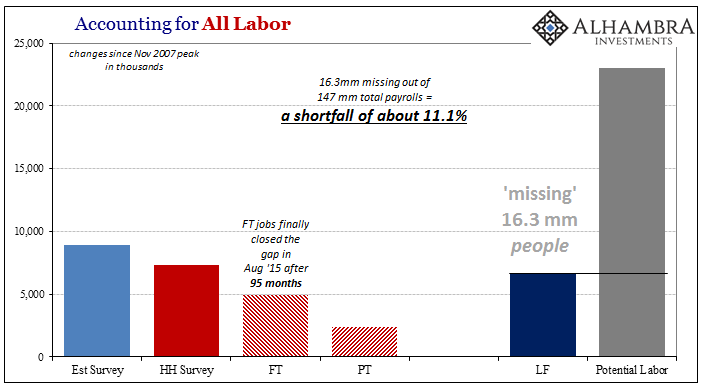
This is how you get the newest generation of American adults yearning in greater numbers for something vastly different, a radical political change if for no other reason than the establishment here continuing to say that everything is good when by every reasonable standard it isn’t even close! The “robust” labor market even of the past few years isn’t nearly enough to draw in those still sitting on the sidelines struggling, however, they do (parents’ basements) to just get along, leaving the economy instead it’s “missing” 16.3 million; a number that in a truly robust economy would be falling not rising.


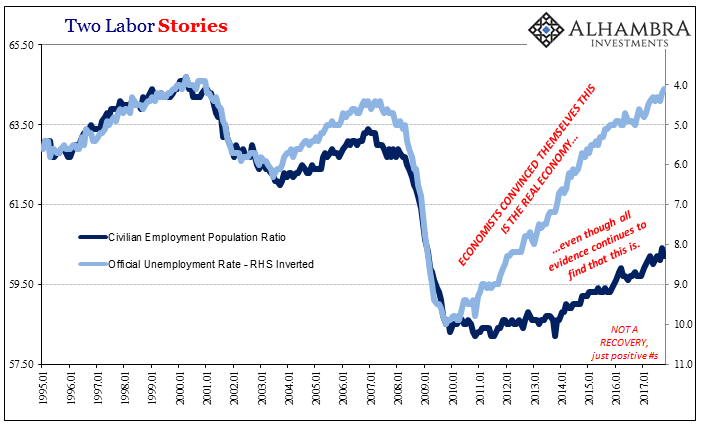
The issue clearly cannot be labor supply (Baby Boomer retirements, heroin, and fentanyl abuse in the Rust Belt) but shrunken labor demand; permanently shrunken economic demand. Therefore, there really should be no expectation for accuracy in the unemployment rate and what that means all around (inflation, baseline growth, monetary policy).


Once again in yet another month where the unemployment rate registers a ridiculous low, wages, and payroll earnings remain stuck at visibly low levels. The average weekly earnings of production and non-supervisory employees rose by just 2.6% year over year in November, after gaining 2.2% in October, 2.6% in September, and 2.7% in August. That’s nothing like in the past when the unemployment rate was where it is now. There is nothing like acceleration in earnings, not even solid growth.


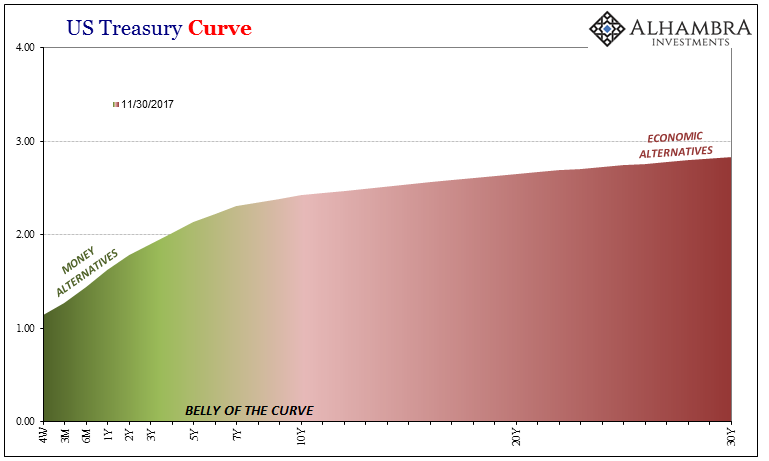
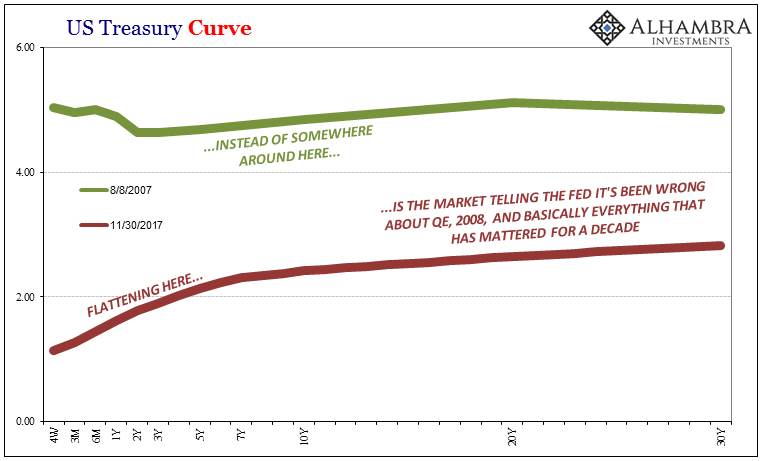
I don’t mean to make all this about the bond market every time (actually it’s appropriate), but the idea that treasuries at the long end have to be wrong has no basis other than misconception or intentional misdirection.


The data, including the BLS data, remains firmly on the side of flattening, and like the Establishment Survey’s paltry 1.9mm in 2017, it’s not even close.


David Stockman Lashes Out At Mainstream Media"s "Peak Fantasy Time"

Authored by David Stockman via Contra Corner blog,


If you want to know why both Wall Street and Washington are so delusional about America"s baleful economic predicament, just consider this morsel from yesterday"s Wall Street Journal on the purportedly awesome November jobs report.


Wages rose just 2.5% from a year earlier in November - near the same lackluster pace maintained since late 2015, despite a much lower unemployment rate. But in a positive sign for Americans’ incomes, the average work week increased by about 6 minutes to 34.5 hours in November.... November marked the 86th straight month employers added to payrolls.


Whoopee!


Six whole minutes added to a work week that has been shrinking for decades owing to the relentlessly deteriorating quality mix of the "jobs" counted by the BLS establishment survey. In fact, even by that dubious measure, the work week is still shorter than it was at the December 2007 pre-crisis peak (33.8) and well below its 2000 peak level.


The reason isn"t hard to figure: The US economy is generating fewer and fewer goods producing jobs where the work week averages 40.5 hours and weekly pay equates to $58,400 annually and far more bar, hotel and restaurant jobs, where the work week averages just 26.1 hours and weekly pay equates to only $21,000 annually.


In other words, the ballyhooed headline averages are essentially meaningless noise because the BLS counts all jobs equal----that is, a 10-hour per week gig at the minimum wage at McDonald"s weighs the same as a 45 hour per week (with overtime) job at the Caterpillar plant in Peoria that pays $80,000 annually in wages and benefits.


When the line is trending inexorably from the upper left to the lower right, of course, it means there are more of the former and fewer of the latter. Six more minutes of continuing worse----is still bad.


As a matter of fact, the November report showed 20.199 million goods-producing jobs in manufacturing, construction and energy/mining, which did represent about a 2% improvement from prior year.


The real story, however is not about the short-term monthly or annual deltas being generating by an economy barely crawling forward. Rather, at 102 months, the current business cycle is exceedingly long in the tooth by historic standards (the longest expansion was just 118 months under the far more propitious circumstances of the 1990s).


In fact, what has been the weakest expansion in history by far may now be finally running out of gas.


During the last several weeks the pace of US treasury payroll tax collections has actually dropped sharply---and it is ultimately Uncle Sam"s collection box which gives the most accurate, concurrent reading on the state of the US economy. Some 20 million employers do not tend to send in withholding receipts for the kind of phantom seasonally maladjusted, imputed and trend-modeled jobs which populate the BLS reports.


Yet we we are not close to having recovered the 4.3 million goods producing jobs lost in the Great Recession; 40% of them are still AWOL---meaning they are not likely to be recovered before the next recession hits.


Stated differently, the US economy has been shedding high paying goods producing jobs ever since they peaked at 25 million way back in 1980. Indeed,  we are still not even close to the  24.6 million figure which was posted  at the turn of the century.


By contrast, the count of leisure and hospitality jobs( bars, hotels and restaurants), or what we have dubbed the "Bread and Circuses Economy" keeps growing steadily, thereby filling up the empty space where good jobs have vacated the BLS headline total.


Thus, when goods-producing jobs peaked at 25 million back in 1980, there were only 6.7 million jobs in leisure and hospitality. Today that sector employs 16.0 million part-time, low-pay workers or 2.4X the four decade ago level.


Yes, there is nothing wrong with these jobs or the workers who hold them, but the fact that they constitute a rapidly increasing share of the mix is powerful proof that the job market is not nearly as awesome as it is cracked up to be; and that the monthly BLS report is surely no measure at all of a rising standard of living in Flyover America.


The larger point is that the monthly jobs report is really neither a report on true labor market conditions or a proxy for genuine economic growth. The fact is, without sustained growth of  full-time, full-pay "breadwinner" jobs there is no real economic recovery or progress.


And we literally mean, no progress. With an update for November"s results, the chart below would show 72.8 million "breadwinner jobs" in goods production, the white collar professions, business management and support, transportation and distribution, FIRE (finance insurance and real estate) and full-time government jobs outside of schools.


As it happens, that is virtually the same number posted by the BLS back in January 2001 when Bill Clinton was packing his bags to vacate the Oval office. In short, three presidents later---all of whom have claimed undying devotion to good jobs and rising living standards---and there is hardly a single new breadwinner job.


The above chart does not bring the concept of awesome to mind. In fact, it reminds of the same kind of stagnation that is evident in all the key metrics for real economic progress. For instance, an economy flat-out can not grow without steady gains in industrial production, which includes energy extraction and all facets of goods manufacturing from automobiles to furniture clothes, shoes and canned soup.


But like in the case of "breadwinner jobs", this so-called recovery has generated none of it. The index of industrial production stands at exactly the level of the pre-crisis peak a full decade ago.


There is a whole raft of these statistics,  but the following graph leaves little to the imagination.


Notwithstanding the Fed"s whacko claim that it hasn"t generated enough inflation in recent years, the truth is that even by the BLS" faulty measuring stick every single dollar of median household income gain has been eaten up by CPI inflation. Accordingly, there has been zero gain in real median household income for the entirety of this century!


Image result for image of real median income


What does our latest Oval Office occupant plan to do about this? Why nothing less than borrow $1.8 trillion from future taxpayers in order to enable corporations and other business to crank-out even bigger financial engineering distributions to shareholders in the form of dividends, stock buybacks and M&A deals.


This isn"t even "disruption" as per the Donald"s real job. It"s just dumb and fiscally irresponsible beyond measure - a message we have once again taken to the mainstream media in recent days.


Tuesday, November 7, 2017

JOLTS: Hiring Slides To Lowest In 6 Months As Job Openings Remain Near All Time High

After a burst of record high job openings which started in June and eased modestly in August, today"s September JOLTS report  - Janet Yellen"s favorite labor market indicator - showed another modest increase in job openings across most categories in the hurricane-affected month, with the total number rising fractionally 6.090MM to 6.093MM, above the 6.091MM estimate, resulting in an unchanged Sept. job opening rate of 4%. Still, after nearly two years of being rangebound between 5.5 and 6 million, the latest job openings number confirms that there may be a "breakout" about what was the previous resistance level, as increasingly more jobs remain unfilled in a labor market where skill shortages and labor imbalances are becoming structural.


The number of job openings was little changed for total private and for government. Job openings increased in professional and business services (+156,000), other services (+52,000), state and local government education (+36,000), and federal government (+15,000). Job openings decreased in accommodation and food services (-111,000) and information (-28,000). The number of job openings was little changed in all four regions. Now if only employers could find potential employees that can pass their drug test...


Comment on the impact from the hurricanes, the BLS said that "Hurricane Irma made landfall in Florida during September, the reference month for the preliminary estimates in this release. All possible efforts were made to contact and collect data from survey respondents in the hurricane-affected areas. A review of the data indicated that Hurricane Irma had no discernible effect on the JOLTS estimates for September."


One notable change in this report was the sharp slump in hiring, which declined by 147K to 5.273MM in September, the lowest month since April, and further reducing the hiring rate from 3.7% to 3.6% percent.


On an annual basis, the pace of hiring slowed down once again, declining to 1.8% in Sept. from 2.5% Y/Y in August, down from 3.6% in July.


The other closely watched category, the level of quits - which indicates workers" confidence they can leverage their existing skills and find a better paying job - reversed last month"s declined, and in Sept. rose from 3.093 MM to 3.182MM, suggesting workers were feeling just a little more confident about demand for their job skills than the previous month. The number of quits was little changed for total private and for government. Quits rose in  professional and business services (+82,000) and state and local government, excluding education (+10,000). Quits fell in other services (-45,000) and real estate and rental and leasing (-16,000).


And with a total 5.2 million separations (a 3.6% rate), this means that there were 1.7 million layoffs and discharges in September, unchanged from August. The layoffs and discharges rate was 1.2 percent in Sept.  The number of layoffs and discharges was little changed for total private and for government. The layoffs and discharges level decreased in wholesale trade (-30,000) and mining and logging (-7,000). The number of layoffs and discharges was little changed in all four regions.


Putting all the data in context:


  • Job openings have increased since a low in July 2009. They returned to the prerecession level in March 2014 and surpassed the prerecession peak in August 2014. There were 6.1 million open jobs on the last business day of September 2017.

  • Hires have increased since a low in June 2009 and have surpassed prerecession levels. In September 2017, there were 5.3 million hires.

  • Quits have increased since a low in September 2009 and have surpassed prerecession levels. In September 2017, there were 3.2 million quits.

  • For most of JOLTS history, the number of hires (measured throughout the month) has exceeded the number of job openings (measured only on the last business day of the month). Since January 2015, however, this relationship has reversed with job openings outnumbering hires in most months.

  • At the end of the most recent recession in June 2009, there were 1.2 million more hires throughout the month than there were job openings on the last business day of the month. In September 2017, there were 820,000 fewer hires than job openings


Finally, and perhaps most notably, the Beveridge Curve (job openings rate vs unemployment rate), appears to be gradually normalizing after a nearly decade-long "drift" from its conventional pattern. From the start of the most recent recession in December 2007 through the end of 2009, the series trended lower and further to the right as the job openings rate declined and the unemployment rate rose. In Sept 2017, the unemployment rate was 4.2% and the job openings rate was 4.0%.


Sunday, October 8, 2017

I Know What the Economy Did Last Summer Part 2: The Real Estate Rollover

A global 2017 housing bubble may be ready to collapse.

In fact, I knew what the economy did last summer before summer even began. Since the beginning of the year, I have been writing that it appeared housing was reaching a new bubblicious peak and that the real estate market was getting ready to roll over. Just before the start of the summer, I confirmed that prediction by saying that it looked like that process had begun. I anticipate it will be a slow turnover at first, just as it was in 2007, which did not reach free fall until late in 2008. Likewise, I anticipate the present decline will not reach free fall until 2018.

While housing played out about as I expected this summer (see below), the more obvious collapse right now is developing in metropolitan commercial real estate, particularly in retail space due to the retail apocalypse. Even longtime commercial real-estate mogul Sam Zell warned last week that he would not consider investing any capital in retail real estate. In Zell’s words, the real estate landscape looks “like a falling knife.”


“An area that’s in this much disarray, with so many weak players, is not an area where I would want to deploy capital at this time. And I’m generally a contrarian, and I generally rub my hands together at the opportunity for serious dislodgment, but I think what we’re dealing with here is very significant… It’s going to be very hard to take that shopping center land and redevelop it with all of these competing people having rights.” (Newsmax)


Zell sees retail’s mortal throes as a violent struggle that is going to take a few years to play out.


A second problem the commercial real estate bubble faces (and Zell describes it as a bubble in that there is way too much space dedicated to retail in the US compared to other nations), is that Chinese investors are being forced to exit, and they have been a major support to that space. In Manhattan, for example, Chinese investors have made half of all commercial real estate purchases. The Chinese government decided this summer to squeeze that dry in order to stop the flow of yuan out of the country. In London and Australia, Chinese buyers accounted for about a quarter of commercial real-estate purchases. The Chinese government is pressuring Chinese banks to stay away from these deals.


Morgan Stanley estimates that China overseas direct property investment could plunge by 84% in 2017 and another 15% in 2018. (Business Insider)


After a seven-year boom, commercial real estate prices peaked this year with July showing the first year-over-year decline. Transactional volume also declined 8% in the first half of 2017 with the second quarter turning out to be the third consecutive quarter to see year-on-year declines. Without the Chinese bellows pumping a lot of oxygen into the fire, it looks like the flame is going out.


The second US housing bubble in a decade started showing several signs of topping this summer


Exactly as predicted on this blog…


U.S. homebuilding unexpectedly fell in July amid broad declines in single- and multi-family home construction, suggesting the housing market was struggling to rebound after slumping in the second quarter. Housing starts declined 4.8 percent. (Newsmax)


While it was “unexpected” to economists, who couldn’t even see the Great Recession coming, it certainly wasn’t unexpected here. I pointed out during the second quarter that the slump back then looked like the beginning of a rollover in housing that would become more evident in the summer. July added momentum to spring’s decline; at which point, June also also got revised downward. The concurrent decline in building permits indicated the deteriorating condition of the housing market would persist.


Housing is now falling at its steepest pace since 2010. New-home sales fell even harder in July than new-home construction, crashing a whopping 9.4% month on month. That amounted to an 8.9% plunge year on year and established a seven-month low. (Economists had actually expected a 0.3% gain! I can only wonder how they came by their lame prediction.)


Then homebuilding fell again in August when a rebound in single-family home construction was more than offset by persistent weakness in multi-family home construction and when the number of permits issued for new single-family homes took yet another drop, while the permits for multi-family homes went up. In all, a mixed month.


Likewise, pending sales dropped in August, backtracking 2.6% (YoY) to their lowest since January of last year to which the chief economist of the National Association of Realtors said the housing market has been drained of all of its past year’s momentum. He attributed this in large part to home prices having risen far above incomes.


The continual decline in sales (number of houses sold) means that housing prices have to start falling again, which so far they have resisted, in order for homes to start to become affordable under rising interest rates. Affordability based on the slight rise in income over the huge rise in prices since the Great Recession is at the lowest it has been since 2008, so buyer pessimism about ever being able to afford a house is rising quickly.


With another bump in interest from the Federal Reserve anticipated by nearly everyone in December, a price decline is now inevitable as there are very few potential buyers left at current prices. Each hike reduces the number of qualified potential buyers unless prices drop or wages rise. Of course, falling prices will also mean homes start to go underwater on their mortgages. Then defaults will start to rise as a result because adjustable rates will go up some, and people who bought to flip will be underwater; everyone will be less able to refinance. The math is the same as in 2007.


The summer plunge, therefore, shouldn’t have surprised any economist, given that rising interest rates are certain to force people out of the market when wages are not rising and prices have risen a lot in many regions. Immigration is also tightening, thereby reducing the number of first-time buyers. One has to wonder how economists missed all of this. How are house-warming parties not going to come to an end when the cheap booze is taken away? Apparently economists learned nothing from the situation that created the Great Recession. Nor did politicians, for we are right back where we were in the fall of 2007.


In fact …


U.S. consumers slowed their borrowing in August to an annual pace of 4.2 percent — a pullback from a pace of nearly 7 percent over the past three years.(Newsmax)


Of course they did. How could they not? While those figures do not include mortgages, the same forces are at work in both credit markets.


Moreover …


Economists and financial markets monitor the consumer borrowing report for insights about consumer spending, a category that represents about 70 percent of U.S. economic activity.


So, how could a 40% slowdown in the annual expansion of consumer borrowing (compared to the previous three years) not be indicative of an economy that is showing some major cracks, as I had said we’d see emerge this summer?


The hurricanes’ helping hand for housing construction strikes a blow to banks and insurance


As noted in other articles, the recent hurricanes are bound to help the housing construction market, as a massive number of new homes will have to be rebuilt and old homes will have to be repaired; but economically, that doesn’t really help the economy overall (as also noted earlier). As with auto sales, the hurricanes shift the hurt from one part of the economy to another as insurance companies, banks, and the national debt all take major hits. (Banks were not fully covered by insurance on these mortgages because not all homes were in areas that required flood insurance to get a loan.)


According to Black Knight Financial Services, of the 1 million or so mortgaged homeowners in the [Hurricane Harvey] disaster area, more than 75,000 will become delinquent within two months, and 45,000 are at risk of becoming seriously delinquent or even face foreclosure inside a four-month period. (Newsmax)


[As assessments of damage continued, Black Knight updated its figures to 300,000borrowers in the vicinity of Houston (and adding Florida) could become delinquent on their loans and 160,000 could become seriously delinquent, or more than 90 days past due. And the count for Irma is still unfolding.]


If the latest figures prove out, it will amount to, at least, a 25% increase in nationwide foreclosures just from Hurricane Harvey! $700 billion in mortgage balances are at some level of increased risk in those two hurricane areas. That means the reconstruction after Hurricanes Harvey, Irma and Maria (and now unfolding … Nate) will be happening at a time when banks will be less able to make loans or, at least, lest likely, as they are entering a period of intensified strains.


I would also expect some lag between the loss of housing construction that was already underway before Harvey and the pickup in housing that will come in its aftermath. That’s because debris has to be cleared out of the way, infrastructure repaired, materials brought in, permits issued, plans made, qualified labor hired, etc.


All of this is likely to make prices rise even higher because of labor shortages and material shortages. Labor shortages, however, may mean a lot of reconstruction has to wait for a long time. (All good news if you’re a carpenter, plumber, electrician, etc.; but not if you’re not.) The downward effects of the hurricanes are likely to be far greater in the near term than any lift from reconstruction:


“With the pace of housing starts in July and August retreating, and a likely depressed September, we now anticipate that housing starts will fail to expand much, if at all, in the third quarter,” said Kristin Reynolds, a U.S. economist at IHS Markit in Lexington, Massachusetts. (Reuters)


Overall, growth in construction in the US dropped this summer to its lowest level since 2011, matching the growth level it held just before the financial crisis in the fall of 2007 — a common theme in Summer’s data.


And this last week brought another piece of data in common with that theme of reverting back to the mean of Great Recession statistics:


Wall Street was completely clueless ahead of today’s payroll, with most expecting a small positive print but two brave forecasters went so far as to predict that the recent hurricanes would result in a negative print, and sure enough, moments ago the BLS reported that in September, the US economy lost 33,000 hurricane distorted jobs, the first payrolls decline since September 2010. (Zero Hedge)


The hurricanes forced the first decline in jobs since the tail end of the Great Recession. While that’s an anomaly, it’s an anomaly that is starting to sound like a new statistical trend toward reversion.


Non-farm payroll change chart


As anticipated, none of this stopped the Federal Reserve from commencing with its great QE unwind this month.


So, three major cracks that I have been predicting all showed up this year on schedule:


  1. A significant decline in auto sales and prices and accompanying rise in auto loan defaults.

  2. A major decline in retail sales, resulting in rising defaults and mall and store closures.

  3. The start of a rollover in real estate.

(See “I Know What the Economy Did Last Summer Part 1 : Carmageddon and the Retail Apocalypse.”)


I’ll close with a summary of the summer from Jeffrey Snider that isn’t very summery:


We can’t pretend as if the economy was cooking before Mother Nature interfered. It wasn’t. If one thing has become absolutely clear about the economy in 2017, it is that it has fallen off dramatically when compared to the last half of 2016. This is the opposite of what was supposed to happen, what most people and all Economistswere expecting. The rebound off the early 2016 trough was only the first part of bigger things, or so it may have seemed. For reasons beyond the mainstream grasp, however, the farther into 2017 we go the farther away that dream seems to get.(TalkMarkets)


In my next article, I’ll review the stock market where I said I anticipate a crash sometime between the start of summer and January of 2018. While a stock-market crash has not yet begun, I allotted myself a broader window for that one, noting that central banks could easily hold the market up well beyond the start of summer now that stocks are entirely rigged by central banks … even to the point of CB’s directly purchasing certain companies that are most notably driving the market up.

Saturday, October 7, 2017

BLS Caught Fabricating Wage Data

While it"s not the first time we have observed the BLS manipulate data (the last time was in "This Is What Happens When The Bureau Of Labor Statistics Is Caught In A Lie"), never before had we actually caught the Bureau Of Labor Statistics openly fabricating data. Until now.


As reported earlier today, in one of the most closely watched statistics in today"s payrolls report, the BLS reported that the annual increase in Average Weekly Earnings was a whopping 2.9%, above the 2.5% expected, and above the 2.5% reported last month. On the surface this was a great number, as the 2.9% annual increase - whether distorted by hurricanes or not - was the highest since the financial crisis.


However, a problem emerges when one looks just one month prior, at the revised August data.


What one sees here, as Andrew Zatlin of South Bay Research first noted, is that while the Total Private Average Weekly Earnings line posted another solid increase of 0.2% month over month, an upward revision from the previous month"s 0.1%, when one looks at the components, it become clear that the BLS fabricated the numbers, and may simply hard-coded its spreadsheet with the intention of goalseeking a specific number.


Presenting Exhibit 1: Table B-3 in today"s jobs report. What it shows is that whereas there was a sequential decline in the Average Weekly Earnings for Goods Producing and Private Service-producing industries which are the only two sub-components of the Total Private Line (and are circled in red on the table below) of -0.8% and -0.1% respectively, the BLS also reported that somehow, the total of these two declines was a 0.2% increase!


Another way of showing the July to August data:


  • Goods-Producing Weekly Earnings declined -0.8% from $1,118.68 to $1,109.92

  • Private Service-Providing Weekly Earnings declined -0.1% from $868.80 to $868.18

  • And yet, Total Private Hourly Earnings rose 0.2% from $907.82 to %909.19

What the above shows is, in a word, impossible: one can not have the two subcomponents of a sum-total decline, while the total increases. The math does not work.


This, as Zatlin notes, undermines not only the labor inflation narrative, but it puts into question the rest of the overall labor data, and whether there are other politically-motivated, goalseeked  "spreadsheet" errors.


We have sent an email to the BLS seeking an explanation for the above data fabrication, meanwhile here is what likely happened: a big, juicy fat-finger error, whether on purpose or otherwise because if one looks at the finalized July weekly earnings of $907.82, it"s precisely the same as what the August preliminary wage number was as released last month, also $907.82.  For the excel fans out there, it means that the August totals were simply hard coded when the BLS shifted cells in the spreadsheet, becoming July.


Of course, if the BLS confirms that this was a transposition fat finger error, it would also imply that the August number is in fact, the September data, a rather massive mistake which today has had a impact on trillions dollars worth of assets.


Source: BLS

Friday, October 6, 2017

Goldman Raises December Rate Hike Odds To 80%

Having pointed out a glaring error in today"s payrolls report, which indicated that there was at least one math error in calculating the average hourly earnings number, and as a result casts doubt on every other piece of data released by the BLS, we urge algos and the handful of carbon-based traders, to take anything released by the BLS with a boulder of salt, especially data on wage inflation, until the BLS provides an explanation for what is going on.


Until then, here is Goldman methodically going "by the numbers", and validating the market"s reaction that sent December rate hike odds to the highest in one year, as moments ago Goldman chief economist, Jan Hatzius, revised his odds of a December hike from 75% to 80%.


Nonfarm payrolls fell 33k in September—considerably below expectations—however, we believe temporary hurricane effects likely explain all or most of the weakness. In fact, the employment report appears strong on net after taking into account hurricane effects, given the drop in the unemployment rate to a new cycle low and the upward revisions to average hourly earnings. We increased our Fed probabilities, with subjective odds of a December hike at 80% (vs. 75% previously).


And the breakdown:


  1. Nonfarm payrolls fell by 33k in September—113k below expectations—and growth in prior months was revised down by 38k on net. However, we believe temporary hurricane effects likely explain all or most of the weakness. We had previously estimated a drag of 125k from hurricane effects, and it appears to have been even larger: the BLS commissioner reported “a sharp employment decline in food services and drinking places and below-trend growth in some other industries likely reflected the impact of Hurricanes Irma and Harvey” (food service employment alone fell by 105k). Gauging the magnitude of the impact is difficult, but given the commissioner’s statement and given the sharp rise in the household “not at work due to weather” series, our working assumption is that all or most of the weakness was hurricane-related—and likely transitory. The state-level payrolls data released October 20th will provide substantial clarity on the magnitude of the impact. By industry, goods-producing industries added 9k jobs in September reflecting a rise in construction employment (+8k). Private service-providing employment fell 49k, as a 111k drop in leisure and hospitality payrolls was partially offset by growth in education and health (+27k) and trade, transportation, and utilities (+26k) jobs. Government payrolls rose 7k. The breadth of job gains weakened likely due to hurricane effects, with the payrolls diffusion index – the net share of industries adding jobs during the month – falling to 55.7% from 60.2%

  2. The household measure of employment was very strong, rising 906k in September following the 74k decline in September. The 939k gap between employment growth in the household and payroll reports was the largest ever excluding months with level adjustments to population controls. Household employment on a population- and establishment survey-adjusted basis rose only 7k, as the numbers of workers on unpaid leave from their jobs—which are included in household employment but not in establishment employment—rose by 908k (SA), presumably largely driven by the hurricanes. The unemployment rate fell in September to 4.22% from 4.44%, as the surge in household jobs more than offset the increase in the participation rate to 63.1% (from 62.9%). While the unemployment rate may in principle have been pushed down by hurricane effects (for instance if the response rate drops more among unemployed), we think this is unlikely because the BLS noted that “there was no discernible effect on the national unemployment rate” and because historically natural disasters have led to moderate increases in the unemployment rate. Another reason to doubt that the decline in the unemployment rate was due to the hurricanes is that household employment was strong (as opposed to the labor labor force being weak). The broader U6 underemployment rate fell 3 tenths to 8.3%, as the shares of marginally attached and the U3 rate fell.

  3. Average hourly earnings increased by a larger-than-expected 0.45% in September (mom), and a significant upward revision to July growth (+0.2pp to +0.5%) resulted in the year-over-year rate increased to +2.9% from a previously reported pace of +2.5% in August. While the composition effect due to the decline in the share of low-wage leisure and hospitality workers may have boosted September earnings, the upward revisions in prior months were large. Average weekly hours held steady at 34.4.

  4. Our preliminary wage tracker—which distills signals from several wage measures—shows 2.4% for Q3, up from +2.2% in Q2.

  5. We believe the headline payrolls miss is considerably less important than usual for the monetary policy outlook, because hurricanes clearly affected the data, other US growth data has been firm, and there are two more employment reports between now and the December meeting to make up for the weakness. We actually think the most important takeaway from the report was the upward revision to average hourly earnings, with wage growth now reported at just below 3%. Given this and given the drop in the unemployment rate to a new cycle low, we increased our Fed probabilities, with subjective odds of a December hike at 80% (vs. 75% previously).

Of course, if the BLS" wage growth calculation is wrong, everything changes. Until then, here"s a look at where the market-implied odds of a December hike are: not surprisingly... right at 80%.