Submitted by Gail Tverberg via Our Finite World blog,
The “Wind and Solar Will Save Us” story is based on a long list of misunderstandings and apples to oranges comparisons. Somehow, people seem to believe that our economy of 7.5 billion people can get along with a very short list of energy supplies. This short list will not include fossil fuels. Some would exclude nuclear, as well. Without these energy types, we find ourselves with a short list of types of energy — what BP calls Hydroelectric, Geobiomass (geothermal, wood, wood waste, and other miscellaneous types; also liquid fuels from plants), Wind, and Solar.
Unfortunately, a transition to such a short list of fuels can’t really work. These are a few of the problems we encounter:
[1] Wind and solar are making extremely slow progress in helping the world move away from fossil fuel dependence.
In 2015, fossil fuels accounted for 86% of the world’s energy consumption, and nuclear added another 4%, based on data from BP Statistical Review of World Energy. Thus, the world’s “preferred fuels” made up only 10% of the total. Wind and solar together accounted for a little less than 2% of world energy consumption.

Figure 1. World energy consumption based on data from BP 2016 Statistical Review of World Energy.
Our progress in getting away from fossil fuels has not been very fast, either. Going back to 1985, fossil fuels made up 89% of the total, and wind and solar were both insignificant. As indicated above, fossil fuels today comprise 86% of total energy consumption. Thus, in 30 years, we have managed to reduce fossil fuel consumption by 3% (=89% – 86%). Growth in wind and solar contributed 2% of this 3% reduction. At the rate of a 3% reduction every 30 years (or 1% reduction every ten years), it will take 860 years, or until the year 2877 to completely eliminate the use of fossil fuels. And the “improvement” made to date was made with huge subsidies for wind and solar.

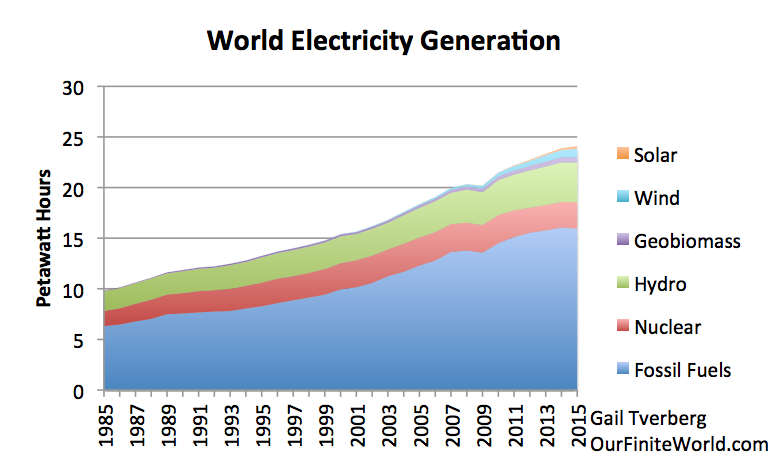
Figure 2. World electricity generation by source based on BP 2016 Statistical Review of World Energy.
The situation is a little less bad when looking at the electricity portion alone (Figure 2). In this case, wind amounts to 3.5% of electricity generated in 2015, and solar amounts to 1.1%, making a total of 4.6%. Fossil fuels account for “only” 66% of the total, so this portion seems to be the place where changes can be made. But replacing all fossil fuels, or all fossil fuels plus nuclear, with preferred fuels seems impossible.
[2] Grid electricity is probably the least sustainable form of energy we have.
If we are to transition to a renewables-based economy, we will need to transition to an electricity-based economy, since most of today’s renewables use electricity. Such an economy will need to depend on the electric grid.
The US electric grid is often called the “World’s Largest Machine.” The American Society of Civil Engineers gives a grade of D+ to America’s energy system. It says,
America relies on an aging electrical grid and pipeline distribution systems, some of which originated in the 1880s. Investment in power transmission has increased since 2005, but ongoing permitting issues, weather events, and limited maintenance have contributed to an increasing number of failures and power interruptions.
Simply maintaining the electric grid is difficult. One author writes about the challenges of replacing aging steel structures holding up power lines. Another writes about the need to replace transformers, before they fail catastrophically and interrupt services. The technology to maintain and repair the transmission lines demands that fossil fuels remain available. For one thing, helicopters are sometimes needed to install or repair transmission lines. Even if repairs are done by truck, oil products are needed to operate the trucks, and to keep the roads in good repair.
Electricity and, in fact, electricity dispensed by an electric grid, is in some sense the high point in our ability to create an energy product that “does more” than fossil fuels. Grid electricity allows electric machines of all types to work. It allows industrial users to create very high temperatures, and to hold them as needed. It allows computerization of processes. It is not surprising that people who are concerned about energy consumption in the future would want to keep heading in the same direction as we have been heading in the past. Unfortunately, this is the expensive, hard-to-maintain direction. Storms often cause electrical outages. We have a never-ending battle trying to keep the system operating.
[3] Our big need for energy is in the winter, when the sun doesn’t shine as much, and we can’t count on the wind blowing.
Clearly, we use a lot of electricity for air conditioning. It is difficult to imagine that air conditioning will be a major energy use for the long-term, however, if we are headed for an energy bottleneck. There is always the possibility of using fans instead, and living with higher indoor temperatures.
In parts of the world where it gets cold, it seems likely that a large share of future energy use will be to heat homes and businesses in winter. To illustrate the kind of seasonality that can result from the use of fuels for heating, Figure 3 shows a chart of US natural gas consumption by month. US natural gas is used for some (but not all) home heating. Natural gas is also used for electricity and industrial uses.

Figure 3. US natural gas consumption by month, based on US Energy Information Administration.
Clearly, natural gas consumption shows great variability, with peaks in usage during the winter. The challenge is to provide electrical supply that varies in a similar fashion, without using a lot of fossil fuels.
[4] If a family burns coal or natural gas directly for winter heat, but then switches to electric heat that is produced using the same fuel, the cost is likely to be higher. If there is a second change to a higher-cost type of electricity, the cost of heat will be even greater.
There is a loss of energy when fossil fuels or biomass are burned and transformed into electricity. BP tries to correct for this in its data, by showing the amount of fuel that would need to be burned to produce this amount of electricity, assuming a conversion efficiency of 38%. Thus, the energy amounts shown by BP for nuclear, hydro, wind and solar don’t represent the amount of heat that they could make, if used to heat apartments or to cook food. Instead, they reflect an amount 2.6 times as much (=1/38%), which is the amount of fossil fuels that would need to be burned in order to produce this electricity.
As a result, if a household changes from heat based on burning coal directly, to heat from coal-based electricity, the change tends to be very expensive. The Wall Street Journal reports, Beijing’s Plan for Cleaner Heat Leaves Villagers Cold:
Despite electricity subsidies for residential consumers, villagers interviewed about their state-supplied heaters said their overall costs had risen substantially. Several said it costs around $300 to heat their homes for the winter, compared with about $200 with coal.
The underlying problem is that burning coal in a power plant produces a better, but more expensive, product. If this electricity is used for a process that coal cannot perform directly, such as allowing a new automobile production plant, then this higher cost is easily absorbed by the economy. But if this higher-cost product simply provides a previously available service (heating) in a more expensive manner, it becomes a difficult cost for the economy to “digest.” It becomes a very expensive fix for China’s smog problem. It should be noted that this change works in the wrong direction from a CO2 perspective, because ultimately, more coal must be burned for heating because of the inefficiency of converting coal to electricity, and then using that electricity for heating.
How about later substituting wind electricity for coal-based electricity? China has a large number of wind turbines in the north of China standing idle. One problem is the high cost of erecting transmission lines that would transport this electricity to urban centers such as Beijing. Also, if these wind turbines were put in place, existing coal plants would operate fewer hours, causing financial difficulties for these coal generating units. If these companies need subsidies in order to continue paying their ongoing expenses (including payroll and debt repayment), this would create a second additional cost. Electricity prices would need to be higher, to cover these costs as well. A family who had difficulty affording heat with coal-based electricity would have an even greater problem affording wind-based electricity.
Heat for cooking and heat for creating hot water are similar to heat for keeping an apartment warm. It is less expensive (both in energy terms and in cost to the consumer) if coal or natural gas is burned directly to produce the heat, than if electricity is used instead. This again, has to do with the conversion efficiency of turning fossil fuels to electricity.
[5] Low energy prices for the consumer are very important. Unfortunately, many analyses of the benefit of wind or of solar give a misleading impression of their true cost, when added to the electric grid.
How should the cost of wind and solar be valued? It is simply the cost of installing the wind turbines or solar panels? Or does it include the all of the additional costs that an electricity delivery system must incur, if it is actually to incorporate this intermittent electricity into the electric grid system, and deliver it to customers where it is needed?
The standard answer, probably because it is easiest to compute, is that the cost is simply the cost (or energy cost) of the wind turbines or the solar panels themselves, plus perhaps an inverter. On this basis, wind and solar appear to be quite inexpensive. Many people have come to the conclusion that a transition to wind and solar might be helpful, based on this type of limited analysis.
Unfortunately, the situation is more complicated. Perhaps, the first few wind turbines and solar panels will not disturb the existing electrical grid system very much. But as more and more wind turbines or solar panels are added, there get to be additional costs. These include long distance transmission, electricity storage, and subsidies needed to keep backup electricity-generation in operation. When these costs are included, the actual total installed cost of delivering electricity gets to be far higher than the cost of the solar panels or wind turbines alone would suggest.
Energy researchers talk about the evaluation problem as being a “boundary issue.” What costs really need to be considered, when a decision is made as to whether it makes sense to add wind turbines or solar panels? Several other researchers and I feel that much broader boundaries are needed than are currently being used in most published analyses. We are making plans to write an academic article, explaining that current Energy Return on Energy Invested (EROEI) calculations cannot really be compared to fossil fuel EROEIs, because of boundary issues. Instead, “Point of Use” EROEIs are needed. For wind and solar, Point of Use EROEIs will vary with the particular application, depending on the extent of the changes required to accommodate wind or solar electricity. In general, they are likely to be far lower than currently published wind and solar EROEIs. In fact, for some applications, they may be less than 1:1.
A related topic is return on human labor. Return on human labor is equivalent to how much a typical worker can afford to buy with his wages. In [4], we saw a situation where the cost of heating a home seems to increase, as a transition is made from (a) burning coal for direct use in heating, to (b) using electricity created by burning coal, to (c) using electricity created by wind turbines. This pattern is eroding the buying power of workers. This direction ultimately leads to collapse; it is not the direction that an economy would generally intentionally follow. If wind and solar are truly to be helpful, they need to be inexpensive enough that they allow workers to buy more, rather than less, with their wages.
[6] If we want heat in the winter, and we are trying to use solar and wind, we need to somehow figure out a way to store electricity from summer to winter. Otherwise, we need to operate a double system at high cost.
Energy storage for electricity is often discussed, but this is generally with the idea of storing relatively small amounts of electricity, for relatively short periods, such as a few hours or few days. If our real need is to store electricity from summer to winter, this will not be nearly long enough.
In theory, it would be possible to greatly overbuild the wind and solar system relative to summer electricity needs, and then build a huge amount of batteries in order to store electricity created during the summer for use in the winter. This approach would no doubt be very expensive. There would likely be considerable energy loss in the stored batteries, besides the cost of the batteries themselves. We would also run the risk of exhausting resources needed for solar panels, wind turbines, and/or batteries.
A much more workable approach would be to burn fossil fuels for heat during the winter, because they can easily be stored. Biomass, such as wood, can also be stored until needed. But it is hard to find enough biomass for the whole world to burn for heating homes and for cooking, without cutting down an excessively large share of the world’s trees. This is a major reason why moving away from fossil fuels is likely to be very difficult.
[7] There are a few countries that use an unusually large share of electricity in their energy mixes today. These countries seem to be special cases that would be hard for other countries to emulate.
Data from BP Statistical Review of World Energy indicates that the following countries have the highest proportion of electricity in their energy mixes.
- Sweden – 72.7%
- Norway – 69.5%
- Finland – 59.9%
- Switzerland – 57.5%
These are all countries that have low population and a significant hydroelectric supply. I would expect that the hydroelectric power is very inexpensive to produce, especially if the dams were built years ago, and are now fully paid for. Sweden, Finland, and Switzerland also have electricity from nuclear providing about a third of each of their electricity supplies. This nuclear electricity was built long ago, and thus is now paid for as well. The geography of countries may also reduce the use of traffic by cars, thus reducing the portion of gasoline in their energy mixes. It would be difficult for other countries to create equivalently inexpensive large supplies of electricity.
In general, rich countries have higher electricity shares than poorer countries:
- OECD Total – (Rich countries) – 2015 – 44.5%
- Non- OECD (Less rich countries) – 2015 – 39.3%
China is an interesting example. Its share of energy use from electricity changed as follows from 1985 to 2015:
- China – 1985 – 17.5%
- China – 2015 – 43.6%
In 1985, China seems to have used most of its coal directly, rather than converting it for use as electricity. This was likely not difficult to do, because coal is easy to transport, and it can be used for many heating needs simply by burning it. Later, industrialization allowed for much more use of electricity. This explains the rise in its electricity ratio to 43.6% in 2015, which is almost as high as the rich country ratio of 44.5%. If the electricity ratio rises further, it will likely be because electricity is being put to use in ways where it has less of a cost advantage, or even has a cost disadvantage, such as for heating and cooking.
[8] Hydroelectric power is great for balancing wind and solar, but it is available in limited quantities. It too has intermittency problems, limiting how much it can be counted on.
If we look at month-to-month hydroelectric generation in the US, we see that it too has intermittency problems. Its high month is May or June, when snow melts and sends hydroelectric output higher. It tends to be low in the fall and winter, so is not very helpful for filling the large gap in needed electricity in the winter.

Figure 4. US hydroelectric power by month, based on data of the US Energy Information Administration.
It also has a problem with not being very large relative to our energy needs. Figure 5 shows how US hydro, or the combination of hydro plus solar plus wind (hydro+S+W), matches up with current natural gas consumption.

Figure 5. US consumption of natural gas compared to hydroelectric power and compared to hydro plus wind plus solar (hydro+W+S), based on US Energy Information Administration data.
Of course, the electricity amounts (hydro and hydro+S+W) are “grossed up” amounts, showing how much fossil fuel energy would be required to make those quantities of electricity. If we want to use the electricity for heating homes and offices, or for cooking, then we should compare the heat energy of natural gas with that of hydro and hydro+S+W. In that case, the hydro and hydro+S+W amounts would be lower, amounting to only 38% of the amounts shown.
This example shows how limited our consumption of hydro, solar, and wind is compared to our current consumption of natural gas. If we also want to replace oil and coal, we have an even bigger problem.
[9] If we need to get along without fossil fuels for electricity generation, we would have to depend greatly on hydroelectric power. Hydro tends to have considerable variability from year to year, making it hard to depend on.
Nature varies not just a little, but a lot, from year to year. Hydro looks like a big stable piece of the total in Figures 1 and 2 that might be used for balancing wind and solar’s intermittency, but when a person looks at the year by year data, it is clear that the hydro amounts are quite variable at the country level.

Figure 6. Electricity generated by hydroelectric for six large European countries based on BP 2016 Statistical Review of World Energy.
In fact, hydroelectric power is even variable for larger groupings, such as the six countries in Figure 6 combined, and some larger countries with higher total hydroelectric generation.

Figure 7. Hydroelectricity generated by some larger countries, and by the six European countries in Figure 6 combined, based on BP 2016 Statistical Review of World Energy.
What we learn from Figures 6 and 7 is that even if a great deal of long distance transmission is used, hydro will be variable from year to year. In fact, the variability will be greater than shown on these charts, because the quantity of hydro available tends to be highest in the spring, and is often much lower during the rest of the year. (See Figure 4 for US hydro.) So, if a country wants to depend on hydro as its primary source of electricity, that country must set its expectations quite low in terms of what it can really count on.
And, of course, Saudi Arabia and several other Middle Eastern countries don’t have any hydroelectric power at all. Middle Eastern countries tend not to have biomass, either. So if these countries choose to use wind and solar to assist in electrical generation, and want to balance their intermittency with something else, they pretty much need to use something that is locally available, such as natural gas. Other countries with very low amounts of hydro (or none at all) include Algeria, Australia, Bangladesh, Denmark, Netherlands, and South Africa.
These issues provide further reasons why countries will want to continue using fossil fuels, and perhaps nuclear, if they can.
[10] There has been a misunderstanding regarding the nature of our energy problem. Many people believe that we will “run out” of fossil fuels, or that the price of oil and other fuels will rise very high. In fact, our problem seems to be one of affordability: energy prices don’t rise high enough to cover the rising cost of producing electricity and other energy products. Adding wind and solar tends to make the problem of low commodity prices worse.
Ultimately, consumers can purchase only what their wages will allow them to purchase. Rising debt can help as well, for a while, but this has limits. As a result, lack of wage growth translates to a lack of growth in commodity prices, even if the cost of producing these commodities is rising. This is the opposite of what most people expect; most people have never considered the possibility that peak energy will come from low prices for all types of energy products, including uranium. Thus, we seem to be facing peak energy demand (represented as low prices), arising from a lack of affordability.
We can see the problem in the example of the Beijing family with a rising cost of heating its apartment. Economists would like to think that rising costs translate to rising wages, but this is not the case. If rising costs are the result of diminishing returns (for example, coal is from deeper, thinner coal seams), the impact is similar to growing inefficiency. The inefficient sector needs more workers and more resources, leaving fewer resources and workers for other more efficient sectors. The result is an economy that tends to contract because of growing inefficiency.
If we want to operate a double system, using wind and solar when it is available, and using fossil fuels at other times, the cost will be very high. The problem arises because the fossil fuel system has many fixed costs. For example, coal mines and natural gas companies need to continue to pay interest on their loans, or they will default. Pipelines need to operate 365 days per year, regardless of whether they are actually full. The question is how to get enough funding for this double system.
One pricing system for electricity that doesn’t work well is the “market pricing system” based on each producer’s marginal costs of production. Wind and solar are subsidized, so they tend to have negative marginal costs of production. It is impossible for any other type of electricity producer to compete in this system. It is well known that this system does not produce enough revenue to maintain the whole system.
Sometimes, additional “capacity payments” are auctioned off, to try to fix the problem of inadequate total wholesale electricity prices. If we believe the World Nuclear Organization, even these charges are not enough. Several US nuclear power plants are scheduled for closing, indirectly because this pricing methodology is making older nuclear power plants unprofitable. Natural gas prices have also been too low for producers in recent years. This electricity pricing methodology is one of the reasons for this problem as well, in my opinion.
A different pricing system that works much better in our current situation is the utility pricing system, or “cost plus” pricing. In this system, prices are determined by regulators, based on a review of all necessary costs, including appropriate profit margins for producers. In the case of a double system, it allows prices to be high enough to cover all the needed costs, including the extra long distance transmission lines, plus all of the high fixed costs of fossil fuel and nuclear power plants, operating for fewer hours per year.
Of course, these much higher electricity rates eventually will become unaffordable for the consumer, leading to a cutback in purchases. If enough of these cutbacks in purchases occur, the result will be recession. But at least the electricity system doesn’t fail at an early date because of inadequate profits for its producers.
Conclusion
The possibility of making a transition to an all-renewables system seems virtually impossible, for the reasons I have outlined above. I have outlined many other issues in previous posts:
The topic doesn’t seem to go away, because it is appealing to have a “solution” to what seems to be a predicament with no solution. In a way, wind and solar are like a high-cost placebo. If we give these to the economy, at least people will think we are treating the problem, and maybe our climate problem will get a little better.
Meanwhile, we find more and more real life problems with intermittent renewables. Australia has had a series of blackouts. A several-hour blackout in South Australia was tied partly to the high level of intermittent energy on the grid. The ways of reducing future recurrences appear to be very expensive.
Antonio Turiel has written about the problems that Spain is encountering. Spain added large amounts of wind and solar, but these have not been available during a recent cold spell. It added gas by pipeline from Algeria, but now Algeria has cut back on the amount it is supplying. It has added transmission lines north to France. Now, Turiel is concerned that Spain’s electricity prices will be persistently higher, because he believes that France has not taken sufficient preparations to meet its own electricity needs. If there were little interconnectivity between countries, France’s electricity problems would stay in France, rather than adversely affecting its neighbors. A person begins to wonder: Can transmission lines have an adverse impact on new electricity supply? If a country can hope that “the market” will supply electricity from elsewhere, does that country take adequate steps to provide its own electricity?
In my opinion, the time has come to move away from believing that everything that is called “renewable” is helpful to the system. We now have real information on how expensive wind and solar are, when indirect costs are included. Unfortunately, in the real world, high-cost is ultimately a deal killer, because wages don’t rise at the same time. We need to understand where we really are, not live in a fairy tale world produced by politicians who would like us to believe that the situation is under control.