Showing posts with label Market Sentiment. Show all posts

Tuesday, December 12, 2017

Gold: Isn’t the Whole Idea to Buy Low and Sell High?

Isn’t the Whole Idea to Buy Low and Sell High?


Authored by Adam Baratta


When it comes to the gold market, perhaps the old saying should be changed to “buy low and sell high-if ever.” That is likely the mentality behind gold investors at this point, as the yellow metal remains stuck in a trading range.


The gold market has some issues working against it currently. Higher stocks, a stronger economy and overall robust appetite for risk are all playing a role in the market’s current lack of upside follow through. In the absence of any fresh, bullish catalyst, gold could remain on the weaker side of the ledger going into the New Year.


Such a view is, however, dangerous as it does not really examine the bigger picture. If there were no significant reasons for gold to eventually start moving higher, the market would likely have sunk far below its recent lows by this point. Despite short sellers and others taking a bearish view of the metal currently, the market has held its ground. This is undeniably a sign of underlying strength.


Investors have an interesting tendency to view gold very differently from other asset classes such as stocks, for example. But in many ways, some of the same investment principles still apply. For example, if you were a long-term investor in Microsoft, would you rather buy shares at $25 per share or $30 per share? Obviously, buying the stock at $25 per share would be preferable, allowing the investor to potentially realize more gains if the price goes up while also possibly making better overall use of investment capital.


The gold market is no different in this regard. While many investors seemingly want to wait and see the market moving higher before taking action, the savvy investors realize that the old notion of buy low and sell high still applies. This is exactly why the market has not been able to really breakdown-the buyers have met and neutralized any significant selling pressure.


For the investor that is interested in value, and is taking more of a long-term view rather than a short-term view, the current range in the gold market could represent an excellent long-term buying opportunity. The market has shown time and time again that it has the ability to move sharply higher in a short period of time, and the next upside breakout could see such price action once again. Would you rather buy gold at $1250 per ounce or $5000 per ounce?


Now is the ideal time to add to a gold portfolio, and if you don’t already have an allocation in this key asset class, now is the ideal time to get started.


Adding physical gold to your holdings has never been easier than it is today, and you can get started by simply picking up the phone. Speak with an Advantage Gold account executive today about the potential benefits of gold ownership. Our associates are here to answer any questions you may have, and can even show you how to make this asset class a key part of your portfolio using an IRA account.


 Read more from Adam at Advantage Gold


Saturday, November 25, 2017

"You Are Here": Citi"s Stunning VIX Chart

Something snapped in the VIX complex, seconds after Friday"s early close, sending it to a new record low of 8.56 at 13:00:14 ET...


... which as we showed yesterday, was less than 10% of the all time VIX high of 89.53, hit on October 24, 2008.


However, while the Friday VIX snap - which is still on the feeds and thus wasn"t a fat finger error - is yet another indication of just how broken, and/or how overrun by vol sellers the market is, below we present two even more striking, longer-term perspectives on the VIX courtesy of Citi.


As Citigroup notes, even after the recent backup, the VIX index is in its 0.5th percentile – that is, historically it has been wider than currently on 199 out of every 200 days. In other words, the "you are here" on the chart below has never been more to the left.


But it is not just a question of having reached this low level of implied volatility. As much as anything it is about the extended period of time we seem to be spending there.


Which brings us to one of the most striking VIX charts we have seen: as Citi"s strategists note, over the last six months, VIX has spent more than 40 days below 10. Putting this staggering outlier in context, the index has never managed to accumulate more than 6 days that low, measured over the same time interval, over the last 30 years. Or, as today"s central bankers would say after one look at the chart below which they have created "perfectly normal."


Commenting on the above charts, Citi, which has turned increasingly bearish on credit in recent weeks, says that "implied vol is, in other words, sailing in the same unchartered waters as corporate credit", and concludes sarcastically, "why buy vol if you believe that any selloff is impeded by a central bank backstop?"


Why indeed?


So keep selling vol until one day vol finally explodes as CBs lose control, wiping out trillions in fake wealth in the process; just please don"t use the words "market" and "price discovery" until that happens.


Monday, November 20, 2017

Is Financial Argmageddon Bullish For Stocks? One Bank"s Surprising Answer

Everyone knows that after nearly a decade of capital markets central planning by the world"s central banks, "good news is bad news." But did you also know that financial armageddon has become the most bullish catalyst to buy stocks? That"s the understated take-home message from the year ahead preview by Macquarie"s Viktor Shvets published last week. It is also the conclusion that One River Asset Management"s Eric Peters reached in his latest weekend notes.


While we will have much more to comment on Macquarie"s rather macabre 2018 preview, which is arguably one of the most honest, comprehensive, and objective predictions of what to expected from the "central bank/market confidence boosting nexus", we will highlight the one argument that has served to promote countless BTFD algo-driven stock rips, summarized in the following blurb, which is a sublime explanation by Viktor Shvets the worst things are, the more you should buy:


If volatilities jump, CBs would need to reset the ‘background picture’. The challenge is that even with the best of intentions, the process is far from automatic, and hence there could be months of extended volatility (a la Dec’15-Feb’16). If one ignores shorter-term aberrations, we maintain that there is no alternative to policies that have been pursued since 1980s of deliberately suppressing and managing business and capital market cycles. [T]his implies that a relatively pleasant ‘Kondratieff autumn’ (characterized by inability to raise cost of capital against a background of constrained but positive growth and inflation rates) is likely to endure. Indeed, two generations of investors grew up knowing nothing else. They have never experienced either scorching summers or freezing winters, as public sector refused to allow debt repudiation, deleveraging or clearance of excesses. Although this cannot last forever, there is no reason to believe that the end of the road would necessarily occur in 2018 or 2019. It is true that policy risks are more heightened but so is policy recognition of dangers.


We therefore remain constructive on financial assets (as we have been for quite some time), not because we believe in a sustainable and private sector-led recovery but rather because we do not believe in one, and thus we do not see any viable alternatives to an ongoing financialization, which needs to be facilitated through excess liquidity, and avoiding proper price and risk discovery, and thus avoiding asset price volatilities.


Translation: central banks remain trapped by the mountain-sized bubble they have blown with years of QE and ZIRP/NIRP, and once volatility returns, and risk assets plunge, CBs will have no choice but to scramble right back and prevent the pyramid from keeling over and undoing a decade of fake "wealth creation" which was pulled from the future to the tune of $15 trillion in central bank asset purchases, which while still rising is about to go into reverse in just over a year"s time.


If that"s not enough, here is One River"s Eric Peters, with the exact same conclusion:


Anecdote


“The market has an accident, the Fed returns to QE, slashes interest rates, bonds surge, stocks recover,” said the CIO, high atop his prodigious pile, alone. Staring into the distance. Squinting, straining.


“The correlation between bonds and equities remains negative, the risk parity equity/bond portfolios are dented but not destroyed. And we descend to the next lower level in real interest rates. US bond yields turn negative. In essence, we prolong the paradigm that has driven markets for a few decades.”


Far below, economies hummed in harmony, capitalists collecting their expanding share. “A continuation of this paradigm is what everyone believes. And I just doubt that outcome so sincerely.” Hidden within the distant economic whir, labor strived, struggled. Their wage growth anemic, their children indebted, career prospects uncertain.


“It has taken time, but the political context for a regime shift is now established; populism is evident in recent elections. And the academic context for a seismic economic policy shift is in place too.”


The extraordinary response to the global financial crisis prevented depression. But the price of salvation is proving to be as profound as it is impossible to precisely measure -- unexpected election outcomes, political paralysis, an isolationist America, de-globalization, fake news, opioid epidemics.


And connecting it all, a corrosive, woven thread; injustice, unfairness, inequality, hypocrisy, distrust, endemic, growing. “We are on the cusp of great change, the old paradigm is set to shift,” he said, at altitude, the air crisp, clear.


“The market has an accident, monetary policy is seen to be bust, the models have been wrong, we have to change what we do, we can’t go down the same route, we need to move to a different policy mix. Fiscal expansion, infrastructure, labor over capital. We’re moving to something that may be great for the economy, but no good for asset markets. New Regime -- end of story.”


Friday, November 17, 2017

Despite Massive Liquidity Injection, Chinese Stocks, Commodities Head For Worst Week Of Year

The PBOC stepped up cash injections this week, suggesting authorities are trying to shore up financial markets as a selloff in bonds spreads to equities... but it is not working!


As Bloomberg reports, the central bank has already added a net 510 billion yuan ($77 billion) via open-market operations into the financial system this week, matching the third biggest weekly injection this year.


But, it is not enough...


While bonds did stabilize - managing to avoid closing beyind the crucial 4.00% level...


Stocks did not...


As they head of the worst week in 7 months...


And commodities are getting clobbered...


“The increase in cash additions will help soothe market sentiment,” said Qin Han, chief fixed-income analyst at Guotai Junan Securities Co. “But the decline will not be reversed, as the market’s biggest concern is not tight liquidity but tougher financial regulation.”


Friday, November 10, 2017

Sweet melt up potential here says Joe Friday


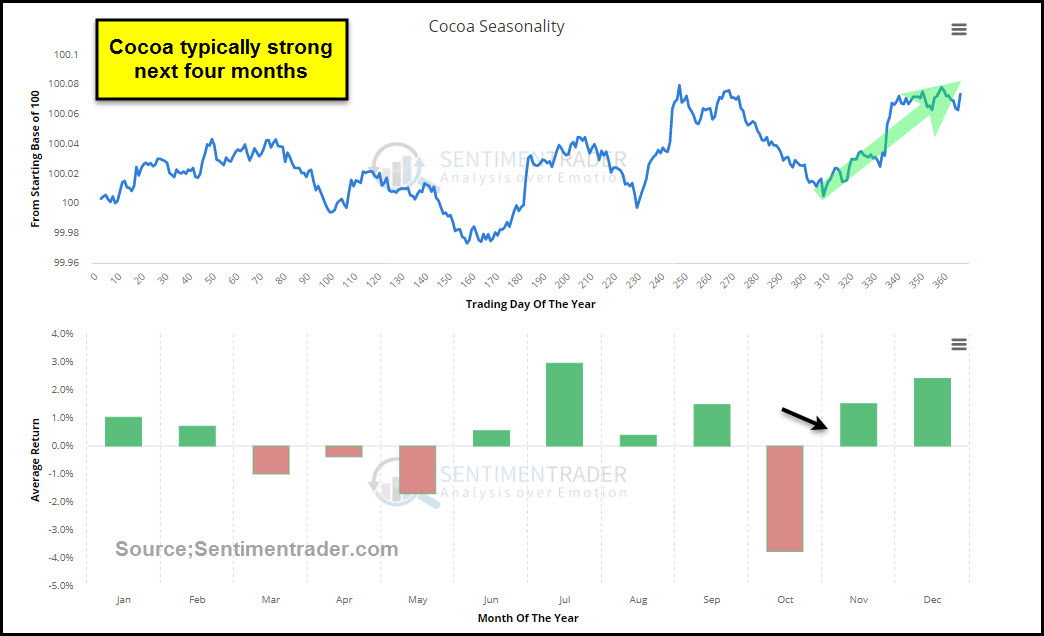
Tis the season for Chocolate (Cocoa) to do well, will it repeat its historical pattern again this year?


Below looks at the seasonal pattern of Cocoa from Sentimentrader


CLICK ON CHART TO ENLARGE


Going into this period of seasonal strength, Cocoa bulls of late are hard to find and dumb money traders have established one of the largest short positions in this commodity in years. The triple combo could make the price action of this commodity very interesting going forward.


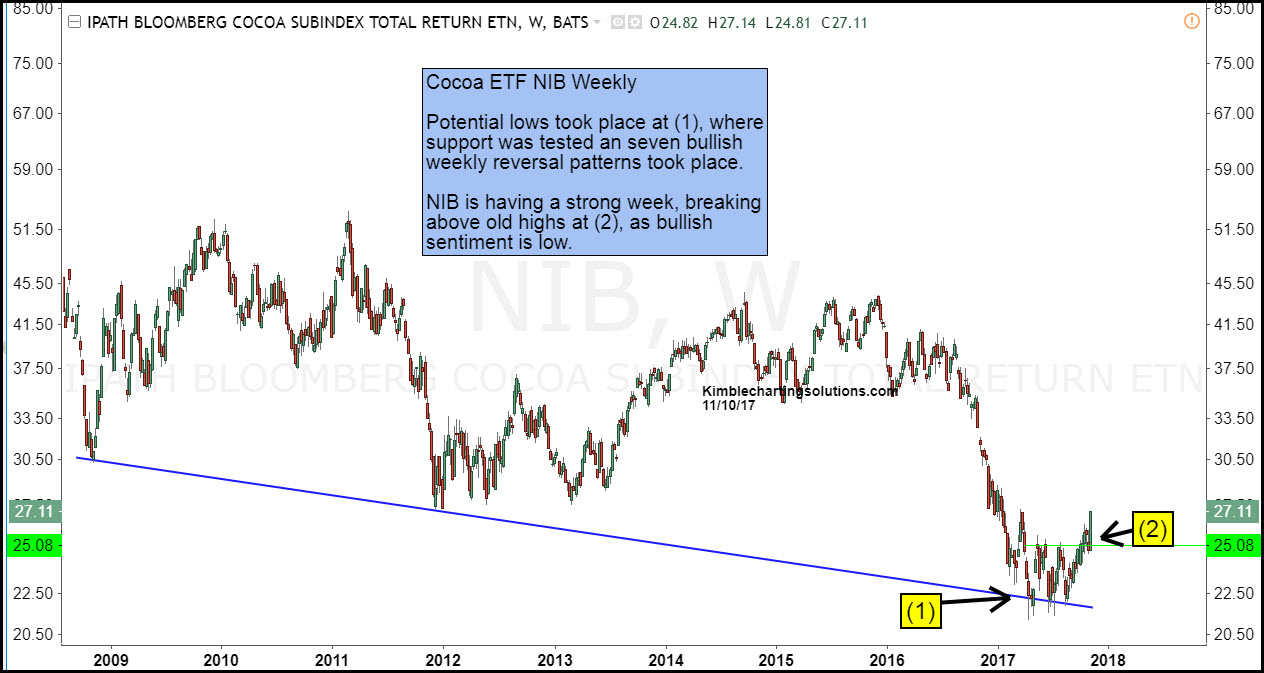
This commodity can be played in the futures markets or two different ETF’s (NIB & CHOC). Below looks at NIB


CLICK ON CHART TO ENLARGE


Cocoa ETF NIB could have built a base at, where seven different bullish wicks (reversal wicks) took place just above 10-year support at (1). Of late NIB has been moving higher and this week looks to be breaking above highs hit earlier this week at (2).


A nice combo of pattern, sentiment and traders positions is in play in this asset that is down nearly 50% in the past couple of years.


Some perspective- since the first of this month, NIB has gained over 7%, which is nearly half of what the S&P has done year-to-date.


Full disclosure Premium and Sector members have been long NIB since the end of October. If you would like to become aware of these type of pattern and sentiment setups, we would be honored if you were a member.


Why you see chart pattern analysis with brief commentary:   There is a ton of news and opinions about markets and stocks that make the decision-making process more difficult than it needs to be.   


I believe the Power of the chart Pattern provides all you need to see what is taking place in an asset and determine the action to take. 


This approach has worked well for me and our clients and I encourage you to test it for yourself.


Receive my free research posted on the blog daily here 


Or,  send an email if you would like to see sample research and take me up on a trial of my premium or weekly research where I provide actionable alerts on breakouts and reversals in broad market indices, sectors, commodities, the miners and select individual stocks 


Email services@kimblechartingsolutions.com  


Call us Toll free 877-721-7217 international 714-941-9381 


Website: KIMBLECHARTINGSOLUTIONS.COM 


follow on Twitter 


See our latest webinar


Monday, October 30, 2017

Global Macro "Reality" - The Hopium Vs Doomium Model Explained

Authored by Peter Tchir via Academy Securities,


When Reality and Sentiment Diverge


The Hopium versus Doomium Model


We are initiating the Hopium vs. Doomium model today.  I first came across the word Hopium in the aftermath of the financial crisis.  It was typically used by ‘doomers’ who believed markets were far ahead of themselves and were betting on hope rather than reality.


This model attempts to pit what I view as reality versus what view as sentiment.  The scoring system is partly objective (technical indicating overbought or oversold, fund flows, positioning reports, etc.) and partly subjective (largely me trolling the media and social media trying to uncover true sentiment shifts).


What this is meant to do, is to identify opportunities where sentiment and reality diverge.  If sentiment and reality are roughly lined up, then there is no obvious trade to me, but when one is very different than the other, we can identify underweight or overweight opportunities (or even long vs short ideas depending on your mandate).


Macro Hopium/Doomium


VIX


Let’s start with volatility, or more specifically, the VIX index.  It briefly spiked above 13 on Wednesday as global bond selling, concerns about the next Fed Chairperson and even some pre-earnings anxiety swept through the market.  It finished the week at 9.8 which was lower than where it closed the prior Friday.  VXN, a measure of the Nasdaq volatility, also dropped significantly as the Nasdaq composite surged more than 2%.


I do believe that the biggest risk facing the market is a spike in correlation and volatility – but I don’t see that risk as very high right now.  I have VIX showing up as barely in the green – meaning it might be a buy, but it isn’t that compelling.


Reasons VIX can stay low


  • Seasonality.  With fewer trading days as we start the U.S. holiday season can often push VIX lower.  There have been instances, like the fiscal cliff and around elections, that hasn’t been the case, but anyone looking to buy VIX must take seasonality into account.

  • Expectations for Tax Reform in 2017 are low.  Anything short of killing all possibility of tax reform is likely to be largely ignored by the market.  The market does expect Tax Reform, but not until early next year.  So long as it looks like it is grinding towards that conclusion, there is little need for markets to react – keeping VIX low.  Any setback that can be framed as ‘negotiations’ will be muted.  I am not sure what will constitute derailment, but I suspect we will know it if we see it.

Surprisingly Nervous Volatility Sellers


  • No Rush to Sell VIX.  When VIX dropped into the close on Wednesday I expect to see large inflows into the short VIX ETFs and ETNs.  When VIX spiked in August, we saw extremely large inflows into those stocks.  We didn’t see anything like this, which is an indicator that the sellers of volatility are more cautious here, which as a contrarian, means there is less likelihood of a VIX spike.

SVXY Shares Outstanding Aug vs Oct


We did see a significant reduction in shares outstanding in UVXY – an ETF that is double long the VIX short term futures index.  It looks like either profit taking, or more accurately, investors happy to get out with less of a loss than they had, but nothing so dramatic to indicate volatility bulls (market bears) have given up yet.


From a technical standpoint, the VIX futures curve is relatively flat.  The 3rd VIX futures contract (January) closed at 13.35 versus the 1st VIX futures contract (November) which closed at 11.45.   That spread of 1.9 is almost exactly the average for the year between the 3rd and 1st VIX futures contract (UX3 vs UX1 are the tickers on Bloomberg).


Geopolitical Tail Risk


  • VIX has responded most violently to increased geopolitical risk.  More than any other asset class, VIX has responded when geopolitical risk has increased.  Academy Securities hosted a client conference call on October 18th (replays are available) where Major General (retired) Spider Marks analyzed the White House Chief of Staff’s assertion that the North Korea threat is ‘manageable’ and largely agreed with that assessment.  We will update you as our views on current geopolitical risk evolve, but in the meantime, for those concerned about it, the best hedges are either VIX call options of long dated European Sovereign Debt – which leads us to our next asset classes.

Bunds and Treasuries


As of the initial writing of this report, I do not know who President Trump will name as next Fed Chairperson, but like everyone else, I await that decision as it should provide some clarity.  I view that while there will be an initial price reaction to any decision, the market will quickly rule out the possibility of a major change in policy.  The reality is that the head of the Fed is virtually forced to be dovish.  If they are dovish and the economy does well – they are lauded.  If they are dovish and the economy does poorly – they can just get even more dovish.  The only thing that really hurts them, is being hawkish and the economy slowing.  Why risk that?  Draghi didn’t risk that this week!


I continue to view Treasuries as a good candidate to be underweight as my ongoing target for the 10-year treasury is 2.60% with a chance of briefly spiking above that.  The fundamentals for treasury investors are poor – improving economic data, D.C. trudging its way towards a near term deficit increasing tax plan, etc.  There seems to be more denial in the bond market than the equity market on the potential for sustained economic growth. 


I struggle with the positioning of the bond market as many surveys indicate extreme bearish positioning, yet I find relatively few bears and a disproportionate number of bulls – who are bulls because everyone else is bearish – despite my inability to find that overwhelming bearish community.


Draghi does it again – crafting every action to be as dovish as possible.


German 10 Year Bund Yields


Bunds bounced right at the 0.49% yield level again.  That is the 4th time this year that bunds have failed to rally though that level.


While it is hard to like European yields here, they are universally hated.  That puts them into the ‘yellow’ or neutral area – at least until some more of the short positions are closed post Draghi.


It is difficult to disentangle emotions from true market impact regarding what is occurring in Spain and Catalonia.  The headlines and images are awful, but it is difficult to form a direct and near-term path that impact all European markets, let alone global markets.  It needs to be watched and while the market’s muted reaction may ‘feel’ wrong, it seems correct from a trading viewpoint.


Bunds (and other high credit quality EU Sovereign Debt) can provide excellent protection from North Korean Geopolitical risk.  Any risk-off trading emanating from Korea should help sovereign debt yields, but should also strengthen the Euro versus the Yen and versus the Dollar – adding an extra kicker to those bonds.


Dollar Weakness


DXY, a dollar index has rebounded sharply since threatening to break through multi-year lows in early September.  While there is nothing that changes my view that this administration wants a weaker dollar and is capable of jawboning it down, the clear diversion between a Fed that seems intent on hiking and an ECB that figured out how to renew its dovish bias, could support the dollar.  


DXY Bounce on Support & Retakes Moving Averages


DXY broke the 100-day moving average last week as it closed at 94.9.  That puts the 200-day moving average of 96.9 as a possible target.  The model is biased towards weaker dollar, but with very limited conviction.


Domestic Stocks


After last week’s surge, both U.S. Large Cap and U.S. Small Cap stocks looked stretched.  Sentiment is clearly high for both groups by virtually any measure, but the fundamentals seem to warrant the valuations here.  If something occurs to really disrupt the Tax Reform than look for significant pullbacks as that would dramatically shift the fundamental outlook.


Credit


Boring.  Not sure that I can put a better description than boring on the overall credit market.  Individual companies and sectors are exhibiting some idiosyncratic risk, but overall, risks and rewards seem balanced.  Credit spreads are tight, but with the global economy marching along and volatility suppressed – there is little need for credit spreads to widen.  In fact, while equities are hitting all-time highs, credit spreads are still above their pre-crisis lows.


Tax Reform can create some winners and losers – especially once Washington decides what to do, if anything, about the deductibility of interest expenses.  


I will run a full Fixed Income Hopium/Doomium Report on Tuesday where we will delve deeper into the fixed income markets while drilling down into high yield, investment grade, bonds versus loans, structured credit, etc.


Oil


For much of the year, I had a range on oil of $40 to $55, but I think we could support higher oil prices here.  Sentiment does seem bullish, but may be behind the bullish case.  I have a bias towards domestic energy companies – equities and high yield bonds – as there is still an undercurrent in Washington that wants to focus on energy selfsufficiency.  Tax Reform and Decreased Regulations should help these companies, especially if it releases any pent-up demand for M&A activity (high yield bonds tend to do better than IG bonds during periods of M&A and the high yield energy bonds could do very well if we get that combination of higher prices and reduced regulation.


Gold and Bitcoin


I always have trouble with sentiment for gold and that is even more true with Bitcoin (or cryptocurrencies in general).  How do you create a sentiment when one portion of the world sits on ‘fraud’ and another portion of the world sits on ‘greatest thing ever.’  For gold, I find I have to sort through the barbaric relic crowd and the evangelists to derive a reasonable market view of sentiment – and Bitcoin forces me to do that exercise on steroids.


I think gold is losing its luster as a hedge.  Yes, it is something many talk about and own.  In fact, there are people that I know well and respect that advocate for a 5% to 10% holding of gold – ideally in physical form.  That may make sense, but lately gold does seem to be responding less dramatically than cryptocurrencies.  Whether it is lack of portability or that it just isn’t the new kid on the block – it really doesn’t seem to perform like you would expect – it lagged both VIX and Bitcoin when the situation in Korea became more concerning back in August.


I think at some level Bitcoin is syphoning demand from Gold.  Some portion of money that used to at the margin, buy gold on geopolitical concern, now buys cryptocurrencies (the vast majority just buys long dated sovereign debt as their geopolitical risk hedge because not only has it worked lately, you get paid to hold it – part of my ongoing theme of the popularity of Risk Parity Lite).


Bitcoin is slowing attracting new users as the price attracts attention, as it demonstrated its ability to navigate China’s crackdown and it is becoming easier to own (Coinbase, I have been told by several knowledgeable people, has made it much easier to transact).  If any ETF is eventually launched, that should create yet another wave of demand as it is easier to purchase.  The purists will scream that owning it in ETF form misses the point, but the gold purists scream about physical too, and it hasn’t stopped GLD from being highly successful.


Longer term, I have no idea where Bitcoin and cryptocurrencies will head – I do believe there will be more attempts from government authorities to crack down on it, but near term, I think it is gaining traction and is something that comes up in virtually every conversation I have that last more than a few minutes.
As a caveat, I want to highlight that I do live by my 3 Rules of Bitcoin and I don’t find it paradoxical that rule number 2 is that there are no rules – it just makes analyzing it more difficult.


Bottom Line


Relatively few obvious trades out there, at least as generated by this model.  I really want to see outliers and as much as I stare at this, it is currently difficult to identify outliers.


Short treasuries and short USD might be an interesting pair.


Long oil versus short gold would need some additional work, but is another possibility. 


Own some VIX calls – it hasn’t worked, and I would wait to see sentiment get a bit more extreme on the ‘volatility is dead’ side of things before entering.


As mentioned earlier, I will do full update on the fixed income and credit side of things for Tuesday and will add some additional Macro Asset classes in the coming weeks as I rebuild my models.


Short


Friday, October 27, 2017

Keeping A Close Eye On Momentum In The US Equity Market

Authored by Steven Vanelli via Knowledge Leaders Capital blog,


Over the last 20 days, the US equity is showing early signs of exhaustion, and momentum is beginning to weaken.


In the following charts, we’ll highlight the various technical measures we calculate each day to illustrate the early turn in momentum. Our KLSU DM Americas Index represents the top 85% market-cap of the US and Canada.


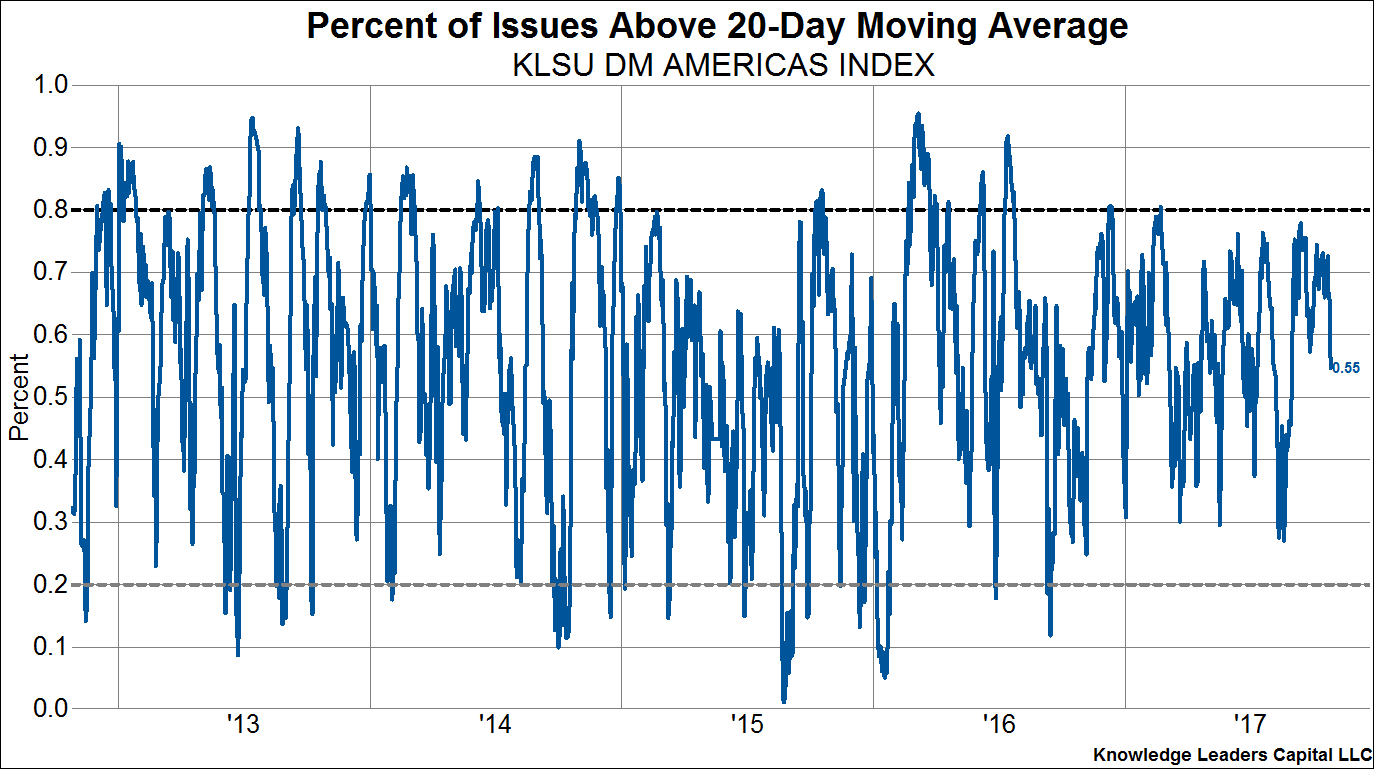
First, after peaking near 80% above the moving average a month ago, now only 55% of stocks are above their own 20-day moving average.


Second, the number of new 20-day lows is picking up. A month ago, only about 2% of North American stocks were making new 20-day lows. Now, the figure is 19%.


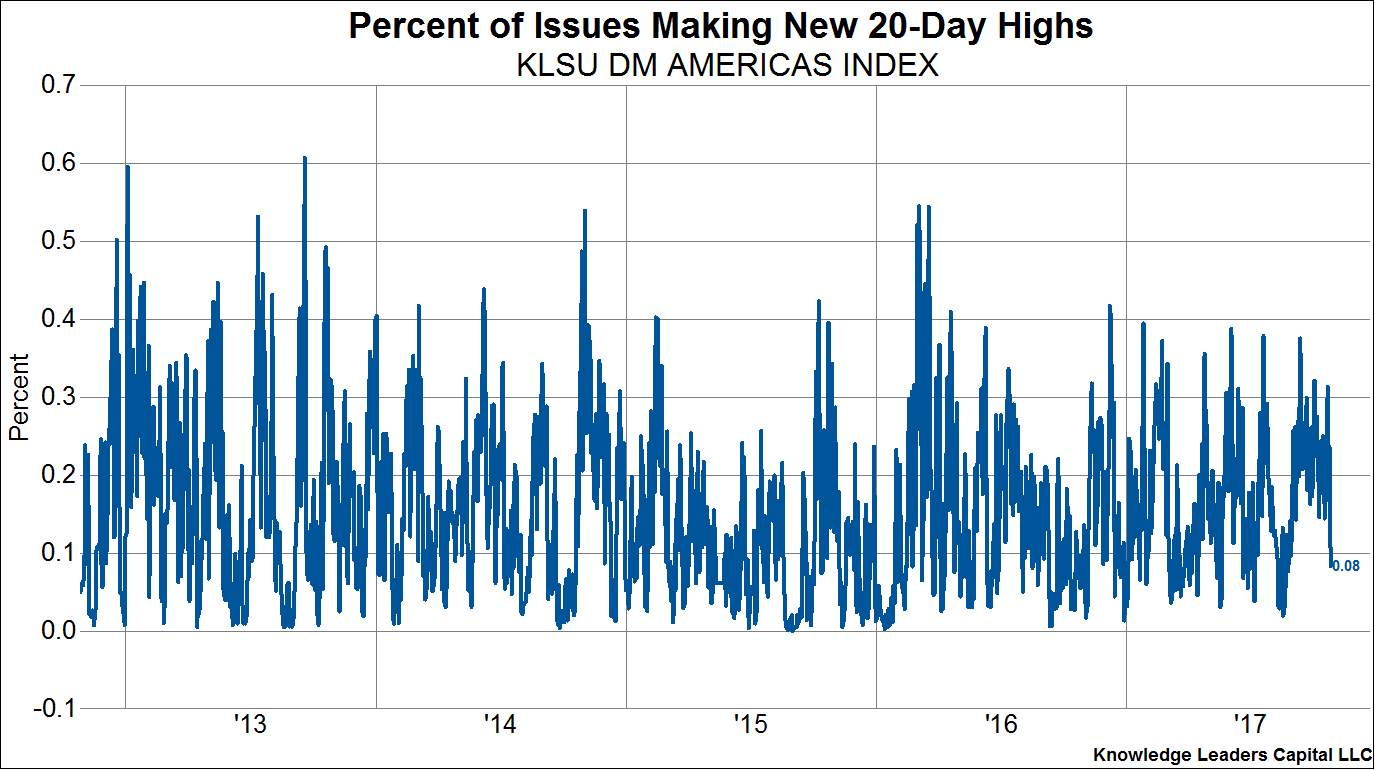
Similarly, a month ago 30% of North American stocks were making new 20-day highs. As of yesterday, only 8% are now making new 20-day highs.


Third, we measure the advance/decline ratio on a daily basis. The A/D ratio for North American equities has deteriorated from about 1.75 a month ago to about 1.31 currently.


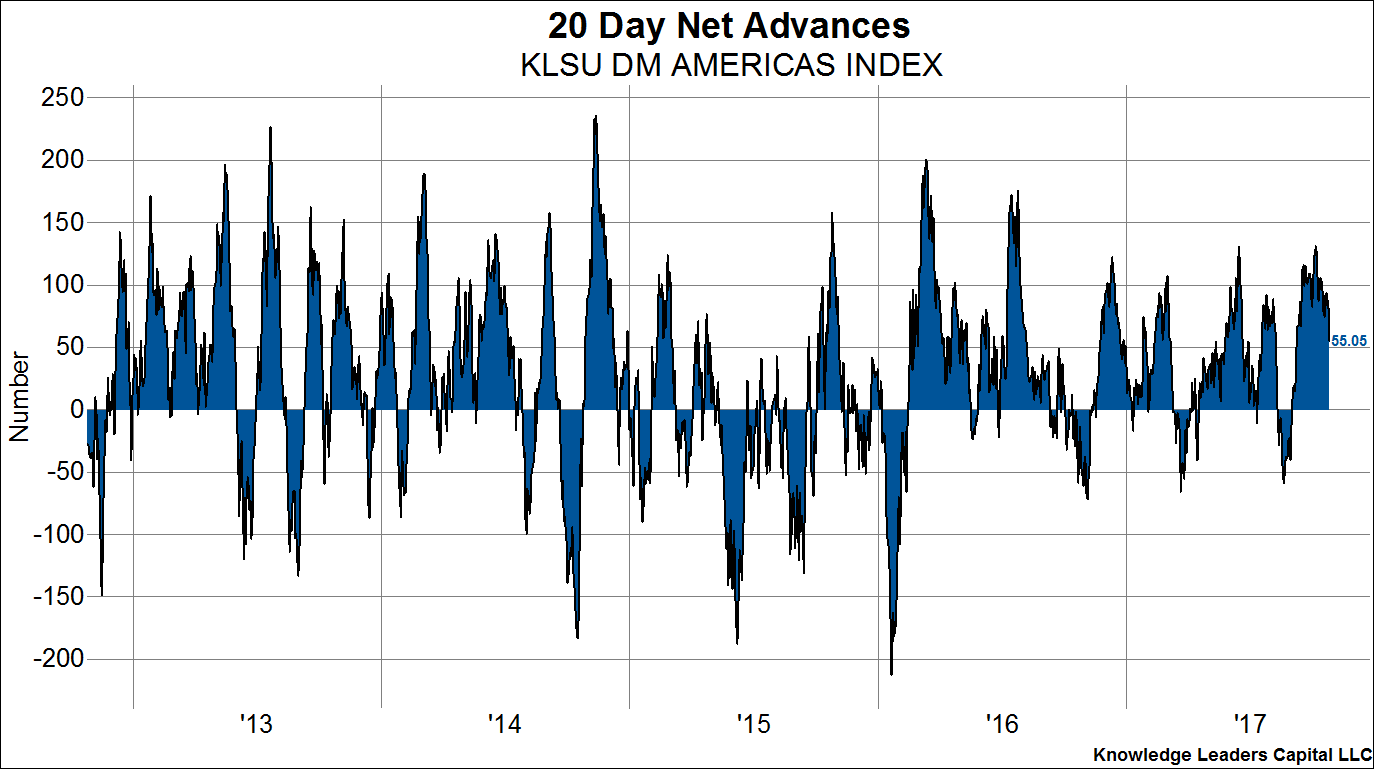
Fourth, we measure the number of net advancing stocks. We take the number of stocks up in a day and subtract the number of stocks down. A month ago, net advances were a bit over 100 for the trailing 20 days. We have slid to 55 net advances as of yesterday.


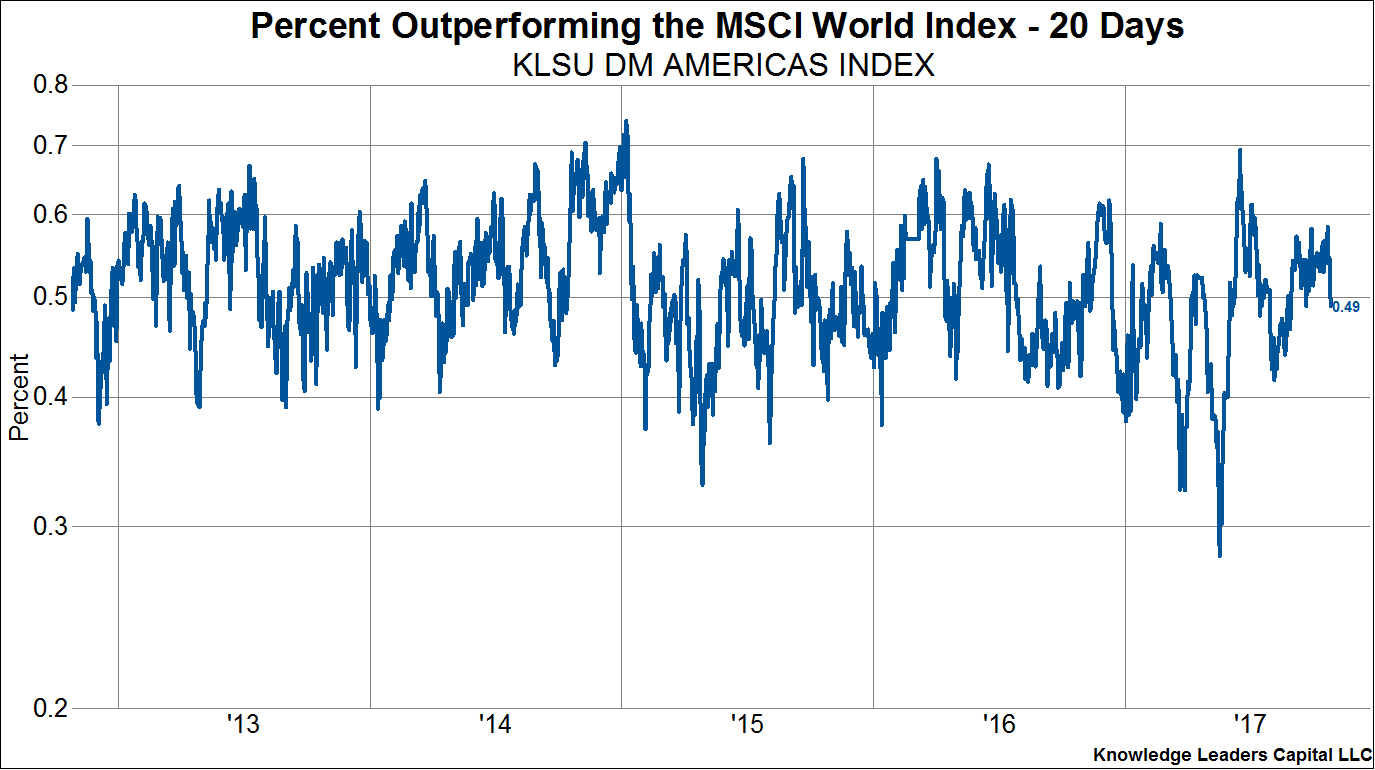
Fifth, we calculate the percent of stocks that are outperforming the MSCI World Index. A month ago just under 60% of all North American stocks had outperformed over the previous 20-day period. As of yesterday, only 49%, less than half the constituents, have outperformed the MSCI World Index over the last 20 days.


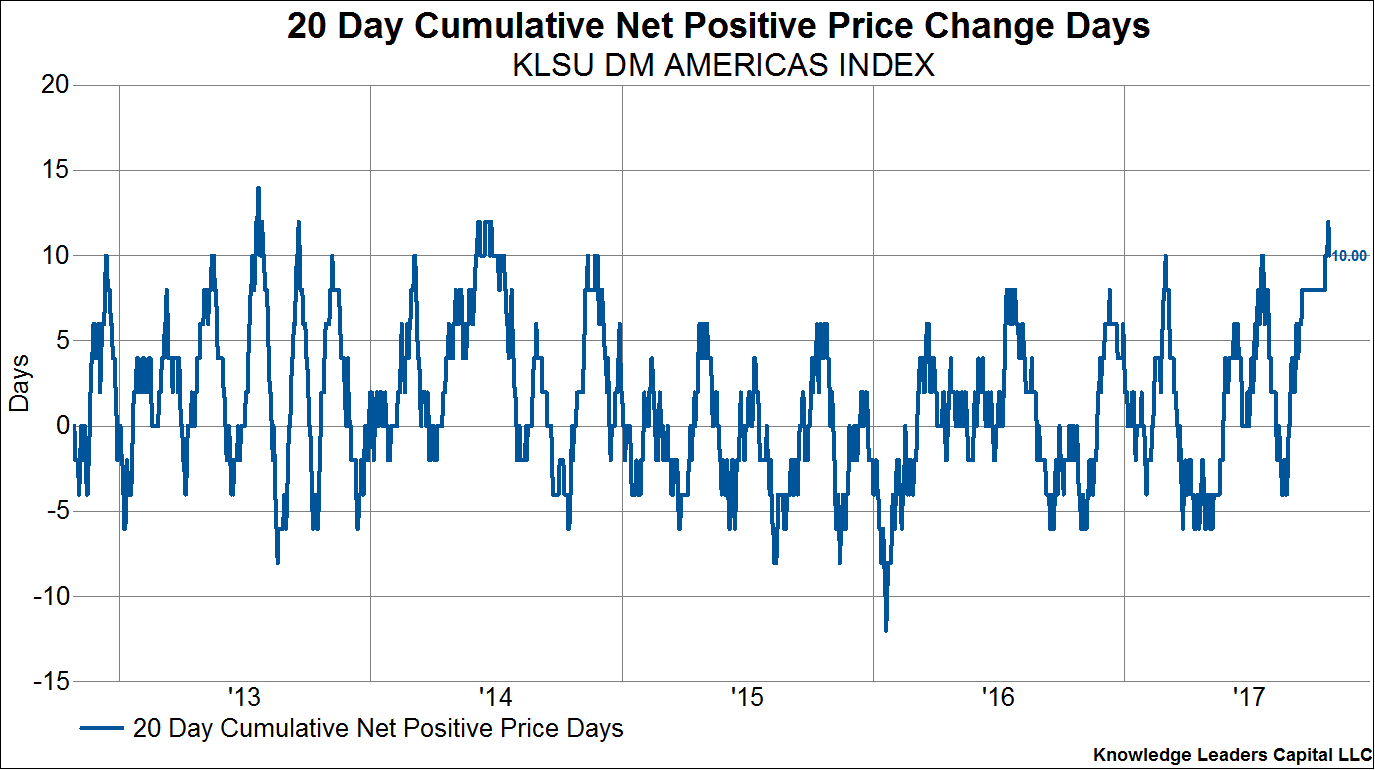
Sixth, we calculate the number of days stocks are up and the number of days stocks are down over a given period. As of Tuesday, the 20-day cumulative net positive price change days was 12, meaning 16 of the preceding 20 days were up days. As of yesterday, it has backtracked to 10.


While still a high reading, given the mean reversion to this data series, it would not be unusual if the recent run turns into a statistical slump, with more down days than up in the near future.


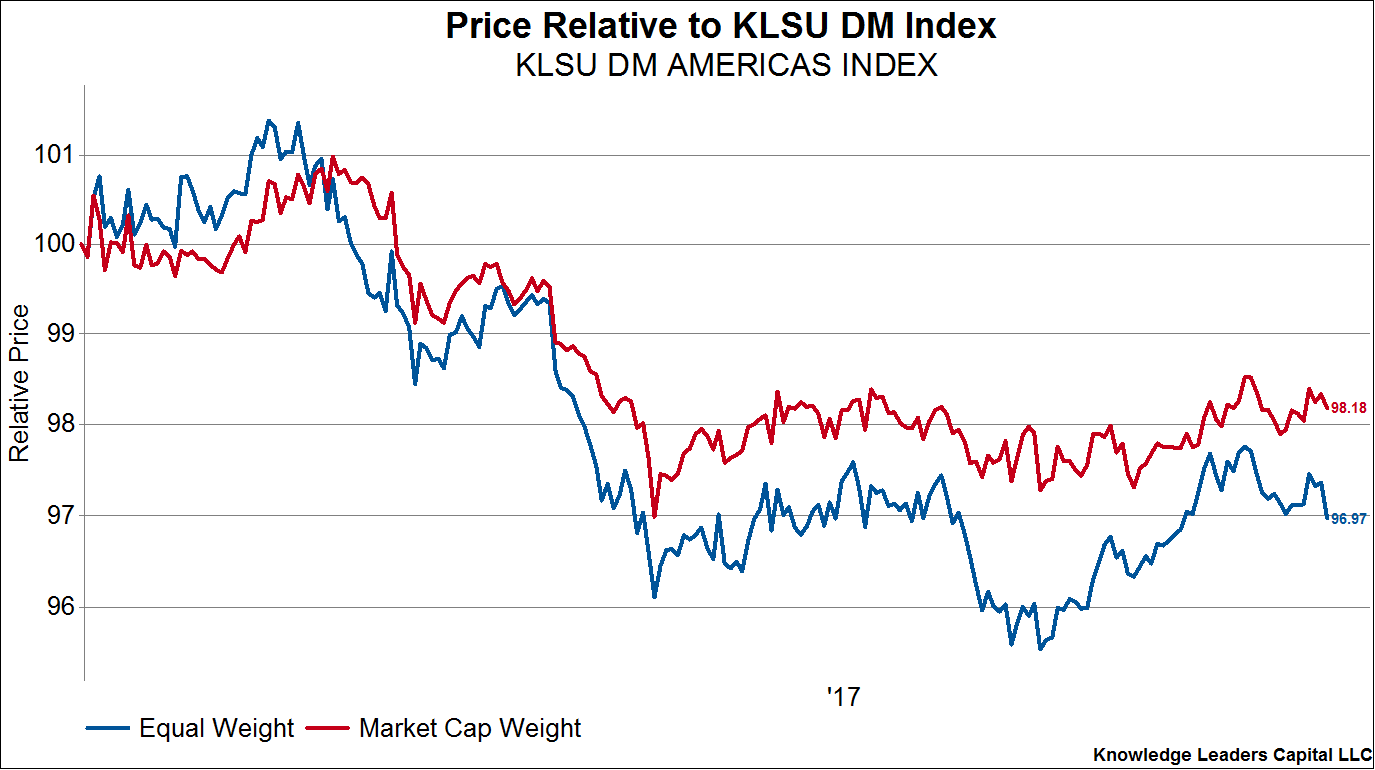
While this isn’t yet super bearish stuff, the deterioration in breadth should be considered alongside the fact that the equal weighted KLSU North America has underperformed the market-cap weighted version all year, suggesting a somewhat narrow market. And most importantly, both versions have underperformed the global equity markets YTD.


Monday, October 23, 2017

Dow 500,000?

Authored by Lance Roberts via RealInvestmentAdvice.com,


I genuinely admire Morgan Housel. I think he is a brilliant and talented writer. However, he sent out a tweet on Friday that really struck a chord with me.


It’s an innocuous tweet, meant with the best of intentions to leave you with a sense of optimism as you headed into your weekend.


I get it. Really.


As Bob Farrell once quipped:


“Bull markets are more fun than bear markets.” 


Bull markets also “sell” financial products, services, and offerings. Wall Street makes money selling products and services to “Main Street” who makes money with higher prices. Financial media makes money as advertisers market their “wares.” Being bullish also gets views, likes, comments, and shares. Bull markets thrive when “greed” erases the memories of previous “bear market” losses.


As Gordon Gecko said:


“Greed is good.” 


The problem with being “bullish all the time” is that it is also very dangerous.


This is particularly the case in late-stage “bull markets,” where poor investment decisions, and excessive portfolio “risk,” are masked by seemingly ever-rising prices. Previously bad investment ideas, products, and strategies tend to resurface in a different form or package. Investment strategies like “buy and hold” and “dollar cost averaging” become popular even though they are absolutely guaranteed to leave you well short of your financial objectives in the future.

So, what does this have to do with Morgan’s tweet?


It has everything to do with one of my “pet peeves,” and the biggest fallacy pushed by Wall Street today – “compound returns.”


Markets Don’t Compound


Morgan states that in 30-years, if the Dow grows at just 5% annually, it will hit 500,000. However, if the Dow actually compounded returns at 5%, in the future, as Morgan suggests, it would have done so in the past and would ALREADY be at 500,000. 


But it’s not. We are just stuck here at a crappy ole’ 23,000.


There is a huge difference between compound returns and average returns. The historical return of the markets since 1900, including dividends, has averaged a much higher rate of return than just 5% annually. Therefore, the Dow should actually be much closer to 1,000,000 than just 500,000.


But it’s not.


Nope…we are just hanging out way down here at 23,000.


Why? Because crashes matter. This is particularly the case when it comes to your financial goals and investing time horizons.


Think about it this way.


If “buy and hold” investing worked the way that it is preached, then why are the financial statistics of 80% of Americans so poor?


The three biggest factors are: 


  1. Destruction of capital;

  2. Lack of savings, and;

  3. Time.

While lost capital gain be regained, the time lost “getting back to even,” cannot be. Unfortunately, we don’t live forever, and time is our ultimate enemy. This is also, after two major bear markets, the majority of “boomers” are simply unprepared financially for retirement. 


It is also the reason why we are facing a massive “pension crisis” in the not so distant future as capital destruction, low contribution rates, and over-estimation of returns has led to massive shortfalls to meet required distributions in the future.


Who wouldn’t love a world where everyone just invests some money, the markets rise 6% annually and everyone one’s a winner. 


Unfortunately, there is a vast difference between an “index” which benefits from share buybacks, substitutions, and market capitalization weighting versus a portfolio invested in actual dollars. The chart below shows the S&P 500 index (nominal since that is the way it is primarily discussed) versus the actual, inflation-adjusted value, of a $100,000 investment and compared to the 6% annual return rate promised by Wall Street.


See the problem? People 30-years ago who were hoping to retire, simply can’t. It will likely be the case for individuals today looking to retire 30-years from now.


With markets now back to the second highest level of valuations on record, forward returns over the next 10-years are going to be substantially lower than they have been over the past 10-years.


That isn’t being bearish. That is just math.


Dr. John Hussman previously wrote the most salient point on this topic.


“Put simply, most apparent ‘opportunities’ to obtain investment returns above zero in conventional assets over the coming decade are based on a misunderstanding of valuations, total returns, and historical yield relationships. At current valuations, virtually everything is priced for a decade of zero.” 


Throughout history, bull market cycles are only one-half of the “full market” cycle. This is because during every “bull market” cycle the markets, and economy, build up excesses which are “reverted” during the following “bear market.”


As Sir Issac Newton once stated:


“What goes up, must come down.” 


Looking beyond the very short-term overly optimistic view of “this time is different,” the coming unwinding of current speculative extremes will occur with the completion of the current market cycle. As I noted in this past weekend’s missive:


“Also, when we look at 20-year trailing returns, there is sufficient historical evidence to suggest total, real returns, will decline towards zero over the next 3-years from 7% annualized currently. 


(These are trailing 20-year total real returns, not forward)”


“Re-read that last sentence again and look closely at the chart above. From current valuation levels, the annualized return on stocks by the end of the current 20-year cycle will be close to 0%. A decline in the next 3-years of only 30%, the average drawdown during a recession, will achieve that goal.”


The second-half of this current cycle will begin likely sooner, rather than later. As stated, it is a function of time (length of market cycles), math (valuations) and physics (price deviations for long-term means.)


I am not bullish or bearish.


My job as a portfolio manager is simple; invest money in a manner that creates returns on a short-term basis while reducing the possibility of catastrophic losses over the long-term.


While “bulls have more fun” while markets are rising, both “bulls” and “bears” are owned by the “broken clock” syndrome during the completion of the full-market cycle.


The biggest secret in achieving long-term investment success is not necessarily being “right” during the first half of the cycle, but by not being “wrong” during the second half.


It’s okay to be “always be bullish” with your attitude, just not with your money.


Sunday, October 22, 2017

First A.I. ETF Claims It Can Replace An Army Of Research Analysts

“Look Dave, I can see you’re really upset about this. I honestly think you ought to sit down calmly, take a stress pill and think things over.”


From Stanley Kubrick’s 2001: A Space Odyssey.


As if MiFID II wasn’t bad enough, now this “EquBot AI Technology with Watson has the ability to mimic an army of equity research analysts working around the clock, 365 days a year, while removing human error and bias from the process.” That is the claim of Chida Khatua, the ETF’sCEO.Unlike the existing algos used by quant funds, A.I.   the ability to learn from its mistakes without further requiring programming.


This week, EquBot LLC, in partnership with ETF Managers Group (ETFMG) launched the world’s first ETF powered by artificial intelligence, the AI Powered Equity ETF (NYSE Arca: AIEQ). According to Business Wire, the new ETF uses “cognitive and big data processing abilities of IBM Watson™ to analyze U.S.-listed investment opportunities”.


For those in the dark as far as “Watson” is concerned, it’s Wiki entry notes “Watson is a question answering (QA) computing system that IBM built to apply advanced natural language processing, information retrieval, knowledge representation, automated reasoning, and machine learning technologies to the field of open domain question answering. Watson was named after IBM"s first CEO, industrialist Thomas J. Watson. The computer system was specifically developed to answer questions on the quiz show Jeopardy! and, in 2011, the Watson computer system competed on Jeopardy! against former winners Brad Rutter and Ken Jennings winning the first place prize of $1 million. Watson had access to 200 million pages of structured and unstructured content consuming four terabytes of disk storage…but was not connected to the Internet during the game. For each clue, Watson"s three most probable responses were displayed on the television screen. Watson consistently outperformed its human opponents on the game"s signaling device, but had trouble in a few categories, notably those having short clues containing only a few words.”

Business Wire explained how EquBot makes investment decisions “EquBot’s approach ranks investment opportunities based on their probability of benefiting from current economic conditions, trends, and world- and company-specific events, and identifies those equities with the greatest potential for appreciation. EquBot and ETFMG expect the fund’s portfolio to typically consist of 30 to 70 of U.S. equities only and volatility comparable to the broader U.S. equity market…the fund’s underlying technology is constantly analyzing information for approximately 6,000 U.S.-listed equities, including company management and market sentiment, and processes more than one million regulatory filings, quarterly results releases, news articles, and social media posts every day.”


According to Chida Khatua, CEO and co-founder of EquBot LLC “Machine learning is one of the most powerful applications of artificial intelligence. As powerful as many algorithms underlying expensive quantitative hedge funds and other vehicles might be, unless they’re also built with AI and machine learning baked right in, mistakes can be propagated and opportunities for outperformance can be missed.”


Neither of the founders is lacking in confidence when discussing the potential for the new ETF. From Business Wire “With the launch of AIEQ, we’re not only bringing our new fund to market,’ said Art Amador, co-founder and COO of EquBot. ‘We believe we’re pioneering a whole new investment category; one that will soon have investors and advisors diversifying their portfolios among passive, active and AI approaches”

He added “Everyday, there is more information, not less. That information explosion has made the jobs of portfolio managers, equity analysts, quantitative investors and even index builders more challenging.”


He"s not wrong there.


A.I. might be the future of investing, although there have been funds that were so good (LTCM), they didn’t need to post collateral. This is different, obviously as we’re not just talking about a bunch of really "brainy" humans.


But how sad will it be if we go from this...


To this...


To this...


An end up with this...


The regulators are already doing their best to make the investment world less fun.


“Open the pod bays doors, HAL”


Writing about this, we were reminded of another life or death confrontation between humans and technology in Stanley’s Kubrick’s “2001: A Space Odyssey”, which also had an oblique reference to an IBM computer. In the movie, there is an argument as to whether the failure of an antenna is due to human error, as the HAL 9000 insists, or HAL, as Mission Control advises. In the ensuing conflict, HAL initially gains the upper hand, kills Poole and almost kills Bowman. Bowman manages to re-enter the ship and get to HAL’s processor core, regressing HAL to his first programmed memory.


“I know everything hasn’t been quite right with me, but I can assure you now, very confidently, that it’s going to be alright again. I feel much better now.”