Showing posts with label S&P. Show all posts

Wednesday, February 7, 2018

Is A Massive Stock Market Reversal Upon Us?

This article was originally published by Brandon Smith at Alt-Market.com


bear-market


I have been saying it for years and I will say it again here — stocks are the worst possible “predictive” signal for the health of the general economy because they are an extreme trailing indicator. That is to say, when stock markets do finally crash, it is usually after years of negative signs in other more important fundamentals.


Of course, whether we alternative analysts like it or not, the fact of the matter is that the rest of the world is psychologically dependent on the behavior of stock markets. The masses determine their economic optimism (if they are employed) according to the Dow and the S&P and, to some extent, by official and fraudulent unemployment statistics. When equities start to dive, society takes notice and suddenly becomes concerned about fiscal dangers they should have been worried about all along.


Well, it may have taken a couple months longer than I originally predicted, but it would seem so far that a moment of revelation (that slap in the face I discussed a couple weeks ago) is upon us. In less than a few days, most of the gains in global stocks for 2018 have been erased. The question is, will this end up as a “hiccup” in an otherwise spectacular bull market bubble? Or is this the inevitable death knell and the beginning of the implosion of that bubble?


After I predicted the election of Donald Trump, I also predicted that central banks would begin pulling the plug on life support for equities markets. This did in fact take place with the Fed’s continued program of interest rate increases and the reduction of their balance sheet, which effectively strangles the flow of cheap credit to banking and corporate institutions that fueled stock buybacks for years. Without this constant and ever expansionary easy fiat, there is nothing left to act as a crutch for stocks except perhaps blind faith. And blind faith in the economy always ends up being smacked down by the ugly realities of mathematics.


I believe the latest extraordinary dive in stocks is NOT a “hiccup,” but a sign that “contagion” is still a thing, and also a trailing sign of instability inherent in our fiscal system. Here are some reasons why this trend is likely to continue.


Historic Corporate Debt Levels


As mentioned above, artificially low interest rates have allowed corporations incredible leeway to manipulate stock markets at will using stock buybacks and other methods. However, there are still consequences for this strategy. For example, corporate debt levels are now at historic annual highs; far higher even than debt levels just before the crash of 2008.


If this doesn’t illustrate the falseness of the so called “economic recovery”, I don’t know what does. Beyond that, what happens as the Fed continues to raise interest rates and all that debt held by the “too big to fails” becomes vastly more expensive? Well, I think we are seeing what happens. Over time, faith in the corporate ability to prop up equities will erode, and a considerable decline is built directly into the farce.


Price To Earnings Ratio


In some of her final statements upon stepping down as the head of the Federal Reserve, Janet Yellen had some choice comments about the state of equities markets. These included statements that stock market valuations were high and that the price-to-earnings ratio of the S&P 500 (the ratio of stock values versus actual corporate earnings per share) were at a historical peak. This fits exactly with the policy shift I warned about in 2017, and my assertion that Jerome Powell will be the Fed chairman to oversee the final crash of the post-bailout market bubble.


The spike in P/E ratios is not only taking place in U.S. markets. For example, the same trend can be observed in countries like India. Meaning, there are equities valuation problems around the world.


The issue here is that corporate earnings do not justify such high stock prices. Therefore, something else must be inflating those prices. That something was, of course, central bank stimulus, and now that party is almost over, whether the “buy the f’ing dippers” want to admit it yet or not.


10-Year Treasury Yield Spike


Have spiking Treasury bond yields actually been a signal for an “accelerating economy” as mainstream economists often suggest? Not really. In the era of central bank monetary manipulation, it is more likely that yields were spiking because markets are anticipating the arrival of Jerome Powell as Fed chair and accelerating interest rate hikes rather than an accelerating economy.


The notion that the economy itself might be “overheating” in 2018 is a rather new and nefarious propaganda meme being used by central bankers to set a particular narrative. I believe that narrative will be the claim that “inflation” is a key concern rather than deflation and that central banks must act to temper inflation with more aggressive rate increases. In reality, what we are seeing is not “inflation” in a traditional sense, but stagflation. That is to say, we are seeing elements of price inflation in necessary goods and services and well as property markets, but continued deflation in the rest of the economy.


The Fed in particular will continue to ignore negative fundamentals because they are seeking to deliberately pop the market bubble they have created.


The spike in 10-year bond yields seems to be correlating closely to the recent volatility in stocks. This volatility increased exponentially as yields neared the 3% mark, which appears to be the magical trigger point for equities failure.  Though yields suffered a modest decline as stocks tumbled this week, I still recommend keeping an eye on this indicator.


Dollar Weakness


As I have mentioned in recent articles, there has been a strange disconnect between interest rates and the U.S. dollar. As the Fed continues its policy of hiking interest rates, generally the dollar index should rise in response. Instead, the dollar has been swiftly falling, only stalling in the past couple of trading sessions. If the dollar index continues to fall even as stocks decline and rates increase, this may suggest a systemic risk to the dollar itself.


Such risk could include a dollar dump by foreign central banks in favor of a wider basket of currencies, or the SDR trading basket created by the IMF.


Balance Sheet Reductions Accelerating


The Fed’s most recent release of data on its balance sheet reduction program shows a drop in holdings of $18 billion; this is far higher that the originally planned $12 billion slated by the Fed. Meaning, the Fed is dumping its balance sheet holdings much faster than it told the public initially.


Why is this important? Well, if you have been tracking the behavior of stocks over the past few years as well as the increases in the Fed’s balance sheet, you know that stock markets have risen in direct correlation with that balance sheet. In other words, the more purchases the Fed made, the higher stocks climbed.


Image result for Fed balance sheet and Stocks 2017


If this correlation is directly linked, then as the Fed reduces its balance sheet, stocks should fall.


So, the fed announces its latest round of balance sheet reductions on January 31st, the reduction is much higher than anticipated, and within a week we witness the largest two day market drop in years. You would think this observation might just be important, but if you look at the mainstream economic media, almost NO ONE is mentioning it. Instead, they are searching for all sorts of random explanations for what just happened, none of which are very logically satisfying.


I believe that the Fed will not only continue its program of interest rate increases even if stocks begin to flounder, but that they will also unload their balance sheet as quickly as possible.


Corporate Investor Comments


Major corporate investment firms are beginning to raise their voices about the potential not only for stock devaluations, but also the amount that they might fall. Sydney-based AMP capital suggested a rather moderate 10% pullback in equities, which I think will become the talking point for most of the mainstream media over the next couple weeks. At least, until the whole thing comes crashing down much further than that.


The head of Blackstone COO expects stocks to fall at least 20% this year, a much more aggressive number but not high enough in my view.


I still believe these kinds of estimates are only applicable in the very short term. By the end of 2018, it is possible that markets will double the worst estimated declines predicted by the mainstream investment world given the fundamentals.


Central Banker Comments


Comments by agents of the Federal Reserve reinforce the notion that the central bank is about to crush the bull market bubble. San Francisco branch head Robert Kaplan has been quoted as saying the Fed may be required to hike interest rates MORE than the three times expected by mainstream economists in 2018.


As noted above, Janet Yellen’s exit statements were decidedly “hawkish,” suggesting that property markets and stocks are overpriced. On top of this, Jerome Powell, the new Fed chair, has been quoted in Fed documents from 2012 (finally released this past month) discussing the market bubble the Fed had created and the need to temper than bubble. In other words, Powell is the perfect man for the job of imploding stocks. Powell even predicted in 2012 that when the Fed raises rates the reaction by stock markets might be severe. Interesting that markets would plunge the very first day Powell assumes the Fed chair position.


I suppose finally a Fed agent and I have something in common. We’ve both been predicting the same exact market outcome caused by the same trigger event for around the same number of years.


I outlined in great detail the plan for the “global economic reset” and Powell’s role in overseeing the next stock crash in my article Party While You Can – Central Bank Ready To Pop The Everything Bubble. In that article, I predicted exactly the results which seem to be developing today in equities.


In essence, Powell is being portrayed by the mainstream media as “Trump’s guy,” and the change in Fed leadership is now being referred to as “Trump’s Fed.” This is not random rhetoric. I can’t think of ANY other president in the past that was given credit by the mainstream media for the activities of the Federal Reserve. Trump’s control over the Federal Reserve is zero. But, the actions of the Fed over the course of this year will undoubtedly crash the very equities markets that Trump has been foolishly taking credit for since his election.


The real issue here now is, how fast will this ugly festering sore explode? That’s hard to say. I would not be surprised if markets fall about 20% below recent highs in the course of the next couple of months and then stall. We may even see a couple spectacular bounces in the near term, all set to trumpets and fanfare by the mainstream economic media who will proclaim that the latest shock-drop was nothing more than an “anomaly.” Then, the crash will continue into the end of 2018 and panic will ensue.


That said, if there is some kind of major geopolitical crisis (such as a war with North Korea), then all bets are off. Stocks could crash exponentially over the course of a few weeks rather than a year. As the past few days have proven, stocks are not invincible, not in the slightest. And all the gains accumulated in the span of years can be wiped away in an instant.


***


If you would like to support the publishing of articles like the one you have just read, visit our donations page here. We greatly appreciate your patronage.


You can contact Brandon Smith at: brandon@alt-market.com


After 8 long years of ultra-loose monetary policy from the Federal Reserve, it’s no secret that inflation is primed to soar. If your IRA or 401(k) is exposed to this threat, it’s critical to act now! That’s why thousands of Americans are moving their retirement into a Gold IRA. Learn how you can too with a free info kit on gold from Birch Gold Group. It reveals the little-known IRS Tax Law to move your IRA or 401(k) into gold. Click here to get your free Info Kit on Gold.

Wednesday, December 13, 2017

House, Senate Republicans Reach Tax Deal: Here Are The Initial Details

One day after we reported that "Congressional Republicans reached a tentative tax agreement", the news of which sparked another risk surge into the close of trading, moments ago we got the second tax deal in 24 hours - if only for algo consumption - when the AP reported that House and Senate GOP leaders have reached a "tentative deal" on tax overhaul "in principle."


The AP quoted a "person familiar with the conversations who asked not to be named because the discussions are private" and who is certainly long stocks, as the replica headline was enough to send the S&P to new all time highs. 


The agreement "in principle" paves the way for final votes next week to slash taxes for businesses and give most people tax cuts starting next year. Top GOP aides say the deal was reached on Wednesday. They spoke on condition of anonymity because they were not authorized to speak publicly about the deal. Details still need to be drafted and assessed by congressional scorekeepers but the final House-Senate compromise is on track to be unveiled this week. 


The details, virtually identical to what we reported yesterday: the top individual tax rate would be lowered to 37% as and set the corporate tax rate at 21%, slightly higher than the 20% initially favored by President Trump. The mortgage interest deduction would be capped at $750,000, a mid-point compromise between the Senate and House bills.


The deduction for pass-through companies will be set at 20 percent, somewhat lower than the 23 percent included in the Senate-passed bill. That will be offset by lowering the top individual income rate to 37%. It is now 39.6%.


* * *


Still, lawmakers will need to get a cost analysis of their agreement, so it’s not yet definite, "the person" said, who clearly gets around and was this time quoted by Bloomberg.


And since lawmakers still need to get a cost analysis of their agreement, not only is today"s "tentative deal" not yet definite, but it will almost surely be unwound when someone actually brings a calculator into the room.


Curiously, after jumping higher, stocks have since faded the kneejerk reaction higher, perhaps realizing that the more fiscal stimulus that is injected, the more tightening the Fed will have to unleash in the coming months as inflation become red hot.


Thursday, December 7, 2017

The End Is Near?


The End Is Near?


Written by Craig Hemke, Sprott Money News & TF Metals Report


The End Is Near? - Craig Hemke


For gold investors, the major thorn in our side continues to be the USDJPY so we need to discuss it again.


Over the past weekend at TFMR, we had a discussion about how so many well-intentioned people could have been so wrong about "the metals" over the past five years. It included this sentence: "What we failed to predict was the successful, collective manipulation of nearly all "markets" by the CBs, their primary dealers and their willing/sycophant media through HFT."


That one sentence could be the subject of a full post or podcast but, for now, let"s just focus upon the market manipulation through HFT. As you know by now, the USDJPY is just about the single most important general input for HFT buy/sell decisions. Whether it"s S&P futures, bond futures or Comex Gold, the direction of the USDJPY generally impacts all of these "markets" more than anything else. The chart below plots the inverse of USDJPY (JPYUSD) with gold futures. Note clear correlation that began in 2008.


In observing the central bank market manipulation...when we see the same pattern again and again...and this pattern is followed by the desired equity or bond market reaction...then you know something is up. How many times have we captured screenshots of the BoJ, Fed, SNB or whomever buying the USDJPY in size at just the right moment to create and paint a double bottom on the chart? From there, how many times have we watched a near perfect and uninterrupted, 45-degree angle recovery ensue?


Here are just a couple of egregious examples that I just chose at random from my desktop folder that holds about 40 charts. (I"ve only been keeping them since late summer.)


Well, since we just used the term "egregious", let"s apply it again to the charts below. Recall that things were sailing along surprisingly well last Monday. Over the previous week, the USDJPY had failed to hold support near 113 and again near 112 and it had fallen to near and just below the very-important 111 level. Then, as we chronicled that day, a sudden spike occurred on NO NEWS and not even any rumors. Just a spike from out of the blue that drove the pair immediately back above 111.


And what followed over the next five days? Well, outside of the sudden plunge on the now disproven stories from Brian Ross at ABC News, the USDJPY has followed the same glide path all the way back to 113. Also, IT"S VERY IMPORTANT TO NOTE where USDJPY reopened Sunday afternoon...RIGHT ON the glidepath. Remove the reaction to Friday"s unexpected headlines and it"s a near-perfect, 45-degree angle for nearly FIVE FULL DAYS.


(And in case you"re wondering which tail wags which dog, note the turn in USDJPY last Monday clearly preceded the turn in the S&P.)


How is this even possible? It"s not...well, at least not in the traditional and "free market" sense...the pre-2008 and pre-2012 sense. All of these things used to move somewhat independently as human, carbon-based traders made rational investment decisions based upon a number of inputs. However, in 2017, where 90% of all trading is now done through HFT....well, the results are pretty clear. The Central Banks and their Primary Dealer trading desks manipulate the key inputs and HFT does the rest. This is why yours truly and so many other "experts and mavens" have been confounded for the past five years. It"s not nefarious intent and it"s not because gold bugs are cruel, heartless charlatans who are intent upon stealing as many dollars as possible from the easily-duped. Instead, it is a failure to anticipate the levels to which The Central Banks would successfully go to keep their system alive.


Understanding this is why you consistently hear me cite the refrain of PHYSICAL DEMAND. It is only through a renewed crisis of confidence that this system can be broken...at least as it pertains to the precious metals. Physical demand will bust The Bullion Banks by breaking their just-in-time and unallocated delivery system. Physical demand will force price to be discovered through the exchange of physical metal, not the alchemized digital garbage that permeates the system today.


We"ll leave you today with stories from each end of The Bank monster. The first, and one that we"ve been following closely since last March, is the continued run-up to renewed war on The Korean Peninsula. WHILE NO ONE IN THEIR RIGHT MIND IS CHEERING THIS ON, it is important to be prepared for all of the unknown unknowns that would come with such a catastrophe, one of them being financial calamity that could again shatter confidence in the current system.


http://theweek.com/articles/740264/why-north-korea...


And the other story deals with gold alchemy and the continued shunting of physical demand into sham/scam paper investments. It seems the World Gold Council is hungry to increase their fees. They are apparently planning to offer a whole new "gold" ETF, perhaps designed to compete with the IAU. Ask yourself, from where will this fund get the 200-300 metric tonnes of gold needed to fund its "inventory"? Once again, The Banks will simply perform the alchemy of leveraging current unallocated stockpiles into more and more digital "gold".


http://www.etf.com/sections/daily-etf-watch/new-ph...


Again, true physical demand is the only antidote to the poison created by the Central Bankers and the Bullion Banks. Sadly, 2018 promises another surge in war, debt, negative interest rates and de-dollarization. Will these events finally prompt enough physical demand to break The Banks? Only time will tell.


Questions or comments about this article? Leave your thoughts HERE.


The End Is Near?


Written by Craig Hemke, Sprott Money News & TF Metals Report


Check out these other articles by our contributors:


Craig Hemke -   Another Tradable Low Coming


John Rubino - Finally, An Honest Inflation Index – Guess What It Shows


Jeff Thomas - Tilt! Game Over


Ask The Expert: Jim Willie

Sunday, November 26, 2017

Muir: "People Are Going To Be Wiped Out" By Short-VIX ETFs

Back in August, we highlighted a story in the New York Times about a former manager at Target who decided to try day trading with $500,000 he had saved up. Over the following years, he turned that into $13 million by following one simple strategy: Shorting volatility every time it spiked.


As MacroVoices host Erik Townsend points out, that strategy has worked for many retail investors over the past eight years. And in a brief “postgame” interview with the Macro Tourist Kevin Muir following a longer interview with Francesco Filia, a fund manager at Fasanara Capital, the former explains how many investors don’t understand the risks associated with shorting volatility, as well as the possible repercussions if exchanges and brokerages don’t take the appropriate steps to limit this.


Townsend begins the discussion by asking Muir about a chart he created of the VXX - the long-VIX ETF - which, because of the low-volatility environement, has repeatedly split leading to unbelievable wealth destruction.


Going back to 2009, the price of the ETF has gone from $120,000 a share to just $35. And while a sudden spike in volatility could see it surge, with so many investors on the other side of the trade, it"s worth considering what might happen if they couldn"t pay.


It’s frightening. And I don’t think enough people are – well, there are some – but I don’t think that enough people are really considering all these things. And I think that guys like the Interactive Broker chairman, that are taking proactive steps to make sure that there’s enough margin, we need to see more of that. We need to see more people saying, hey, wait, this is actually a very, very scary instrument that has a lot of risk in it.


I watched a Real Vision interview with John Hempton from Bronte Capital, and he talked about phoning up the infamous Target salesman guy, the fellow that quit his job as a Target manager to trade XIV and all the VXX products, and he turned his 1/2 a million bucks into 13 million bucks. The part that really scared me about it was that John phoned him up and he was expecting to talk to this very sophisticated guy, and his basic takeaway was that, although he had a lot of buzzwords, and he understood kind of what the products represented, he didn’t really understand his true risk.


And I think that there’s just a myriad of people out there that are trading these things that don’t understand that. The more people that wake up and realize this, and stop playing this game, the better off we’ll be, actually.


Brokerages have caught on to this, Muir says. Interactive Brokers, one of the largest online brokerages, is now asking retail investors to post between 300%-400% margin when they short certain VIX contracts – because brokerages recognize that one sharp drawdown in the S&P 500 could blow millions of short traders out of their positions, potentially leaving thousands of customers with massive negative balances that could threaten the brokerages’ existence.


Erik, you’re absolutely correct. And Interactive Brokers, one of the largest electronic brokers out there, realizes the risk. If you look at the way that they’re margining these products, they’re margining them completely different than what the exchanges and everyone else say is the proper amount.


So if you look at the VIX futures, the front month is $6,200 – the exchange minimum is $6,200 – which works out to roughly 50% of a contract. The next month is $4,000, which works out to 30% of a contract. And the far months are $2,500, which works out to 17% of a contract.


But if you go to Interactive Brokers and you want to sell this VIX contract short, you have to put up 300%–400% of the contract. Because they’ve looked at it and they’ve realized that if the S&P has a 10% down move, which isn’t out of the realm of possibility, that the VIX could spike up to 37 really easily. And people are going to be wiped out if that happens.


Should the VIX suddenly spike, the repercussions of such a move would be further complicated by the billions of dollars sitting in various VIX-linked ETFs. Because individuals sellers would probably disappear from the market in such a situation, the ETF market makers would find it nearly impossible to hedge their positions, potentially triggering the dissolution of the funds, or even the collapse of some of these firms.


There’s $1.2 billion of the XIV, which is the short ETF. There’s $1.3 billion of the SVXY, which is another short one. These are staggering numbers.


In my days, when I was on the institutional desk, we had this big – I did index arbitrage, and we used to go out and buy the baskets and sell the futures. One day the risk manager came to me and said, if you had to take this position off (because we had accumulated this big position) how long would it take you? And who would do it?


And I said, the reality is that there’s nobody. You know, we were the biggest player in the market and there was nobody that was going to take this off of us. The only way was to go all the way to expiry.


Well, the reality is that these numbers are way bigger than any market player can absorb. And, if we get a situation where – as Francesco says, all it’s going to take is a return of the VIX from its current level of 10 to its average level of 18 or 19 to wipe out these products.


I guess that’s the point that I want to make: If you’re actually owning these things, you should be aware that all it will take is a move of 80% and then they’re going to wind down these products. So the XIV, when it moves up, if all of a sudden VIX goes from 10 to 18 in a day, they’re going to wind down that product.


And what’s going to be really scary is the amount of VIX futures that is going to have to be bought, because they’re short all those VIX futures and they’re going to have to buy them back.


And I just don’t know who’s going to sell it to them. For the first time – for a long time, I didn’t view this VIX as that big a deal, and there were some smart guys like Jesse Felder that were going on about it – I just think that it has been taken to a level that is becoming increasingly worrisome. And it actually could create a market dislocation in itself.


And what is it Warren Buffett says? What the wise man does in the beginning the fool does in the end. Well, VIX, at this point, we’re hitting a point where if you’re actually continuing to bet on it you’re going to be in the fool category.


Because it’s not going to take much to have a big spike that wipes a lot of people out. And it’s actually very, very worrisome.


Of course, it would take a large intraday move to trigger a truly catastrophic spike in the VIX. But at least one analyst, Bank of America’s Michael Hartnett – whose work we have cited here – believes there could be a 1987-style crash in the early months of 2018. Hartnett’s reasoning? The bearish positioning seen at the beginning of 2017 has completely flipped. Investors’ long positions are larger than they’ve been in years.


And as we’ve repeatedly pointed out, with volatility and volume so subdued, hedge funds have remained overwhelmingly short vol, fearful of missing out on even one tick of the torrid rally for fear of pissing off their clients.


One things for certain: Given the market’s already dramatically overextended rally, the day of reckoning is coming. The only question is will it be a steady decline, or will it happen suddenly?


Given the incredibly stretched nature of positioning, the latter scenario, Muir and Co. believe, seems far more likely.


* * *


Muir"s discussion begins just after the hour mark:


Friday, November 24, 2017

Just 10 Companies Account For 33% Of All Market Gains Since Trump"s Election

Yesterday we laid out the reasons why French bank SocGen unveiled a surprisingly contrarian forecast, according to which the S&P would tumble from its current level over 2,600 to 2,000 in 2018, representing a more than 20% bear market drop...


... the drop catalyzed by rising interest rates pressuring P/E multiples, a late cycle economy nearing recession, equities trading at record valuations, and with everyone short vol begging for a vol short squeeze. Not surprisingly, SocGen"s unspoken advice was to get out now.


And while many of the negative factors highlighted by SocGen had already been discussed here in the past, there were two we warned to bring attention to: the market"s multiple expansion since Trump"s election, and the narrow leadership in the S&P.


As we noted yesterday, contrary to the widely accepted narrative, while the S&P 500 has risen 24% since Trump"s election, only half of this performance has been driven by earnings growth; the other half is from P/E expansion. But why would P/Es rise at a time when the Fed is tightening? As SocGen speculated, assuming that analysts have not factored tax reform into their earnings forecasts, tax reform expectations have been the driver of P/E expansion. There is a problem with this: while the S&P 500 index tax rate is currently 26.6%, assuming that US companies generate 43% of their profits abroad (here) and pay 35% of their US profits on taxes (i.e. with no loopholes for US profits), the average tax rate outside the US would be 15.5%. A decrease in the US tax from 35% to 20% as planned by Trump’s tax reform would thus theoretically boost earnings by 8.5%. The 12-month forward P/E has risen 12% over the last 12 months. In other words, roughly 150% of Trump"s tax cuts have been priced in!


However, another especially interesting observations goes to the leadership of this 24% rally since Trump"s election, which - while hardly a surprise - was largely driven by a handfull of companies, or ten to be precise.


As SocGen calculates, just 10 contributors of the S&P 500’s bull run have accounted for 33% of the S&P 500 performance. Tying to the above, the bank also points out that all of the companies listed below have seen their P/Es expand over the last 12  months, in some cases - like Nvidia, WalMart, Boeing and Amazon - dramatically. In fact, only three companies (Apple and the two banks) have 12-month P/Es that are below the market average (18x). Lastly, keep in mind that except Amazon, all of the companies already pay a  corporate tax rate below the current US federal tax rate (35%), and five companies even pay a tax rate that is below the 20% rate targeted by Trump’s tax reform.


As we asked two days ago when we showed that the bulk of hedge funds gains in 2017 have come from holding this same handful of companies, what happens to hedge fund performance - and the S&P 500 - when, for whatever reason, the tide turns and the winners are the first to be sold?


Tuesday, November 21, 2017

What If The "Exuberance" Is "Irrational"? Then Hold On To Your Hats...

As discussed earlier, Goldman"s entire S&P500 price forecast for 2018 and the next three years is based on two things: tax reform passing, but more broadly, something that David Kostin dubbed "Rational Exuberance", to wit:


“Rational exuberance” best describes our forecast for the trajectory of the S&P 500 during the next several years. Earnings drive stocks over time and should support the index rising to 2850 at year-end 2018, 3000 at the end of 2019, and 3100 by the close of 2020, representing a price gain during the next three years of 20%. Our price targets imply a modest expansion in forward P/E multiple to 18.2x at year-end 2018, a flat multiple in 2019, and a contraction to 18.1x in 2020.


As Kostin describes it, "rational exuberance" is defined by "above-trend US and global economic growth, low inflation, low albeit slowly rising interest rates, and underlying corporate profits boosted by pending corporate tax reform likely to be adopted by early next year."


So far so good, but as Kostin also explained, absent tax reform passing, the S&P will not only not hit 3,100 in 3 years, it may well be lower: "Assuming tax reform passes, we forecast S&P 500 adjusted EPS will jump by 14% to $150 in 2018. Equity investors will be rewarded as the index advances by 11% to 2850 at year-end 2018 and delivers a total return of 13% including the 2% dividend yield." Meanwhile, "If tax reform fails, S&P 500 will fall near-term by 5% to 2450."


It was not clear what would happen to Goldman"s 2020 S&P price target of 3,100 if tax reform does not pass.


What was clear is what would - according to Goldman - happen if the rational exuberance is, in fact, irrational. Here the bank notes that it is impossible to know ex post what flavor the current exuberance has: "Unfortunately, it is only in retrospect that one can definitively establish that assets have reached unsustainable levels. Greenspan was prescient, but three years early. Following Greenspan’s speech warning of the potential for excessive valuations, the S&P 500 subsequently more than doubled (+116%) during the next three years before the Tech bubble finally peaked in March 2000 at a forward P/E multiple of 24x."


So what would happen if the exuberance that awaits the S&P is, in fact, irrational? To that question, Goldman has a ready answer: "We would deem it “irrational exuberance” if the S&P 500 during the next three years followed the exponential trajectory of stocks in the late 1990s."


In such a case, Goldman predicts that the S&P 500 would trade at 5300 by year-end 2020 (a 105% rise from today). If slightly "less irrational" bubble over the next three years would mean stocks instead trade at a similar forward P/E to the Tech Bubble (24x), and would imply a year-end 2020 index level of 4050 (57% above today). During the three years post Greenspan’s speech, S&P 500 EPS rose by 26% ($40 to $50). Translated to today, Goldman calculates such a growth rate would imply 2020 EPS of $166 compared with our estimate of $163.


And for the visual traders, the light blue line in the chart below - i.e., the "irrational" one - would recreate the late 1990s exuberance in the context of today"s market.


Monday, November 20, 2017

Transports- Diverging for 1-year, testing important support


1-year ago this month, the Transports/S&P 500 ratio peaked and has been heading lower, reflecting that Transports have been diverging against the broad market. Below looks at the performance of the S&P to Transportation ETF (IYT)-


CLICK ON CHART TO ENLARGE


The chart above highlights that IYT and underperformed the S&P 500 by nearly 10% in the past 12-months, with a good deal of underperformance taking place the past few weeks.


Below looks at the pattern of IYT over the past few years-


CLICK ON CHART TO ENLARGE


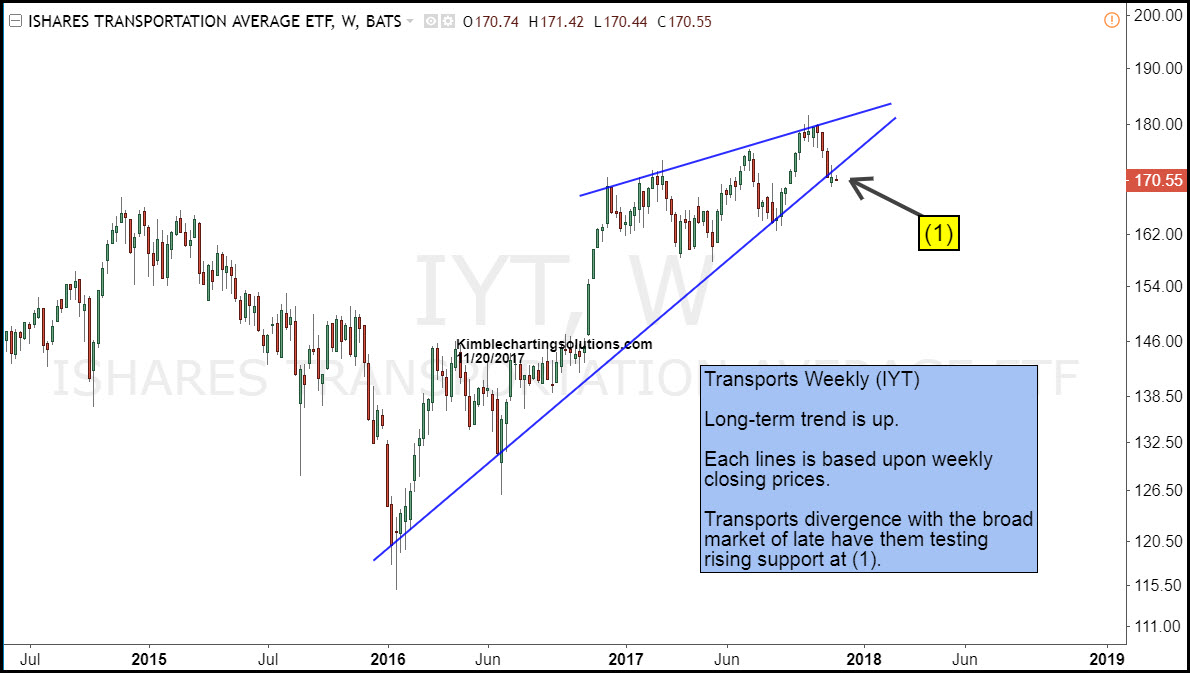
IYT is testing rising support, which could be a support test of a bearish rising wedge pattern. At this time the trend is up, despite the year-long divergence.


What IYT does at (1), could send an important ST message to the key sector. Sometimes in history, how this key sector does, can send an important message to the broad market.


We humbly feel what IYT does at (1), could end up sending an important intermediate message to the sector and the broad market.


Why you see chart pattern analysis with brief commentary:   


There is a ton of news and opinions about markets and stocks that make

the decision-making process more difficult than it needs to be.   


I believe the Power of the chart Pattern provides all you need to see what is taking place in an asset and

determine the action to take. 


This approach

has worked well for me and our clients and I encourage you to test it for

yourself.


Send an email if you would like to see sample research and take me up on a trial of our Premium or Weekly Research where I provide actionable alerts on breakouts and reversals in broad market indices, sectors, commodities, the miners and select individual stocks 


Email services@kimblechartingsolutions.com  


Call us Toll free 877-721-7217 international 714-941-9381 


Website: KIMBLECHARTINGSOLUTIONS.COM 


Receive daily research I post on the blog each day


Follow on Twitter 


See our latest webinar


Wednesday, November 15, 2017

S&P 500- Could be dangerous place for selling to start!


The trend in the S&P 500 remains up, as it is above long-term moving averages and is in a solid rising channel in the chart below. The little bit of softness that has taken place of late has done nothing to change that trend.


The Power of the Pattern wanted to share with you this morning a key test to the bull trend in the chart below-


CLICK ON CHART TO ENLARGE


The S&P has remained inside of quality rising channel (1) since the 2009 lows. The top of the channel was touched back in late 2014, where it then embarked on sideways to downtrend until it testing the bottom of the rising channel in 2016.


The strong rally since testing the bottom of the channel in 2016, now has it testing the top of the channel at (2).


This could be a dangerous channel resistance test for the bulls if selling would start, especially as the number of assets invested in the 2X long S&P ETF is near record highs!


Why you see chart pattern analysis with brief commentary:   


There is a ton of news and opinions about markets and stocks that make the decision-making process more difficult than it needs to be.   


I believe the Power of the chart Pattern provides all you need to see what is taking place in an asset and determine the action to take. 


This approach has worked well for me and our clients and I encourage you to test it for yourself.


Send an email if you would like to see sample research and take me up on a trial of our Premium or Weekly Research where I provide actionable alerts on breakouts and reversals in broad market indices, sectors, commodities, the miners and select individual stocks 


Email services@kimblechartingsolutions.com  


Call us Toll free 877-721-7217 international 714-941-9381 


Website: KIMBLECHARTINGSOLUTIONS.COM 


Receive daily research I post on the blog each day


Follow on Twitter 


See our latest webinar


Tuesday, November 14, 2017

Goldman Discovers Something Odd: Stock Moves Are Increasing Even As Index Moves Are Decreasing

One wouldn"t know it by looking at the moves in equity indexes, but this earnings season has been unusually volatile for stocks, which however has yet to translate into bigger moves at the macro level. That is the bizarre observation made by Goldman"s derivatives strategist John Marshall (whose team grew by one when ex-Deutsche Banker Rocky Fishman joined recently).


As Goldman shows in the chart below, while earnings day moves have increased in the US and globally, and stock dispersion generally has jumped to the highest since the Trump election, index moves have been the smallest in years. Goldman believes this is further evidence "of increased uncertainty in the equity market."


Quantifying the delta between the two vol indicators, Goldman writes that over the past two weeks, the SPX has moved an average of 0.17% per day (1-standard deviation BELOW its 3-year average), while looking under the hood at the stocks in the S&P 500 the standard deviation of returns has been 1.8% on average (1-standard deviations ABOVE its 3-year average). As an indication of just how much turblience there is below the surface, earnings day moves are 4.2x average daily moves for US stocks (3.6x for European and 2.3x for Asian) in this earnings season so far.


Using the charts below, Goldman shows the earnings day absolute move in stocks relative to the non-earnings days 1 month before and after. This includes data through November 9, 2017 for the current quarter. Earnings day moves are above average levels relative to the past decade, while non-earnings days have had lower volatility.


What does this bifurcated volatility pattern mean? According to Goldman, "this as evidence that fundamental uncertainty is rising (stock moves on earnings days) while general macro fears have fallen (stock moves on non-earnings days)." In practical terms, and based on the relationship of index volatility and the standard deviation of S&P 500 stock returns over the past 15 years, Marshall writes that he would expect "the SPX to be moving 90bps per day rather than the current 17bps. This implies realized volatility above 15%." Of course, that may not be possible (or allowed by central banks) because as we wrote two weeks ago, the beta of VIX spot has exploded to -19, which means that even a mere 90bps down day in the S&P could launch a self-reinforcing vol cascade which crushes the millions of vol sellers, unleashing a another sharp correction, or worse.


Goldman"s conclusion:


A rise in single stock volatility is generally associated with a decline in equity returns. Based on the relationship between the standard deviation of S&P 500 stock returns and forward returns in the SPX over the past 15 years  (controlling for index returns and index volatility), this elevated level of stock volatility would suggest a decline in the SPX of 0.8% over the next two weeks +/- 1.5%.


Alas, that observations is completely meaningless as due to the margin of error, the market can rise by 0.7% and Goldman can still claim it was right.


In any case, Goldman ends on a cautious note and warns that "while we do not believe this alone is a compelling reason to sell the market today (or buy VIX), we believe it is a trend worth monitoring closely."


Friday, November 10, 2017

Sweet melt up potential here says Joe Friday


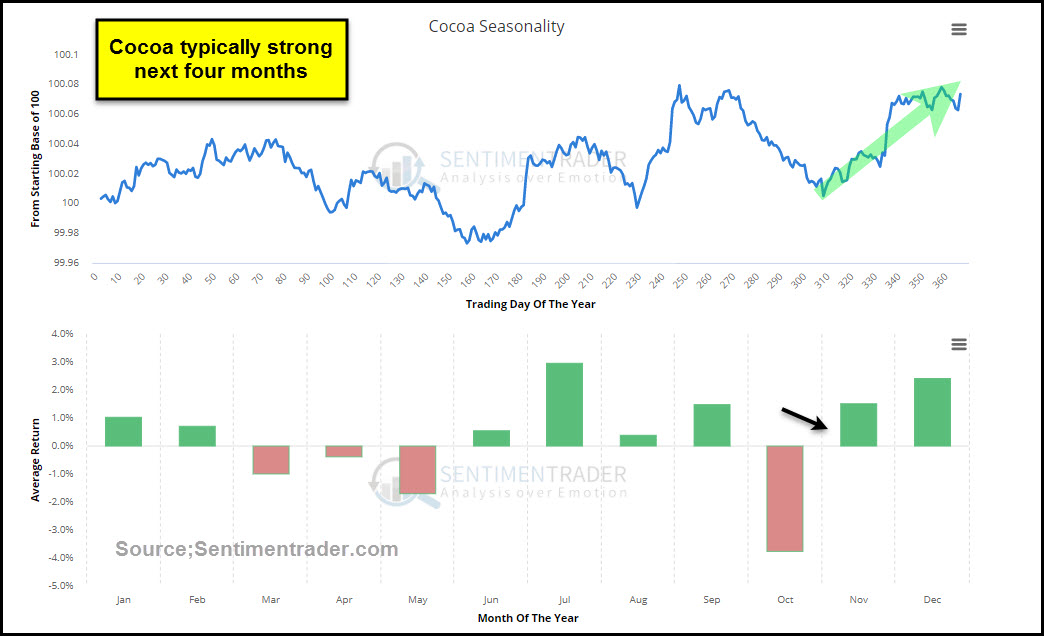
Tis the season for Chocolate (Cocoa) to do well, will it repeat its historical pattern again this year?


Below looks at the seasonal pattern of Cocoa from Sentimentrader


CLICK ON CHART TO ENLARGE


Going into this period of seasonal strength, Cocoa bulls of late are hard to find and dumb money traders have established one of the largest short positions in this commodity in years. The triple combo could make the price action of this commodity very interesting going forward.


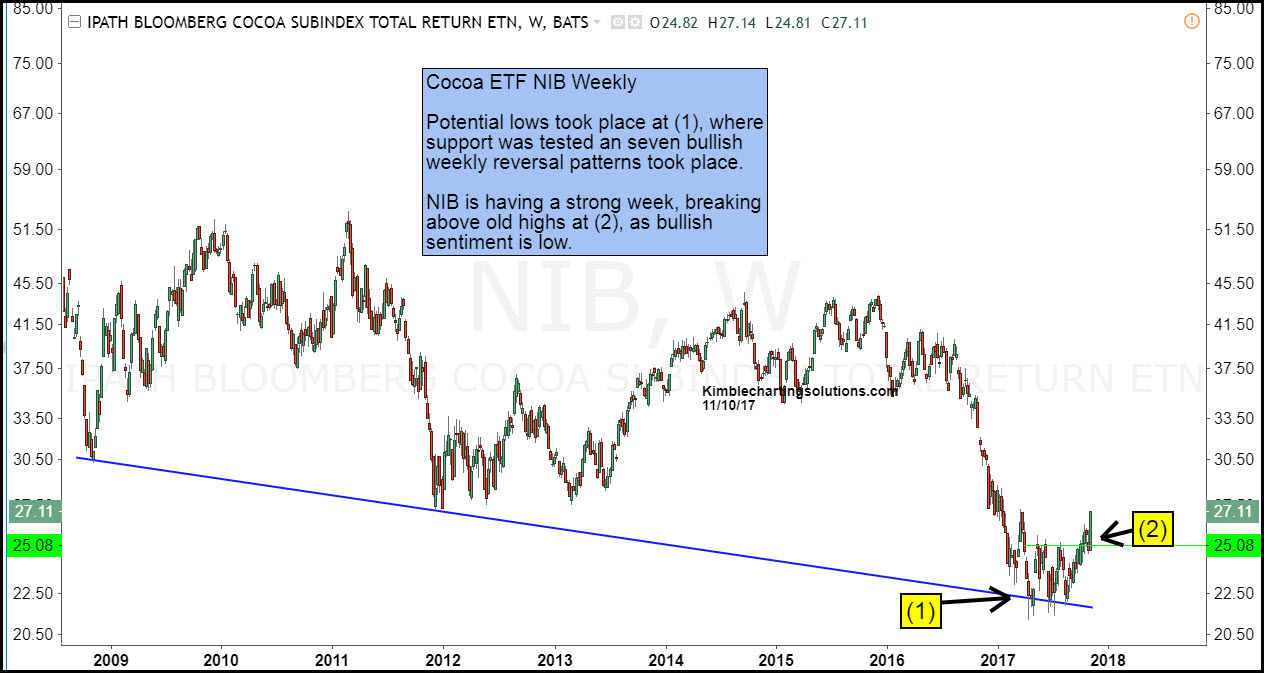
This commodity can be played in the futures markets or two different ETF’s (NIB & CHOC). Below looks at NIB


CLICK ON CHART TO ENLARGE


Cocoa ETF NIB could have built a base at, where seven different bullish wicks (reversal wicks) took place just above 10-year support at (1). Of late NIB has been moving higher and this week looks to be breaking above highs hit earlier this week at (2).


A nice combo of pattern, sentiment and traders positions is in play in this asset that is down nearly 50% in the past couple of years.


Some perspective- since the first of this month, NIB has gained over 7%, which is nearly half of what the S&P has done year-to-date.


Full disclosure Premium and Sector members have been long NIB since the end of October. If you would like to become aware of these type of pattern and sentiment setups, we would be honored if you were a member.


Why you see chart pattern analysis with brief commentary:   There is a ton of news and opinions about markets and stocks that make the decision-making process more difficult than it needs to be.   


I believe the Power of the chart Pattern provides all you need to see what is taking place in an asset and determine the action to take. 


This approach has worked well for me and our clients and I encourage you to test it for yourself.


Receive my free research posted on the blog daily here 


Or,  send an email if you would like to see sample research and take me up on a trial of my premium or weekly research where I provide actionable alerts on breakouts and reversals in broad market indices, sectors, commodities, the miners and select individual stocks 


Email services@kimblechartingsolutions.com  


Call us Toll free 877-721-7217 international 714-941-9381 


Website: KIMBLECHARTINGSOLUTIONS.COM 


follow on Twitter 


See our latest webinar


Wednesday, October 25, 2017

VXX Short Squeezed As VIX Beta Hits -19, Highest Since September 2008

Whether it is because bond yields finally broke out of 6 month ranges, due to nerves ahead of tomorrow"s ECB tapering announcement, because the SNB is taking a long lunch break, or simply because investors finally realized that stocks have never been more expensive...


... but something odd is taking place today: selling, and nowhere is it more obvious than in the VIX ETN complex, where the VXX is suddenly caught in a vicious short squeeze.


... as the VIX is spiking, up 1.5vols to 12.63 and rising fast.


And while we recently showed that gross Vega outstanding on levered and inverse VIX derivatives including ETNs and ETFs has never been higher...


...as everyone scrambles to buy S&P calls at a rate not seen since 2007...


... here a rather striking update: as of today, the beta of VIX constant maturity futures to the S&P has been increasing during every previous selloff even as the VIX itself has crashed to record lows, and as of this moment, the beta on the vol index has never been higher. Here"s Bank of America looking at various VIX constant maturity futures for 1M, 2M and 3M contracts:


we’ve discussed how VIX constant maturity futures have become more reactive to S&P 500 selloffs than they were historically. The relationship continues to be pronounced, though it is most notable in the front part of the curve as the beta of the 1M VIX constant maturity future and the S&P is now -8.33, the most negative we’ve seen dating back to Sep-08. Furthermore, the betas of the 2M and 3M contracts are also at record levels versus the S&P 500 at -5.65 and -4.26 respectively.


And here"s the punchline: it’s also worth noting that the beta of the VIX spot index to the S&P is currently -18.99, also a record since Sep-08.


So keep a close eye on that VIX - whose response to a market selloff will be unlike anything seen in 9 years; and if the squeeze has indeed begun, all those famous vol-selling Target ex-managers, are about to lose everything.