Showing posts with label GAAP. Show all posts

Thursday, December 7, 2017

Earnings Don"t Matter After All!

Via The Knowledge Leaders Capital blog,


Our long-time readers are familiar with the work of Professor Baruch Lev of the NYU Stern School of Business, whose research forms the basis for the Knowledge Leaders investment strategy. In his decades-long study of financial records, Lev first discovered a link between a firm’s knowledge capital and its subsequent stock performance, ultimately identifying a market inefficiency that leads highly innovative companies to deliver excess returns. We call this market anomaly the Knowledge Effect.


In a new article in Financial Analysts Journal, Lev and co-author Feng Gu continue to advance the findings on intangibles. The article, “Time to Change Your Investment Model,”  identifies that earnings prediction has lost “much of its relevance in recent years.”


As a form of predicting corporate results, “earnings no longer reliably reflect changes in corporate value and are thus an inadequate driver of investment analysis.”


The basis for this shift, the authors explain, occurred after the emergence of the semiconductor.


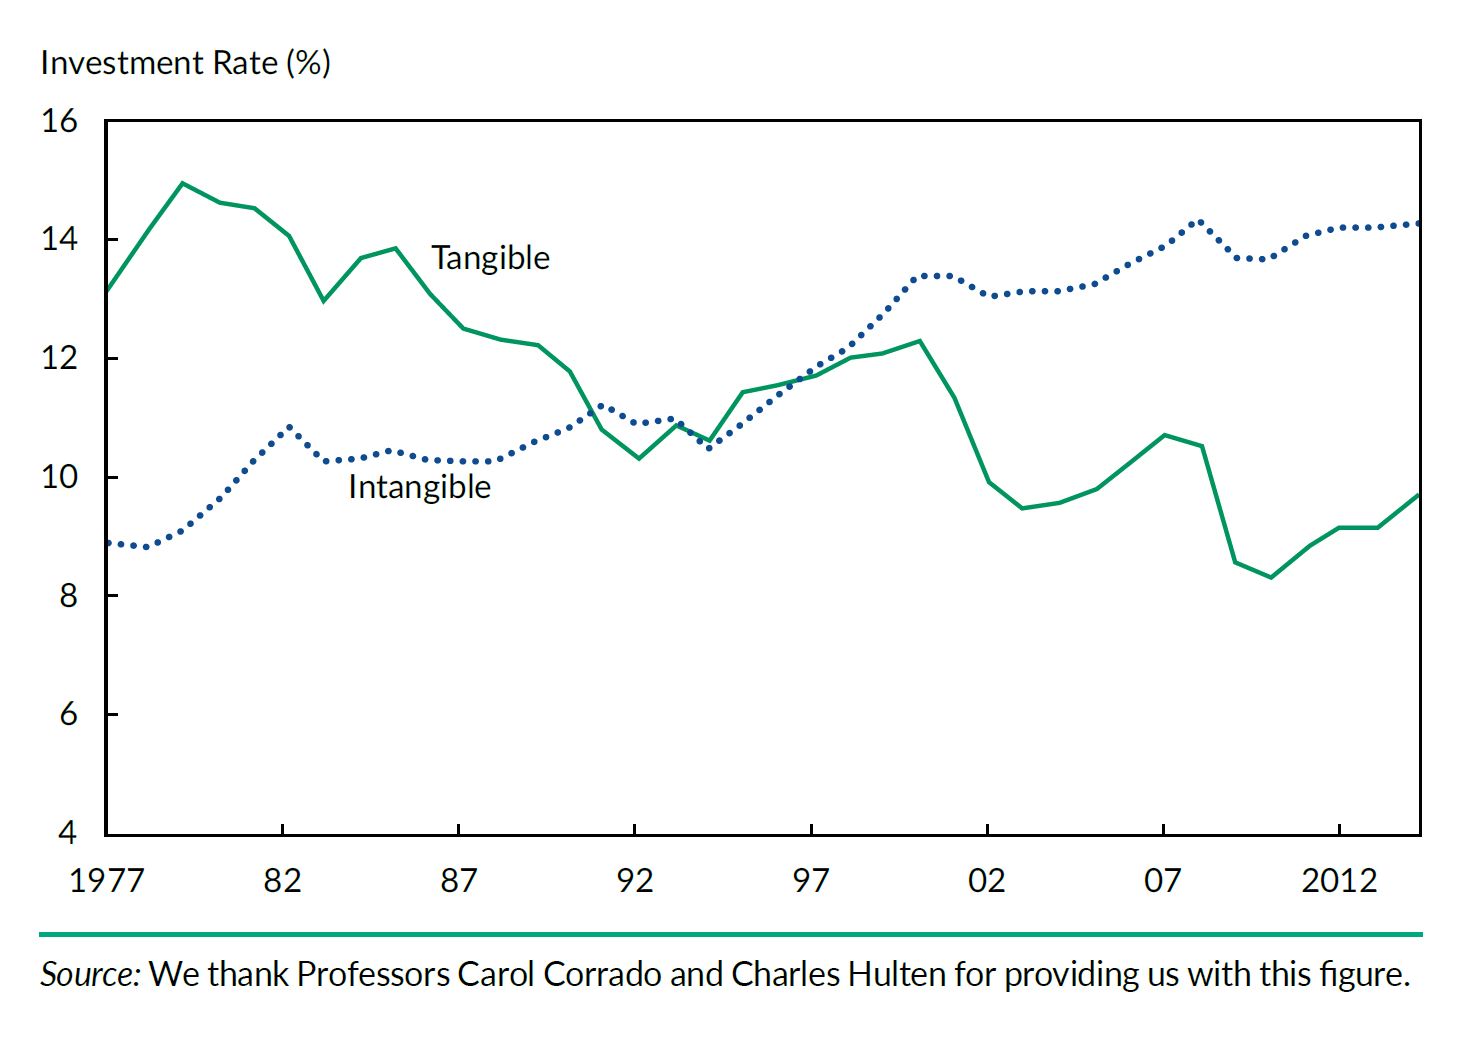
Starting in the early 1980s, investment in traditional, tangible assets (structures, factories, machinery, inventory) – considered assets by accountants and reported accordingly on the balance sheet – dropped precipitously from 15% of gross added value in 1977 to 9% in 2014, a 40% drop.


In contrast, the investment rate in intangible capital (R&D, patents, information systems, brands, media content, business processes) – mostly expensed in corporate income statements – increased continuously from 9% to 14% of added value, a 56% increase. This radical business model transformation came to be known as the knowledge – or information revolution, an irreversible trend in developed economies.”


As a result, for companies, “the only way to survive and prosper in such a competitive environment (is) through constant product and process innovation, achieved primarily by investing in intangible assets.” Therefore, “earnings’ usefulness to investors declines sharply for companies that increasingly rely on intangible value-creating assets.”


For these reasons, “GAAP-based reported earnings no longer reflect the periodic value changes (growth) of most business enterprises, and thus conventional earnings-based security analysis has lost much of its usefulness for investors in recent years.”


In summary, the authors observe:


“The disappointing returns on managed funds in recent years should raise doubts about the continued usefulness of conventional security analysis. Our extensive empirical evidence on the loss of relevance of GAAP numbers, in both this article and our recent book, confirms these doubts. Certain major investors have already departed from the status quo. … We propose a different course: Rather than replace analysts with robots, substitute an improved investment methodology for an outdated one.”


If you’re interested in reading Lev and Gu’s article, download it here. Stay tuned for more on Professor Lev’s research in early 2018 and an in-depth Q&A on his latest research on intangible capital.


Thursday, November 23, 2017

The Mother Of All Irrational Exuberance

Authored by David Stockman via Contra Corner blog,


You could almost understand the irrational exuberance of 1999-2000. That"s because everything was seemingly coming up roses, meaning that cap rates arguably had rational room to rise.


But eventually the mania lost all touch with reality; it succumbed to an upwelling of madness that at length made even Alan Greenspan look like a complete fool, as we document below.


So doing, the great tech bubble and crash of 2000 marked a crucial turning point in modern financial history: It reflected the fact that the normal mechanisms of honest price discovery in the stock market had been disabled by heavy-handed central bankers and that the natural balancing and disciplining mechanisms of two-way markets had been destroyed.


Accordingly, the stock market had become a ward of the central bank and a casino-like gambling house, which could no longer self-correct. Now it would relentlessly rise on pure speculative momentum---- until it reached an asymptotic top, and would then collapse in a fiery crash on its own weight.


That"s what subsequently happened in April 2000 when the hottest precincts of the stock market---the NASDAQ 100 stocks----began a perilous 80% dive; and it"s also what happened in the broader markets-----including the S&P 500---in 2008-2009, when a thundering 60% plunge unfolded in a hardly a year"s time.


So with the market raging in self-fueling momentum at the 2600 mark on the S&P 500, we reflect back to the great dotcom crash for vivid reminders of what happens next. That earlier meltdown is especially pertinent because in many ways today"s stock market mania is far less justified than the one back then.


Moreover, the dotcom version was also the first great central bank fueled bubble of modern times---a creature that market participants understandably did not fully grasp. Yet to its everlasting blame, the Fed"s subsequent experiments in reflationary bailouts of the casino gamblers has only caused Wall Street"s muscle memory to atrophy further.


Indeed, after 30 years of Greenspan-style Bubble Finance and two devastating crashes, Wall Street is even more credulous today than it was on the eve of the tech crash. Back then, in fact, there was a considerable phalanx of Wall Street old-timers who warned about the dotcom insanity. Now almost no one sees this one coming.


Indeed, today"s nutty forecast by Goldman Sachs that the S&P 500 will hit 3,100 by the end of 2020 makes Greenspan"s earlier bubble blindness look clairvoyant by comparison.


In hindsight, Alan Greenspan did see it coming early on--- when he broached the "irrational exuberance" topic in passing during a speech in December 1996. Unfortunately, he has mostly been dinged for being allegedly way too early in making the call.


In fact, we don"t think he was making much of a call at all---he"s was just musing out loud with no intention of reining-in the then rampaging bull. What he actually did was to conduct several gumming fests at subsequent Fed meetings and then diffidently raised interest rates a single time by a pinprick 25 basis point in April 1997.


After that the Maestro (so-called) apparently forgot all about "irrational exuberance" even as that very thing soon began infecting the entire warp and woof of the financial system.


In fact, Greenspan"s fatuous amnesia became so pronounced that by the very eve of the dotcom crash in April 2000, he proved himself blind as a bat when it comes to central bank created bubbles.


Said the Maestro to a Senate committee on April 8 when asked whether an interest rate increase might prick the stock market bubble:


That presupposes I know there is a bubble....I don"t think we can know there is a bubble until after the fact. To assume we know it currently presupposes we have the capacity to forecast an imminent decline in (stock) prices".


At least he got the latter part right. After the NASDAQ had risen from 835 in December 1996 to 4585 on March 28, 2000---or to an out-of-this-world 5.5X gain in 40 months----Greenspan wasn"t even sure he was seeing a bubble!


Accordingly, he apparently didn"t have that capacity to predict an imminent decline---although the 51% crash to 2250 by the end of the year would seem to have been exactly that.


Indeed, after unloading the above tommyrot at the tippy-top of the NASDAQ-100 bubble, Greenspan proved himself a clueless, pitiable fool when this giant bubble deflated by 81% over the next two years.


In fact, the index ended up in September 2002 almost exactly where it had been when Greenspan spoke the words "irrational exuberance" and then moved along with the Fed"s printing press at full speed---claiming there was nothing to see.


Still, back then you could almost have made a (lame) excuse for the Fed chairman"s bubble blindness. The Maestro was operating in the early days of monetary central planning and wealth effects management, and its potent capacity to unleash rampant speculation in the financial system was not yet fully understood----even if the underlying monetary theory defied all the canons of sound finance.


Moreover, in addition to rampant bubbles in the financial market, the Fed"s money pumping during the 1990s did also seem to be producing some seemingly robust real world effects on main street and in the booming new tech part of the economy.


And, in turn, these positive macroeconomic developments were unfolding in a global political/strategic environment that had suddenly become more benign that at any time since June 1914.


Indeed, the outside world fairly buzzed with positive developments. These included the fact that the internet/tech revolution still exuded adolescent vigor, the government"s fiscal accounts were nearing balance for the first time in two decades, the vast market of China was convincingly rising from its Maoist slumber and the Committee To Save the World (Greenspan, Summers and Rubin) had just rescued Wall Street with alacrity from the Long-Term Capital Management (LTCM) meltdown.


Likewise, Europe was launching the single currency and expanding the single market. In place of the Soviet Union, which had disappeared from the pages of history in 1991, Russia, its breakaway republics and the former Warsaw Pact (captive) nations were all bursting out of their statist chains and experimenting with home grown capitalism and reaching out to the west via rising trade and capital flows.


In the US, the combination of the end of the cold war and the internet revolution contributed a doubly whammy to growth and prosperity. When defense spending fell from 7% of GDP on the eve of the Soviet collapse to under 4% by the year 2000, substantial domestic resources were released for private investment and a resulting substantial productivity uplift.


In fact, real private nonresidential investment grew at 7.3% per year from the 1990 pre-recession peak through 2000. That was more than double the still respectable 3.4% rate recorded between 1967 and 1990; and causes the anemic 1.4% real growth of fixed investment between the pre-crisis peak (2007) and 2016 to pale into insignificance.


Notwithstanding all of these positives, however, the great bull stock market of the late 1990s ended-up getting way ahead of itself. That was especially the case during the next 18 months after the Fed"s heavy-handed and somewhat panicked bailout of LTCM in September 1998 had confirmed to the newly energized casino gamblers that the Greenspan Put was most definitely operative.


In the Great Deformation we tracked 12 of the highest-flying big cap stocks ("Delirious Dozen") during the period between Greenspan"s December 1996 speech and the April 2000 dotcom bust. During this 40-month period, the combined market cap of these 12 leading momo stocks---including Microsoft, Cisco, Dell, Intel, Juniper Networks, Lucent, AIG, GE  and four others---soared from $600 billion to $3.8 trillion.


That eruption did indeed give the notion of trees which grow to the sky an altogether new definition. To wit, the total market cap of the Delirious Dozen grew by 75% per annum for nearly 4 years running; and the future outlook was claimed to be even more fantastic.


For instance, as of mid-2000 Intel was valued at $500 billion and traded at 53X its $9.4 billion of LTM earnings. Yet it was argued that this nosebleed multiple was more than warranted because the company had grown its net income from $1 billion to $9.4 billion during the previous decade, and that there was nothing but blue sky ahead.


Here"s the thing, however. Intel was and is a great company that, in fact, has never stopped growing.


But during the 17 years since mid-2000, its net income growth rate has sharply slowed to just 1.79% per annum; and its $12.7 billion of LTM net income for September 2017 is valued at only 15.7X or $210 billion.


In short, at the peak of the tech bubble Intel"s market cap had vastly outrun its long run-earnings capacity. Even today it has only earned back 40% of its bubble peak valuation.


Likewise, Cisco was valued at $500 billion in July 200 and sported a 185X PE multiple on its $2.7 billion of LTM net income. And it, too, has continued to grow, posting LTM net income of $9.7 billion for September 2017.


Yet today"s earnings are accorded only a 19X multiple after 17 years of 2.4% per annum growth; Cisco"s current $181 billion market cap, in fact, sits at just 36% of its bubble peak.


Even the mighty Mr. Softie has experienced pretty much the same fate. Back in mid-2000, it posted $8.3 billion of LTM net income and was valued at $600 billion or 72X. Today its net income has tripled to $23.1 billion, but its PE multiple has receded to just 29X.


Stated differently, Microsoft"s net income has grown at 6.1% per annum since the company vastly outran it true value back in early 2000. Accordingly, its market cap gained just 0.4% per annum during the last 17 years. That is, it has taken one of the greatest tech companies of all time upwards of two decades to earn back its peak dotcom era bubble valuation.


And when it comes to the industrial and financial conglomerate empire that Jack (Welch) built, the story is even more dramatic. GE"s mid-2000 market cap of $500 billion stands at just $155 billion today; and its PE multiple of 60X has shrunk to just 22X.


In short, that was irrational exuberance back then, and it did not take long for the vast quantities of bottled air in the market cap of the Delirious Dozen to come rushing out. By the bottom in September 2002, four of these companies had vanished into bankruptcy and the market cap of the survivors had imploded to just $1.1 trillion.


That"s a fact and you can look it up in the papers. In less than 30 months, $2.7 trillion of market cap had literally ionized.  And these were the leading companies of the era.


None of them, it might be noted, were valued at 280X shrinking net income, as is Amazon today; or at infinite PE multiples like much of the biotech sector and momo hobby horses like Tesla.


More importantly, the promising macro-economic situation at the turn of the century has given way to a world precariously balanced on $225 trillion of debt and the tottering $40 trillion Red Ponzi of China.


Likewise, the benign geo-strategic environment of that era has long since disappeared into the madness of RussiaGate, endless wars in the middle east and Africa and the incendiary confrontation between the Fat Boy and the Donald on the Korean peninsula.


Finally, after 30 years of rampant monetary expansion the central banks of the world have been forced to reverse direction and begin to normalize interest rates and balance sheets.


And that now incepting and unprecedented experiment in massive demonetization of public debts is coming at a time when----after 8 years of business cycle expansion---the US, Japan and most of Europe are running monumental "full-employment" budget deficits.


Even then, these reckless fiscal policies are happening in the teeth of a demographically driven tsunami of pension, medical and welfare spending.


For the period just ended, the S&P 500 companies earned $107 per share on an LTM basis---or just 2% more than the $105 per share posted back in September 2014; and also only modestly more than the $85 per share recorded way back at the June 2007 pre-crisis peak.


Stated differently, on a trend basis S&P 500 companies have grown their earnings at 2.33% per annum over the last decade. How that merits a 24.3X PE multiple on today"s 2600 index price is hard to fathom---let alone Goldman"s 3100 target for 2020.


Indeed, just to retain today"s absurd PE multiple would require $130 per share of GAAP earnings by 2020 at the Goldman target price.


That"s right. By the end of 2020 we would be implicitly in the longest business expansion in recorded history at 140 months (compared to 118 months in the 1990s),


Furthermore, the term structure of interest rates will be 200-300 basis points higher according to the Fed"s current policies, while the US treasury will be running $1 trillion plus annual deficits and experiencing recurring debt ceiling and financial crises.


Even then you would need 7% annual earnings growth to hold onto today"s 24.2X PE multiple at the Goldman S&P 500 target.


As we said, relative to today"s casino madness and the Goldman fairy tale hockey stick, Alan Greenspan circa April 2000 looks like a model of sobriety by comparison.


So if that was Irrational Exuberance back in April 2000, what we have now is surely the mother thereof.


Tuesday, November 21, 2017

Morgan Stanley: Tesla Will Surge To $400 Before Crashing To $200

When it comes to Wall Street cheerleaders, Tesla has few closer friends than Morgan Stanley"s Adam Jonas (current price target of $379). To be sure, the relationship cuts both ways, with Jonas relentless enthusiasm "for the EV maker granting Morgan Stanley a reserved spot for any future debt, convert and equity underwriting, as well as associated IB fees.  Yet, following the recent volatility in Tesla"s business model, in which the "production hell" that is Model 3 has been quietly relegated to the latest and greatest hype involving the company"s truck (funded in turn by deposits for the new Tesla $250,000 flying roadster) as well as stock price, not even Jonas can pretend that it"s smooth sailing ahead.


And so, in his latest forecast released overnight which has the same interval of confidence as a bitcoin price prediction, Jonas previews the stock performance of Tesla over the coming year, writing that he expects "Tesla shares to be extremely volatile in 2018, divided into two stages: (1) The alleviation of production bottlenecks with strong cash inflow, and (2) mounting concerns over the sustainability of the competitive moat."


His enthusiasm is even more constrained in his thesis:


Our Equal-weight rating on Tesla expresses our view that any number of positive and negative forces influencing the stock are more or less in equilibrium. While our $379 price target offers 20% upside from current levels, we believe such upside is less interesting on a risk-adjusted basis. From a shorter-term trading perspective, we anticipate Tesla’s stock price may  reach highs in the range of $400 or more over the next few months before facing some more serious headwinds later in the year that could take the stock significantly below current levels.


While the upside forecast is hardly new for Jonas, the downside is certainly a headscratcher for the TSLA faithful, because if Musk is suddenly left without his biggest Wall Street fan, who else is left to drum up interest in a business model that would send PT Barnum in an orgasm of shivering delight.


And just in case there is some doubt about Jonas" sincerity, he provides the following five bullets to justify why even he has gotten cold feet:


  1. It is our working assumption that Tesla’s battery module production bottlenecks may be resolved in weeks. It is not possible to prove precisely when problems with zone 2 will be overcome, if they ever are at all. There is only evidence that Tesla is throwing its human and financial capital at the problem. Elon Musk stated that it is better to be late and get it right than to be early and get it wrong. We agree. Tesla is trying to make battery packs with extremely high levels of volume and unprecedented automation with bespoke high-speed robotics. In high-volume battery manufacturing, robotics is a core competency and a competitive advantage.

  2. We believe that Tesla baked in flexibility to allow for a highly unpredictable production ramp. Tesla’s Model launch timeline was always seen as extremely aggressive. When the July 2017 launch date was originally communicated to the market, we had seen it as a stretch goal and a form of supply chain management to increase the probability of a successful volume ramp in 2018. Given Tesla’s experience with the Model S and X launches and the unprecedented level of vertical integration and automation of the battery assembly, we believe Tesla had negotiated unusual levels of flexibility with its supply base compared to its prior launches and the industry standard.

  3. The motivation of the Tier 1 and Tier 2 supplier base to be involved with the Model 3 project is a relevant factor in de-risking the ramp. It is our understanding that the Model 3 has been seen as a ‘trophy contract’ for the supply base. For any Tier 1 supplier wanting to be associated with the cutting edge of automotive technology (electric, autonomous) the Model 3 was a ‘must win.’ Tesla’s early success with Model S had a profound impact on its image in the supplier community. Where suppliers previously viewed Tesla with high degrees of  skepticism/trepidation, many of the same suppliers were willing to prioritize supply of key systems and even to colocate key production facilities near Tesla’s factory. We believe flexibility on working capital during the sensitive early ramp phase could have reasonably been a part of the negotiation process.

  4. The Model 3 working capital arrangement may be highly favorable to Tesla, at least in the short term, during the inflection of the ramp… substantially alleviating concerns over near term liquidity. Like many auto OEMs, Tesla pays its suppliers over many weeks (as long as 60 to 90 days depending on the supplier) while it collects from its customers far faster, particularly given Tesla’s ownership of its distribution channel. Tesla’s own financials bear this out as it collects on its receivables 10 to 20x faster than it pays its suppliers. During times of fast production growth (as we’d expect through 1Q/2Q18), this can pull forward significant amounts of cash which can serve to address much of the market’s concerns over near-term liquidity.

  5. Following a hypothetical 1H18 pop in the share price, we could see scope for longer-term risks in the story to come to the fore. The key drivers of our downgrade last May are 2-fold: (1) our view that the global addressable market may not be as accessible as the market expects, and (2) increasing encroachment from consumer electrics and mega-tech firms who are planning comprehensive strategies focused on shared, electric and autonomous transport systems in direct competition with Tesla. We expect a steady and increasing amount of evidence to hit the market as 2018 develops that could stunt the enthusiasm of surmounting the Model 3 production hurdles. Admittedly, we cannot be precise with the timing of positive (1H) and negative (2H) catalysts that could move the stock significantly in the quarters ahead, leaving us EW on the stock.

As a result of the above, Jonas now assumes only 1,000 Model 3 deliveries in 4Q, down from 10,000 deliveries previously. That said, he leaves his 2018 forecast of 120,000 Model 3  deliveries unchanged, and some more details: 


We took 2018 GAAP operating profit from ($688) to ($1,001). Our 2018 GAAP EPS (ex stock comp) estimates went from ($3.66) to ($6.17) and our US GAAP EPS estimate went from ($6.58) to ($9.00). From 2018 through 2020, our average GAAP OP forecast moved from positive $280mm to negative $70mm. From 2021 through 2025, our average GAAP OP forecast moved from $4,491 to $4,242…. A 5% cut. The cuts are even smaller in the out-years. Our Tesla Mobility forecasts remain unchanged. We roll forward our DCF start date to December 1st, and our price target remains unchanged at $379


As of this moment, investors appear just as confused about Tesla"s future as its former biggest fanboy, located almost exactly halfway betwen the two stated extremes...


Monday, November 20, 2017

The Difference Between GAAP And Non-GAAP Q3 EPS For The Dow Jones Was 16%

The last time we looked at the near-record difference between GAAP and non-GAAP Dow Jones earnings, we found that it had crept to a (virtually) unprecedented 25%. To be sure, that was exactly one year ago, when the economy was perceived as being in worse shape than it is now, thanks to the narrative of a "global coordinated recovery" which is really just record central bank liquidity injections, and Chinese credit creation, both of which have recently hit the brakes.


That said, going back to the question of GAAP vs non-GAAP divergence, one would assume that in light of the so-called global recovery of 2017, company earnings would be more real and not the "pro forma, one-time, non-recurring" fabrication that US corporations are so fond of. Alas, one would be wrong.


As Factset"s John Butters writes in a recent blog post, as of today, all of the companies in the Dow Jones Industrial Average (DJIA) have reported actual EPS for Q3 2017, which brings up several questions: what percentage of these companies reported non-GAAP EPS for Q3 2017? What was the average difference and median difference between non-GAAP EPS and GAAP EPS for companies in the DJIA for Q3 2017? How did these differences compare to recent quarters?


Here are the answers:


For Q3 2017, 21 (or 70%) of the 30 companies in the DJIA reported non-GAAP EPS in addition to GAAP EPS for the third quarter. Of these 21 companies, 16 (or 76%) reported non-GAAP EPS that exceeded GAAP EPS. Over the past six quarters (Q1 2016 – Q2 2017) 68% of the companies in the DJIA reported non-GAAP EPS in addition to GAAP EPS and 80% of these companies reported non-GAAP EPS that exceeded GAAP EPS.


Thus, slightly more companies in the DJIA reported non-GAAP EPS in Q3 2017 relative to the average of the past six quarters, while slightly fewer companies in the DJIA reported non-GAAP EPS above GAAP EPS in Q3 2017 relative to the average over the past six quarters.


For Q3 2017, the average difference between non-GAAP EPS and GAAP EPS for all 21 companies was 284.1%, while the median difference between non-GAAP EPS and GAAP EPS for all 21 companies was 10.1%. The average difference between non-GAAP EPS and GAAP EPS for the DJIA was unusually large in the third quarter because of Merck. The company reported non-GAAP EPS of $1.11 and GAAP EPS of -$0.02 for the quarter. Thus, the percentage difference between non-GAAP EPS and GAAP EPS for Merck for Q3 exceeded 5000% (on an absolute basis).


So let"s normalize: excluding Merck, the average difference between non-GAAP EPS and GAAP EPS for the remaining 20 DJIA companies was 15.8%. How does that number look in context: Over the past six quarters, the average difference between non-GAAP EPS and GAAP EPS for companies in the DJIA was 72.8%, while the median difference between non-GAAP EPS and GAAP EPS was 13.4%.


Finally, if one takes the average of the median DJIA median differences for the past 4 quarters (LTM), one gets just over 14% (and 15.8% if "normalizing" the latest quarter"s data).


This means that while the forward non-GAAP P/E multiple may be 18x based on a 33.4 (non-GAAP) S&P EPS, if one assumes that roughly 14% of the latest earnings, and those projected for the next 5 quarters, are "fluff" then applying a 14% haircut to the forward consensus EPS of 143... 


... which amounts to 123 in EPS for the S&P500 - then the market"s forward GAAP PE multiple is 21x. With the exception of the pre-dot com burst, the market"s forward P/E multiple has never been that high.


Monday, August 14, 2017

Stock Market Warning Siren Is Blaring

Authored by Wolf Richter via WolfStreet.com,


Are we blinded yet by the brilliance of corporate earnings?


“Adjusted” earnings growth is 10.2% year-over-year in the second quarter, according to FactSet, based on the 91% of the companies in the S&P 500 that have reported results. The energy sector was a key driver, with 332% “adjusted” earnings growth from the oil-bust levels of a year ago.


The sectors with double-digit earnings growth: information technology (14.7%), utilities (10.8%), and financials (10.3%). The rest were single digit. Earnings in the consumer discretionary sector declined.


Revenues grew 5.1%, also led by the energy sector. At the beginning of Q2 last year, the WTI grade of crude oil traded at $35 a barrel. In Q2 this year, WTI ranged from $42 to $53 a barrel.


So the Wall-Street hype machine is cranking at maximum RPM to propagate the great news that earnings are soaring, and that this is the reason why stocks should also be soaring, and forget everything else. The hype machine carefully avoids showing the bigger picture which is dismal for earnings and ludicrous for stock valuations.


Aggregate earnings per share (EPS) for the S&P 500 companies on a trailing 12-months basis rose for the second quarter in a row.


That’s the foundation of the Wall Street hype.


But here’s the thing with these EPS: they’re now back where they had been in… May 2014.


Yep. More than three years of earnings stagnation. No growth whatsoever, even for “adjusted” earnings. In fact, on a trailing 12-month basis, aggregate EPS of the S&P 500 companies are down about 5% from their peak in Q4 2014. And yet, over the same three-plus years of total earnings stagnation, the S&P 500 index has soared 34%.


This chart shows those “adjusted” earnings per share for the S&P 500 companies (black line) and the S&P 500 index (blue line). Chart via FactSet (click to enlarge). I marked August 2012 as the point five years ago, and May 2014:


And these are not earnings under the Generally Accepted Accounting Principles (GAAP). FactSet uses “adjusted” earnings for its analyses. These are the earnings with the bad stuff “adjusted” out of them by management to manipulate earnings into the most favorable light. Not all companies report “adjusted” earnings. Some only report GAAP earnings and live with the consequences. But others put adjusted earnings into the foreground, and that’s what Wall Street dishes up.


Since August 2012, the trailing 12-month “adjusted” earnings per share of the companies in the S&P 500 index rose just 12% in total. About the rate of inflation – nothing more. Over the same five years, the S&P 500 Index soared 72%.


And there’s another thing: these earnings per share are heavily influenced by the share count. Companies have been on a huge borrowing binge over these years, fueled by historically low interest rates, and a big part of that borrowed money wasn’t used to create new things, expand, invest, or invent, but to buy back their own shares. This type of financial engineering lowered the share count, and thus artificially increased earnings per share. Growth in EPS due to financial engineering is fake earnings growth.


This is the peculiar situation of today: On average, these companies have stagnating earnings per share propped up by “adjusting” these earnings and by financial engineering. The price-earnings multiple (P/E ratio) for stagnating companies should be low. In January 2012, the P/E ratio for the companies in the S&P 500 index was 14.9. And that was high. As of Friday, the aggregate P/E ratio is 24.3:


But look what happened. The P/E ratio peaked in March at 26.6. Since then, the S&P 500 has ticked up 3% and earnings have risen to this glorious level Wall Street has been hyping and the P/E ratio has come down a wee tiny bit…. back to where it had been in the fall of 2016.


In the five-year picture, earnings per share – however doctored they’d been – expanded just 12%. But share prices skyrocketed 73%. And thus the P/E ratio soared. These phases of “multiple expansion” are part of the stock market’s boom and bust cycle. They’re invariably followed by periods of multiple contraction.


Multiple contraction doesn’t stop at the average long-run P/E ratio but falls far below it, because that’s how the long-run average P/E ratio is formed: by periods far above the average (right now) and by periods far below the average. In the past, this type of multiple contraction from the top of the range to the lower end of the range – the process of “reversion to the mean” – offered some hair-raising rides for the stock market overall and for ludicrously overvalued stocks in particular, with many money-losing companies not making it to the next phase.


No one knows the date when this process kicks off in earnest, though everyone wants to know it so they can scurry out of the way beforehand. But when enough folks are trying to scurry out of the way, they’ll will precipitate the beginning of that process. That’s always how it happens.


The last big enthusiastic buyer, China, is leaving the party. Read…  This Hits the Wheezing Commercial Real Estate Bubble at Worst Possible Time

Monday, August 7, 2017

Elevated 2018 Estimates Widen Gap Between GAAP & Non-GAAP Earnings

Via Hedgopia.com,


As of last Thursday, a little over four-fifths of S&P 500 companies reported 2Q17 results.  Of the 422 companies, 70.1 percent beat on operating earnings, 20.6 percent missed and 9.2 percent met, as per S&P Dow Jones Indices.


In the latest week (through Thursday), 2Q17 estimates went up by $0.33 week-over-week to $31.03.  When the quarter came to an end, estimates were $30.97.  Going back many quarters, actual earnings have come in lower than expected at the time of the quarter-end.  From this perspective, the hitherto 2Q17 trend is an improvement, although one-fifth are yet to report.


The increase in 2Q17 estimates also helped push up 2017 estimates by $0.13, to $127.64, even as 2018 went down by $0.40 to $144.77.  More important perhaps is the revision trend, which is down.


In January last year, 2017 was expected to come in at $141.11.  In January this year, 2018 estimates were $147.21 (Chart 1).


The downward trend in 2017/2018 estimates is nothing new, considering how 2015 and 2016 fared.  In both those years, actual operating earnings were substantially less than the sell-side’s original estimates.


As things stand, 2018 expectations look way elevated.


There is a tight correlation between GDP and corporate profits.


U.S. corporate profits adjusted for inventory valuation and capital consumption peaked at $2.23 trillion in 4Q14, with 1Q17 at $2.11 trillion.  Since that peak, profits fell year-over-year in five quarters and rose in four, including gains of 3.3 percent in 1Q17.


Growth in real GDP peaked around the same time – in 3Q14, when the economy expanded at a 5.2 percent annual rate.  In 2Q17, it grew 2.6 percent.  This was higher than the post-Great Recession average of 2.2 percent, but much lower than the long-term average of 3.2 percent going back to 2Q47.


The economy is in its ninth year of recovery.  Expecting it to accelerate at this time is probably a risky bet.  That said, 2018 earnings estimates probably do exactly that.


Valuation multiples are priced off of these estimates.  Stocks are at/near all-time highs, with elevated multiples.  Using trailing 12-month numbers as of 1Q17, the S&P 500 traded at 21.3 times operating and 23.6 times reported earnings.


Hence another equally important question, how clean are these estimates?


Chart 3 plots both operating (non-GAAP) and reported earnings (GAAP) of S&P 500 companies going back to 4Q10.  (Except for the lighter-shade bars within the blue box, these are actual numbers.)


One distinct trend in particular since 4Q14 is that the gap between the two is widening.


Companies are required to report GAAP earnings, not non-GAAP.  Non-GAAP numbers are reported by the reporting company, but they do reconcile the two.


There are times companies have perfectly good reason to request/ask analysts/investors to ignore certain items.  Irregular or non-cash expenses or one-time charges, for example.


Restructuring expenses, stock-based compensation, goodwill amortization are some of the non-GAAP exclusions.  In general, this does tend to smooth out earnings volatility.


The problem arises when this becomes a permanent fixture.  Stock-based compensation among many tech outfits, for example.


Chart 4 subtracts operating earnings of S&P 500 companies from reported earnings going back to 1988.


The difference was minuscule at the beginning.  It began to grow circa 2000, and has stayed.  In both 2002 and 2008, GAAP took a massive hit, as assets got impaired, so both these years are more of an outlier.  But even excluding these, the trend is not getting better.  The discrepancy between GAAP and non-GAAP is not narrowing.


This raises questions about the quality of non-GAAP earnings, which is what the investing community in general focuses on.  This gap is easy to ignore in good times, but maybe not so when bad times hit.

Saturday, July 22, 2017

David Stockman Warns The Market's "Chuck Prince Moment" Has Arrived... "Only More Dangerous"

Authored by David Stockman via Daily Reckoning,


On July 10, 2007 former Citigroup CEO Chuck Prince famously said what might be termed the “speculator’s creed” for the current era of Bubble Finance. Prince was then canned within four months but as of that day his minions were still slamming the”buy” key good and hard:


“When the music stops, in terms of liquidity, things will be complicated. But as long as the music is playing, you’ve got to get up and dance. We’re still dancing,” he said in an interview with the FT in Japan.


We are at that moment again. Only this time the danger of a thundering crash is far greater. That’s because the current blow-off top comes after nine years of even more central bank policy than Greenspan’s credit and housing bubble.


The Fed and its crew of traveling central banks around the world have gutted honest price discovery entirely. They have turned global financial markets into outright gambling dens of unchecked speculation.


Central bank policies of massive quantitative easing (QE) and zero interest rates (ZIRP) have been sugar-coated in rhetoric about “stimulus”, “accommodation” and guiding economies toward optimal levels of inflation and full-employment.


The truth of the matter is far different. The combined $15 trillion of central bank balance sheet expansion since 2007 amounts to monetary fraud of epic proportions.


The massive injection of fiat credit has drastically falsified prices in the debt and money markets. Through the channels of cap rates, carry trades and corporate financial engineering, the prices of equities and all other risk assets, have been falsified too.


20 Years of Massive Central Bank Bond Buying


Bond and stock prices are way too high, and that reality has infected the very foundations of the financial system. Like the hapless Chuck Prince last time, today’s traders and robo-machines have lost all contact with the fundamentals of corporate performance, macroeconomic outlooks and the political risks of a Washington.


Traders today are just dancing – blindly. That’s why the Russell 2000 hit 1442 the other day, capitalizing the earnings of small and mid-cap domestic companies at 87.5 times.


That’s crazy in its own right. As measured by valued added output of the U.S. business sector, the main street economy – where most of these companies live — has expanded at a tepid 2.1%  annual rate since 2002. By contrast, the RUT index has increased by 10% per annum since then.


At the same time, the level of speculation in the hyper-momentum tech stocks is even more stunning.


We are in the blow-off stage of the Fed’s third and greatest bubble of this century. Yet the stock market has narrowed drastically during the last thirty months, as is typical of a speculative mania. This narrowing means that the price-earnings ratio (PE) among the handful of big winners have soared.


FAANGs and Bubble Finance


In the case of  the so-called “FAANGs + M” (Facebook, Apple, Amazon, Netflix, Google and Microsoft), the group’s weighted average PE multiple has increased by 50%.


That’s caused the market cap of these six super-momentum stocks to soar from $1.7 trillion to $3.1 trillion during the period or by 82%.


The combined earnings of the group have grown by just 20%. 75% of this huge gain in market cap is attributable to multiple expansion, not operating performance.


The degree to which the casino’s speculative mania has been concentrated in the FAANGs + M  can also be seen by contrasting them with the other 494 stocks in the S&P 500. The market cap of the index as a whole rose from $17.7 trillion in January 2015 to $21.2 trillion at present, meaning that the FAANGs + M account for 40% of the entire gain!


If this concentrated gain in a handful of stocks sounds familiar that’s because this rodeo has been held before. The Four Horseman of Tech (Microsoft, Dell, Cisco and Intel) at the turn of the century saw their market cap soar from $850 billion to $1.65 trillion or by 94% during the manic months before the dotcom peak.


At the March 2000 peak, Microsoft’s PE multiple was 60 times, Intel’s was 50 times and Cisco’s hit 200 times. Those nosebleed valuations were really not much different than Facebook today at 40, Amazon at 190 and Netflix at 217 times PE.


The point is, even great companies do not escape drastic over-valuation during the blow-off stage of bubble peaks.


That spectacular collapse was not due to a meltdown of their sales and profits. Like the FAANGs +M today, the Four Horseman were quasi-mature, big cap companies that never really stopped growing.


For example, Cisco’s revenues have increased from $15 billion to $50 billion annually during the last 17 years and its net income has tripled to $10 billion. Yet Cisco’s market cap today is just $160 billion or only 30% of its 17-years ago bubble peak.


The reason is PE normalization. In this case, the company’s hideously inflated 200 times PE multiple imploded with the tech crash. It now stands at 15 times PE.


Amazon and the Chuck Prince Market Redux


Amazon is now set for that kind of PE implosion during this cycle. It’s stock price doubled from $285 per share in January 2015 to $575 by October of that year; and then it doubled again to $1026 in the 20 months since.


Along the way it picked up a hefty $350 billion in added market cap. That’s nearly $12 billion of value gain per month!


Amazon is now 24 years-old, not a start-up; and it hasn’t invented anything explosively new like the iPhone or personal computer. Yes, it is taking retail market share by leaps and bounds, but that’s inherently a one-time gain that can’t be capitalized to infinity.


Indeed, 91% of its sales involves sourcing, moving, storing and delivering goods — a sector of the economy that has grown by just 2.2% annually in nominal dollars for the last decade.


Amazon embodies the speculative mania of the current market. It is simply ludicrous to put a multiple of 190 times PE on a company that runs a profitless $130 billion e-Commerce sales juggernaut.


Even as its stock price has tripled during the last 30 months, AMZN has experienced two sharp drawdowns of 28% and 12%, respectively. As shown in the first chart below, both times it plunged to its 200-day moving average in a matter of a few weeks.


A similar drawdown to its 200-day moving average today would result in an immediate 16% sell-off. But when, not if, the broad market plunges into a long overdue correction the ultimate drop will exceed that by a greater magnitude.


200-day Moving Average Amazon


In the meanwhile, the market mindlessly melts-up because the Fed has destroyed all of Wall Street’s natural forces of financial discipline. Eight years of central bank money printing and intrusion have destroyed short-sellers and caused day-traders and robo-machines to be wired to buy every dip.


Never mind about the gong show in Washington. Or even the fact that the Keynesian economists in the Fed’s Eccles Building does actually intend to normalize rates and shrink the Fed’s balance sheet.


The talking heads wandering around Wall Street have come to the delusional belief that the bubble can live forever without help from Washington or the Fed.


With only a small share of companies having reported, LTM earnings for the S&P 500 have already dropped below $105 per share on a GAAP basis. That’s still below the $106 per share posted way back in September 2014 and barely above the $100 per share reported in 2013.


What Earning Growth Oil Material Busy Cycling


Make no mistake, this is the Chuck Prince Market Redux. Only the daredevils and Wall Street dancing machines would dare buy the S&P 500 at 25 times PE, the Russell 2000 at 88 times PE, Amazon at 190 times PE.


For everyone else, the present blow-off top is surely a godsend.


Never has there been a better opportunity to get out of harm’s way, nor a clearer warning that a thundering crash is waiting just around the bend.

Saturday, June 17, 2017

Netflix Now Has More Subscribers Than Cable

Despite going all-in on Adam Sandler content – a bizarre choice - Netflix has managed to continue growing its subscriber base, recently reaching a new milestone: It now has more paying customers than Comcast Corp., Charter Communications and all other US cable companies combined.


As Forbes reports, Netflix now has 50.85 million subscribers, surpassing cable"s 48.61 million. There is one caveat, though: Cable’s total doesn’t include minor cable networks, which could amount to 5% of total customers.


Over the past five years, Netflix has managed to more than double its subscriber base from 23.4 million in the first quarter of 2012. But growth has slowed recently due to intensifying competition from a host of rival streaming services, causing Netflix to miss both its domestic and foreign subscriber targets for the first quarter.


Here’s a summary of Netflix"s Q1 results:


1Q revenue $2.64b vs est. $2.65b


1Q GAAP EPS 40c vs 37c


1Q domestic streaming net adds 1.42 million, vs consensus est. 1.59MM vs company forecast 1.5MM


1Q international streaming net adds 3.53MM consensus est. 3.90m vs company forecast 3.7MM


2Q GAAP EPS forecast 15c vs est. 23c


2Q revenue forecast 2.755BN  vs est. $2.76BN


Luckily for American cable companies, the battle for subscribers isn’t a zero-sum game. Here"s Forbes:


While cable subs are down by 4 million in the same five years that Netflix has seen huge growth, that"s not a massive drop off. It"s also worth bearing in mind that cable TV makes up only 50% of total TV viewership in pay TV. That said, Q1 2017 shows a net loss in subscriptions while Q1 2016 saw cable grow a little.


Satellite TV is doing okay, with around 38 million subscribers. Dish Network added 318,000 customers in Q1 with Direct TV stalling with gains that didn"t outpace customer loses. Satellite is still growing faster than cable though.


Faster still though are the internet-delivered services like Sling TV and Direct TV now which have added 350,000 in Q1. These services now have 1.7 million customers between them, and it"s likely that this segment will continue to see growth as customers move away from cable TV.


Cable, satellite and internet streaming services in the US have a combined 93.3 million subscribers. Even as Netflix expands into more foreign markets, it likely won’t match that total any time.


To be sure, the Netflix to cable comparison isn’t really fair to the cable companies: While the exact cost depends on the specific package, monthly fees associated with cable are typically many times more expensive than Netflix"s $10 fee.


Which brings us to our next, and final topic: Slowing subscriber growth isn’t the only metric that makes Netflix"s critics uncomfortable. The company’s unprecedented cash burn is another major red flag. In Q1, the company burned $422 million, which while less than the record $640 million burned in Q4 (over $1 billion in the last 6 months) was $160 million than its cash burn from a year ago. The company still expects to burn a total of $2 billion for the full year.


Here’s how the company explains it:


Free cash flow in Q1’17 was -$423 million vs. -$261 million in the year ago quarter and an improvement from -$639 million in Q4’16. The growth in our original content means we continue to plan to have around $2B in negative FCF this year.


We have a large market opportunity ahead of us and we’re optimizing long-term FCF by growing our original content aggressively. Negative near-term FCF is the result of the big increases in our original content, combined with small but growing operating margins. Since we want our operating margins to grow slowly so we can spend enough to quickly grow revenue and original content, we anticipate negative FCF to accompany our rapid growth for many years.


Our operating margins are our key indicator of improving global profitability; they are already growing and we plan to keep them growing for many years ahead. Eventually, at a much larger revenue base, original content and revenue growth will be slower, and we anticipate substantial positive FCF, like our media peers.


It remains to be seen if the transition from massive cash burn to cash flow positive is as simple as the company expects it to be.

Thursday, May 11, 2017

6-Month Window & A Fiscal Fumble? Things That Don't Matter Could Matter Again...

Authored by Jason Leach via FusionPointCapital.com,


The first six to nine months of a presidential term are arguably the most important thanks in large part to staggered elections put in place by our forefathers. The Bush tax cuts, Clinton"s tax hikes, and the serious groundwork for Obamacare were accomplished during this time frame. President Trump and a balkanized Republican party have taken on ACA repeal/replace during this critical six month window, aiming to use fiscal year 2017 reconciliation (simple Senate majority but “nuclear” to cooperation) to get something passed before the Fall (the current House bill is dead on arrival in the Senate). Then, after this self-immolation, they aim to use the same reconciliation process to get something done on tax reform in fiscal year 2018 (they have a one-pager to work off as of now), and hope to tack on infrastructure and ongoing deregulation going into the 2018 midterm campaign season.


In the last four years, perhaps the least cohesive congress in history has passed the least legislation in over 200 years. After Obamacare passed (via reconciliation) and the subsequent killing of the use of earmark horse trading to corral votes (remember Nebraska?), the 2010 Tea Party insurgence became the “All Pros of No”, or the shutdown defense against anything serious getting done during Obama"s remaining years. Now, the six month window will probably close without real structural change to healthcare, tax reform will then likely be pushed into 2018/2019 (and be “tax relief” not reform), and infrastructure could well fall prey to pre-midterm stasis (Democrats not throwing a lifeline to “Reconciliation Republicans”).


Meanwhile, with a string of solid jobs numbers (despite anemic sub 3% growth in average hourly earnings instead of hoped for 3-5% to outpace inflation), the Fed is intent on making the “fiscal hand off”, with two rate hikes in the last six months (and unless rumors of Fed nervousness about the deteriorating credit situation are true) another hike in June (market is pricing in ~70%). Remember “Three Steps and a Stumble” from Pulling Awesome Forward? And, after seven years of feeding another asset pricing cycle (stocks, real estate) instead of productive “virtuous” cap ex cycle (outside the oil patch discussed in Crude Compression), the Fed plans to start reducing the size of the bloated $4.5 trillion balance sheet starting at the end of the year. Ben Bernanke expressed this past week that he is “calm about unwinding part of the balance sheet”, but he neglected to mention that no country has ever exited QE, so it may get rocky (if it happens at all as many view QE as a permanent part of central bank policy at this point).


After the election, consumer sentiment ("soft data") reached 17-year highs, and small business sentiment surged to 2004 levels, recording the biggest one month surge since 1980 in January. These “animal spirits” propelled markets to new highs just this past week, despite the Atlanta Fed"s GDPNow first quarter 2017 GDP forecast (that is, “hard data”, not sentiment) coming in at a severely revised down 0.2%. Consumer spending continues to lag sentiment with consumption at its lowest level in seven quarters. Business and consumers are sentimental but the virtuous cycle is not in gear. It"s just the annual first quarter blip right…


Let"s Talk About Credit…


It"s curious that the rise in LIBOR, affecting everyone with a credit card and an adjustable rate loan, is being overlooked by so many. The credit canary in the coal mine is wheezing a bit and with delinquencies on all loan bases rising - subprime mortgage, autos, and Capital One confirmed subprime credit cards are starting feel the pain (remember the Capital One turn in "06?).


That said, financial conditions and the overall market cycle has been a big focus at Fusion Point Capital. Chief Market Technician Arun S. Chopra CFA CMT has been keeping members in front of the cyclical process through a variety of longer term indicators. This is paramount at this stage of the cycle.


Some of the things Arun and I have been watching related to the overall macro story.


  • Libor and the dollar started rising in 2014, the end of QE expansion, the start of tightening conditions that crashed commodities (i.e., oil), led to a string of Yuan devaluations and roiled markets (LIBOR is up 5X from bottom and double from one year ago, and is the effective borrowing cost for dollars worldwide).

  • The dollar is now sitting on its rising 50 week moving average, an important overall trend level and signal (the Trump team has been talking down the greenback of late, we will see, but a move back up in the Indomintable Dollar is deflationary and oil could get hit again along with high yield, multi-national earnings, Emerging Market debt, etc.)

  • At the same time in 2014, we saw the yield curve peak (i.e., potential peak in economic expansion as flattening yield curve presages economic downturns)

  • There is still a 1% spread between the short and long end of the yield curve (before inversion), which can change quick depending on macro trends. 


Markets, Valuations, and Sentiment


Forward Street earnings are resurgent on “rebounding” oil (not so much anymore), anticipated tax cuts, infrastructure and deregulation – the reflationary “fiscal hand off” – all of which are looking like they are not occurring in 2017, and increasingly unlikely in anticipated form in the first half of 2018. Full year S&P 500 earnings for 2016 came in at $106. Current full year earnings estimates are $130 for 2017 and $147 for 2018, implying 23% earnings growth in 2017 and another 13% in 2018.


Citi estimated recently that every 1% of tax rate reduction adds roughly $1.75 of full year EPS to S&P 500. A significant amount of the 23% earnings growth anticipated above is based on the Trumponomics “reflation” and tax reform. Again, it does not look like it is coming soon, if at all in substantive form so take a hair cut to that S&P 2017 and 2018 earnings estimates of $130 and $147?


The much maligned non-timing tool of PE10 stands near its second highest level ever at ~30x and trailing P/E is ~25X. Remember, higher P/Es are justified by low rates and NPV (the TV says so). Additionally, and this is a point of emphasis, fully 96% of companies are now reporting non-GAAP earnings (removing “one-time” items), up from 70% in 2014, and less than 50% in 2009. That is, the one-time items boosted GAAP earnings for 2016 by 12%, to $106 from $95 – which is about the same level as 2013 when the S&P 500 traded 30% lower.


Right now, the market is easy peasie. It"s invincible - ostensibly due to overcoming every brief elevator down blip over the past 8 years of Fed asset price control. What happens when it becomes apparent there is a fiscal fumble? Things that don"t matter could possibly matter again…


Monday, January 30, 2017

The Full Breakdown Of How Trump Tax Policies Will Impact S&P Earnings

While we remain in the purely abstract, theoretical and hypothetical realm of Trump tax reform - there have been no concrete proposals floated yet, with Trump as recently as a week ago slamming the critical border-adjustment tax, only to full reverse himself on it just a few days later - Bank of America has created a useful matrix taking a deep dive into the potential (and we do underline the word potential, because at this rate Trump may spend much of his first year dealing with immigration reform and Obamacare) implications of Trump"s tax reform.


As Bank of America"s Savita Subramanian writes in a note titled "Death and Tax Reform", the BofA strategist predicts that tax reform in its entirety could add as much as $5-6 to near-term S&P 500 EPS "as benefits are front-loaded." Whether or not tax reform would be accretive to EPS is highly dependent on the implementation details, which it then analyzes. 


Starting at the top, according to Savita 2017 could be a watershed year from a tax reform perspective. Trump has continuously stated that tax reform is a priority, and there is evidence of widespread support in Congress. Tax reform could be enacted through reconciliation without the risk of being filibustered, suggesting the timing could be imminent. Corporate tax reform could have a significant impact on S&P 500 earnings, corporate behavior and capital markets. Much has been written on the timing, funding and process by which corporate tax reform could be enacted. In this report, we use House Speaker Paul Ryan’s Blueprint proposal as a starting point in quantifying the impact of corporate tax reform on the S&P 500, with some scenario analysis to account for differences included in the final bill (such as Trump’s proposals). The bank"s analysis is focused specifically on the impact of corporate tax reform, however we recognize that there are many other factors that can impact the sensitivity analysis (e.g. changes to household income tax rates, infrastructure spending, etc.).


BofA estimates that the Blueprint proposal would initially boost S&P 500 EPS by $5-6, assuming the end of interest expense deductions only applies to new debt, or is phased in over time. But the devil is in the details. Over time, the loss of the interest tax shield would be a significant drag on earnings as existing debt is refinanced. Additionally, the corporate tax rate is critical in determining whether or not the tax reform policies end up being accretive to earnings on a sustained basis. Savita estimates that at the 20% tax rate, the Blueprint would be modestly accretive, the benefit would triple under Trump’s proposed 15% tax rate, but at a higher 25% tax rate that would appease the deficit hawks in Congress, the benefit would turn to a negative over time (Table 2). The bank also estimates a one-time $8-9 charge to GAAP EPS that would be associated with the discounted repatriation tax.


The bank then focuss on topics that have large implications for US equity investor, but it is important to consider corporate tax reform holistically rather than drawing major implications from each measure in isolation:


  • Reducing the US corporate tax rate

  • Repatriation - mandatory tax on overseas profits

  • Border adjustment tax

  • Removal of interest expense deduction

These tax considerations summarized:


Cutting corporate tax rate could add $8-9 to EPS


Our starting point is the US statutory corporate tax rate. If it were lowered from 35% to 20% and the US moved to a territorial tax system (no longer taxing foreign profits), it would boost S&P 500 EPS by an estimated 12% ($17 to 2018 EPS). We assume companies would be able to retain half of the benefit ($8-9) and the remainder would be passed on to customers or competed away. For instance, a lasting impact to Utilities" profits is unlikely, as the benefit would be passed on via regulated pricing. 


Repatriation: Buybacks could boost EPS by 3%


Both Trump and the Blueprint support a mandatory (as opposed to 2004"s optional) tax of overseas earnings of US firms’ subsidiaries at reduced rates. Non-Financials in the S&P hold at least $1.2tn (mostly Tech and Health Care). If half was used for buybacks, this could add 3% ($4) to S&P 500 EPS. A redux of 2004 where companies used 80% of cash for buybacks may be less likely, in our view. For if repatriation is accompanied by an end to interest expense deductions, companies may choose to pay down debt over buybacks.


Border adjustment tax (BAT) hits EPS by $5-6


While Trump has described the BAT as being “too complicated,” White House press secretary Spicer’s recent comments call into question his stance. This is a key component of the Blueprint and would generate significant revenue. First-order impacts could be significant, with border adjustments detracting $5-6 from 2018 EPS — nearly 80% of the drag comes from the consumer sectors. The second order impacts — product pricing, pricing within the supply chain, exchange rates, foreign policy reactions, etc.-— while harder to quantify, are important to consider.


End to interest deductibility could detract 4% from EPS


We estimate that over time, the removal of the interest expense deduction would detract about 4% from S&P 500 EPS. The ending of interest deductibility could also increase the cost of debt by an incremental 25%, which could have longer term ramifications for capital structures and funding.


The government revenue associated with each of these is included in the table below.


From a sector and industry perspective there are haves and have-nots based on each policy, but in aggregate most sectors have some puts and some takes based on tax reform. The table below shows some relevant aggregate statistics by sector that are used in the subsequent analysis.


* * *


Next, BofA breaks down the impact of the four components of tax reform starting with...


Cutting the corporate tax rate


The best starting point for analyzing corporate tax reform is the US statutory corporate tax rate, as this rate is critical in determining the impact of other proposed changes (border adjustments, interest deductibility, etc.). If the tax rate were lowered from 35% to 20% and the US moved to a territorial tax system (no longer taxing foreign profits), all else equal, we estimate an initial boost to S&P 500 EPS of 12% ($17 to 2018 EPS). However, over time, some of this benefit could be passed on to customers via lower prices — for instance, it is unlikely that there will be any major long-lasting impact from tax reform for Utilities sector profits, as any benefit/cost would likely be passed through to customers when incorporated into each company"s regulated pricing. The benefit would also be offset by some of the other changes discussed in subsequent sections. We assume that S&P 500 companies would be able to retain half of the benefit, or roughly $8 of 2018E EPS. Below, we show the estimated EPS impacts on each  sector based on a tax rate of 20%.


While the effective tax rate of the S&P 500 is generally about 28% (currently closer to 25% due to the recent commodity recession), we estimate that the tax rate for the S&P 500’s domestic operations is much higher at roughly 33% — although this includes state and local taxes. If all companies with tax rates above the proposed new tax rate of 20% were to drop to 20%, and no companies provisioned for US taxes  on foreign profits, we estimate the domestic effective tax rate for the S&P 500 would fall in line with its foreign tax rate of roughly 19%. This would represent a 9ppt decrease in the current S&P 500 tax rate and a 12% increase in EPS. We show the sensitivity to S&P 500 EPS to different assumed tax rates in the chart below, but we reiterate that these estimates exaggerate the actual impact on profits, as a significant portion of these benefits would likely be passed on to consumers via lower prices. We assume that in aggregate, roughly half of the gains from the lower tax rate would be retained (i.e. half of the amounts shown in the sensitivity analysis in Chart 2).


The market is beginning to price in the benefits of tax cuts , but we may still be in the early days – note that potential beneficiaries of fiscal stimulus (i.e. infrastructure spending) have seen an 18% multiple re-rating but de minimis fundamental support, whereas potential beneficiaries of lower corporate tax rates have seen performance driven nearly equivalently by multiples and earnings.


* * *


Repatriation


Repatriation likely under both Blueprint and Trump plans


Mandatory tax on overseas profits of 8.75% under Blueprint, 10% under Trump. The US currently operates under a tax system in which the domestic earnings of US corporates are taxed at the federal US corporate rate (35%) and any overseas earnings that are repatriated are taxed at this rate less a credit for foreign taxes paid on those same earnings. Many multinationals’ foreign earnings thus remain parked offshore, allowing corporations to avoid the tax hit associated with bringing them back to the US. Both Trump and the House (under Ryan) have proposed a mandatory tax of overseas earnings of US firms’ foreign subsidiaries at reduced rates, such that this cash can be brought back and put to work in the US. This differs from the 2004 repatriation tax holiday, which was optional.


Under the Blueprint, accumulated overseas earnings will be subject to a transition tax of 8.75% (for those held in cash/cash equivalents) or 3.5% (for all other holdings), with companies able to pay the tax liability over an eight-year period. This would be part of broader tax reform, where a proposed territorial tax system would exempt companies’ foreign income from US taxes and prevent future buildup of overseas profits as companies would be free to bring them home. Trump’s plan calls for a one-time deemed repatriation of overseas corporate profits at a 10% tax rate.


The Tax Policy Center estimates that a repatriation tax holiday would generate approximately $150bn in tax receipts under Trump’s plan (over 10 years) and $140bn under the Blueprint (over 8 years). The Tax Foundation similarly estimates that a repatriation act could drive spending amounting to $185-200bn in revenues through 2025, which could help fund infrastructure/defense spending.


S&P 500 companies could bring back over $1tn – mostly in Tech & Health Care. Our FX team has written that US corporates in aggregate (including Financials) hold ~$2tn in cash overseas, and their work suggests that nearly half is concentrated within 20 companies. Similarly, as we discuss below, half of the repatriated cash following the 2004 Homeland Investment Act came from just 15 companies, predominantly in Pharma and Tech. Our own analysis of the S&P 500 (based on filings and estimates from our analysts) suggests that non-Financials in the S&P hold approximately $1.2tn overseas, nearly three-quarters of which is in Tech and Health Care (Chart 4).


Post-repatriation cash use: will this time be different?


Valuations, investor preference, growth & leverage ratios suggest less buybacks While any potential restrictions on the use of repatriated earnings are still unknown, we suspect that a pick-up in buybacks is likely, but that a lower proportion will be used for buybacks today than during the last repatriation holiday. Valuations were generally more attractive in 2004-2005 on most metrics (Table 9), and we’ve found that buybacks tend to be more rewarded when stocks are cheap (Chart 8). Additionally, the largest buybacks have not generated alpha for the last several years, as investors have increasingly agitated for companies to use their excess cash on pro-growth investments (namely capex.) According to BofAML’s latest Global Fund Manager Survey, 60% of investors want companies to increase capex spending, vs. 17% who want companies to return cash to shareholders (Exhibit 1). This compares to a majority of investors desiring companies to return cash to shareholders when the HIA was passed in late 2004.


Companies may also feel less pressure to bolster per share metrics by reducing share count if top line is recovering and organic growth is finally materializing. And from a capital structure perspective, if leverage loses its tax benefit, given that leverage ratios are already high (see below) companies may be less likely to reduce their equity capital base, as that would marginally increase their weighted average cost of capital.


Special dividends, pay-down of debt may be other likely uses


Companies may also return the cash to shareholders by issuing a one-time special dividend: income remains in-demand, given that both interest rates and dividend payout ratios remain historically low. And if a repatriation tax holiday comes within the context of broader tax reform that includes an end to the deductibility of interest expense, companies may choose to pay down debt over other uses of cash, in an attempt to skew their balance sheets less toward debt and more toward equity. Deleveraging balance sheets may also be spurred by a demonstrable move in interest rates over the last twelve months. Leverage for S&P non-Financials has steadily been ticking up over the last few years, and, if we exclude the cash-rich Technology sector, leverage is approaching all-time highs (Chart 9).


Potential EPS impacts


$8-9 (6-7%) hit to GAAP EPS from the mandatory tax


We estimate that the tax of accumulated overseas profits of $1.2tn should result in a cash tax impact of $100-120bn (which may be allowed to be paid over 8-10 years), and a one-time hit to GAAP EPS of $8-9 (a lower $65-80bn, given that a several large multinationals such as AAPL already provision a portion of their overseas profits for US taxes and have effective US tax rates well above the US statutory rate). Our analysis assumes Trump’s/the Blueprint’s proposed rates of 8.75%/10%, and that all overseas profits are hit with this one-time tax, as suggested by their plans. See Table 10.


Note that our estimate of ~$1.2tn of cumulative profits overseas is based on estimates from us, our fundamental analysts, and company filings, where in many cases only overseas cash but not other indefinitely invested earnings are disclosed/estimated. Thus, the tax on these earnings could be slightly higher, though the Blueprint would tax earnings not held in cash at a lower 3.5% rate. (We conservatively assume our estimated $1.2tn is all cash and use the higher 8.75% rate under the Blueprint and 10% under Trump’s plan in our below analysis).


We estimate share buybacks add $4 (or as high as $6) to EPS (GAAP & non-GAAP)


If the full $1.2tn that we estimate is overseas for the S&P 500 ex. Financials & Real Estate is brought back (given the tax is mandatory and will be paid either way) and 50% is used on buybacks (~3% of S&P 500 market cap), this could add ~$4 to S&P 500 EPS. And if 80% (~4% of market cap) were used on buybacks, similar to NBER’s estimate of what occurred following the 2004 tax holiday, this could add $6 to EPS. (The difference between the Trump and Blueprint tax rates is small, leading to only cents in index EPS). If one assumed companies only brought half of their offshore cash home immediately, even though the full amount was taxed, these benefits would be cut in half.


Note that buyback programs may span several years, which could spread out some of the EPS benefit below. But if one assumes a buyback is fully executed in Year 1, this provides a one-time boost to EPS growth and a recurring benefit to future EPS given a permanently lower share count.


Cross-asset implications of repatriation


Repatriation should spur USD-buying – up to 40% may be non-USD denominated.  While few companies disclose the currency composition of their offshore cash, our FX team estimates that 60-75% is already in USD while 25-40% is non-dollar-denominated. (If we extrapolate based on the S&P 500’s geographic revenue exposure, the largest proportion could be in Europe, followed by emerging Asia). This may create USD strength via buying pressure (which they estimate could amount to $250-$400bn if half of all offshore cash, which they estimate at ~$2tn, was repatriated). Their analysis of the EUR-USD during the last repatriation holiday suggests an “announcement effect” is likely, as the dollar strengthened ahead of the bulk of the actual repatriation flows.


Repatriation could put upward pressure on bank funding costs. Our rates team’s analysis of some of the largest multinationals with offshore cash suggests ~70% of cash is invested in securities with maturities greater than one year, likely given the assumption that these funds would be indefinitely reinvested, and the remaining 30% has longer maturities. See table below. They believe repatriation could  put upward pressure on bank funding costs as firms reduce their holdings in these short-term investments. According to Crane Data on offshore money fund holdings, our rates team cites that $161bn of offshore funds are held in commercial paper and CDs, of which the majority are from financial institutions with Japan, France and Canada the largest issuers.


* * *


Border adjustment tax analysis


A new tax policy outlined in the Blueprint proposal that has been getting a lot of attention recently is the border adjustment tax, or the application of border adjustments to a company’s imports and exports. While Trump has described the proposal as being “too complicated,” it is a key component of the Blueprint plan and should not be ignored. Additionally, White House press secretary Sean Spicer’s recent reference to “…the plan taking shape right now, using comprehensive tax reform as a means to tax imports from countries…” could be a sign that Trump is not as against the proposal his other comments would indicate.


This policy would effectively result in the tax authorities recognizing all sales that take place in the US (regardless of where they are produced) and all the domestic costs incurred to produce goods and services for customers (regardless of where the sale takes place). As a result, net importers (such as many retailers) would suffer, as they would have to pay taxes on their domestic sales without being able to deduct a significant portion of their costs of production. Conversely, net exporters (companies with much of their production in the US but sales outside of the US) would stand to benefit from not having to pay taxes on their foreign sales while being able to deduct a significant proportion of production costs (Exhibit 3). Purely domestic companies would be unaffected.


Even if border adjustments are enacted, there is significant uncertainty around implementation details. For this analysis, we focus on the first-order impact of border adjustments, but we recognize there would be significant second order impacts on the pricing of products, pricing within the supply chain, foreign exchange rates as well as foreign policy reactions. (We discuss many of these second order impacts later in this report.) For the current exercise, we also ignored the cost of services as the implementation of these rules would be more complicated. See the Methodology section for more details.


We estimate that at a 20% tax rate, border adjustments would detract $5-6 from 2018 EPS, with nearly 80% of the drag coming from the Consumer Discretionary and Consumer Staples sectors (roughly evenly split). This impact includes a 50% haircut to account for offsets from alternate sourcing, currency rates and pricing power. On one hand, we may be drastically underestimating the impact because we have not included the second-order impacts on the supply chain. For example, many retailers source the bulk of their goods from domestic suppliers, who source their goods from overseas suppliers. So while the original retailer may not feel the direct tax hit from importing goods, the supplier that took the tax hit would likely pass along a significant portion of this via a higher cost. On the other hand, the supplier  or the retailer could look for alternate domestic sources for those products, but it would largely depend on whether the cost differential of production between the US and overseas exceeded the border adjustment tax. Some key components in determining the cost differential are the foreign exchange rates (more on this below) and labor costs. In the end, the net impact of the border adjustment taxes will be driven by a complex interplay between corporate tax rates, pricing power, foreign exchange moves, foreign versus domestic availability and cost differentials.


Offsetting BAT with a little math and some price increases


A company could fully offset the border adjustment tax by raising prices such that the after-tax increase in sales would exceed the drag from the lost deduction of costs. All else equal, the break-even price increase would be equivalent to the cost of goods sold as a % of sales multiplied by net % imported and the tax to after-tax ratio, which at a 20% rate is 0.25 (20%/80%). As an example, a company with a 25% gross margin that imports 30% of its goods would need to increase its prices by of 5-6% to offset the border adjustment tax.


Offsetting BAT with FX


Some of the increase in the after-tax cost of imported goods can also be offset by a strengthening dollar. For example, companies producing goods in Mexico, which stand to see a 25% increase in the cost of imported goods, should see the cost increase partially offset by the 13% devaluation of the Mexican Peso against the US dollar since the election. The net cost increase is a more digestible 9%, especially when you also consider that the Peso has devalued nearly 30% since its 2013 peak. While it may offer little consolation to corporates, the US Dollar Index is up over 25% since mid-2014, so the border adjustment tax would presumably act as a reversal of the lowered cost of overseas production over that period.


Border adjustment sensitivity analysis


The table below illustrates how the change in the tax rate and the application of the border adjustment tax would impact the domestic earnings of a hypothetical company with sensitivity to different tax rates and net export assumptions. We assumed the company has a 40% gross margin, operating expenses are 20% of sales and an initial tax rate of 35%. As you would expect, the biggest benefit would accrue to  companies with significant net exports at a high domestic tax rate (bigger tax shield) and the most negative impact to significant net imports at a high domestic tax rate (higher taxes on higher taxable income).


Below we highlight industries which could potentially benefit most / be hurt most by the BAT.


* * *


No interest tax shield


Another key offset to the lower corporate tax rate is the proposed ending of the deduction of net interest expense. We assume that this rule would apply to new debt and that existing debt would be grandfathered. This tax shield removal would increase the cost of debt by an incremental 25% (not to mention the 100bp+ rise in long-term interest rates seen since the summer of 2016). In the table below, we illustrate the impact on S&P 500 corporate profits. We estimate that over time, the removal of the interest rate deduction would detract about 4%, or $4-5 from S&P 500 2018 EPS.


Many investors assume that interest deductions would likely apply only to new debt, and if this were the case, the drag would be gradual for the overall S&P 500 as debt matures and is refinanced. Companies have shifted the composition of their debt toward longer maturities and fixed rates. We estimate an average S&P 500 debt maturity of over eight years, with just one-third maturing within the next three years. The grandfathering of existing debt is a reasonable assumption, but not a sure thing, in our view. There is a possibility that legislators apply it to all debt on the grounds that most companies are expected to be net beneficiaries of comprehensive tax reform.


There is also a possibility that this policy is phased in over a number of years, with certain portions of the existing debt losing their interest deductibility over time.


The most negatively impacted companies would clearly be the ones with the most leverage, in addition to those with depressed earnings (Metals & Mining, Energy, etc.). We have again excluded Utilities from this analysis, because although the sector has a lot of leverage, for these companies, there would likely be a pass through to customers in determining their allowed rate increase.


How will levered companies react?


Companies will likely grow comfortable with a smaller amount of debt, retain more earnings, use less cash for dividends and share buybacks, and potentially draw down cash if they have it. If a tax holiday is also granted, that might offset the loss of benefit. Companies that regularly issue long-term debt may choose to reduce that burden to offset the tax change, and find those funds elsewhere. We find it unlikely that the change would result in a surge in equity issuance, unless the change applies to existing debt, which is unlikely in our view. While this change should be taken as a line item in a wholistic bill, there are victims and beneficiaries here. Corporations that have high leverage ratios, low retained earnings, high interest expense to earnings ratios, no cash overseas offset from repatriation, and those that have recurring long-term debt needs may be most at risk.


Other implications


While some argue that companies will try to raise outsized amounts of IG capital ahead of the deadline to lock in funding with the tax benefit before the loophole is closed, there is likely to be a provision in the legislation that would treat such debt as new debt. In our Investment Grade Strategist Hans Mikkelsen’s view, demand for IG credit could materially reduce over time. The tax change could also dampen Leverage Buyout (LBO) activity, according to our High Yield strategist Michael Contopoulos, where these funds are already struggling to generate high returns – note that LBO funds are currently sitting on close to $1tn in cash looking for a home, according to Preqin’s third quarter update.