Showing posts with label unemployment. Show all posts

Tuesday, December 26, 2017

41 Million Americans Are Living In Poverty This Christmas

Authored by Michael Snyder via The Economic Collapse blog,


Even though the stock market continues to set new record high after new record high, poverty is exploding all over America. 


It is being reported that 41 million people are living in poverty at this moment, and 9 million of them do not receive a single penny of income from anyone.  Once you have been unemployed for long enough, you don’t qualify for unemployment payments any longer, and once you are on the street there is nowhere for other governments programs to send a check to.  I have previously discussed the rising epidemic of homelessness in our nation, but most people don’t want to think about that sort of a thing these days.  Even though New York City has the most homeless since the Great Depression, and even though homelessness in Los Angeles is at an all-time record high, most people want to pretend that everything is just fine.


Well, the truth is that everything is not just fine.


A reporter from the Guardian recently traveled with a special UN envoy to some of the most impoverished areas of the United States.  His report is extremely eye-opening, and I wanted to share a short excerpt from his story.  This portion of his article is about a 41-year-old woman named Ressy Finley who is desperately trying to stay alive on the mean streets of Skid Row in Los Angeles…


Ressy Finley, 41, was busy sterilizing the white bucket she uses to slop out in her tent in which she has lived on and off for more than a decade. She keeps her living area, a mass of worn mattresses and blankets and a few motley possessions, as clean as she can in a losing battle against rats and cockroaches. She also endures waves of bed bugs, and has large welts on her shoulder to prove it.


She receives no formal income, and what she makes on recycling bottles and cans is no way enough to afford the average rents of $1,400 a month for a tiny one-bedroom. A friend brings her food every couple of days, the rest of the time she relies on nearby missions.


She cried twice in the course of our short conversation, once when she recalled how her infant son was taken from her arms by social workers because of her drug habit (he is now 14; she has never seen him again). The second time was when she alluded to the sexual abuse that set her as a child on the path towards drugs and homelessness.


Los Angeles has declared a state of emergency because the number of homeless is rising so rapidly, and so have nine other cities along the west coast.  For much more on this, please see my previous article entitled “As America Gives Thanks, Homelessness Continues To Set New Records In Major Cities All Over The Nation”.


The sad thing is that there are more than a million homes sitting empty in America right now.  As economic opportunities have dried up, many communities in the middle part of the nation are becoming “ghost towns”, and it is getting worse with each passing day…


There are nearly 1.4 million vacant residential properties across the country — abandoned, not for sale, mostly unoccupied homes. With vacant properties comprising as much as 30% of residential properties, some neighborhoods are starting to feel like ghost towns.


Many believe that the answer to the decline of the middle class and the growth of poverty is even more socialism.


But if you want to see where that road leads, just look at what is happening in Venezuela.  People are eating cats and dogs, and just today there were a whole bunch of mainstream news articles about how children are literally starving to death.


No, the real answer is to do what made our economy so great in the first place.  Between 1872 and 1913, we didn’t have an income tax or a central bank, and it was the greatest period of economic growth in U.S. history.


What we have today is not free market capitalism.  We have gone very far down the road toward government-controlled socialism, and it has created a giant mess.


If we want to have a healthy middle class again, we need to have a society that promotes entrepreneurs and the creation of small businesses.  Today we are literally choking the financial life out of entrepreneurs and small businesses, and when I am elected to Congress I am going to fight as hard as I can to change that.


*  *  *


Michael Snyder is a Republican candidate for Congress in Idaho’s First Congressional District, and you can learn how you can get involved in the campaign on his official website. His new book entitled “Living A Life That Really Matters” is available in paperback and for the Kindle on Amazon.com.


Monday, December 25, 2017

As Good As It Gets?

Authored by Sven Henrich via NorthmanTrader.com,


So they got their tax cut done. In the middle of the night again no less, despite the vast majority of the American people not wanting it. The reason may simply be that the American public is not believing the false narratives that are being sold to them. And who can blame them? It starts at the top after all. When Donald Trump claims the tax plan would personally hurt him everyone knows that’s simply not true. And still his agents insists on defending the lie by lying some more.

So I had to ask, does truth still matter:


The answer may not reveal itself for months to come.


US cooperations will see benefits to GAAP earnings and they will increase dividends and buybacks. All true. But they will not hire more or pay more. We already know this:


And since none of these things have to do with organic business growth corporations will eventually face a situation where in the following years an unfavorable comparison will emerge as the artificial earnings benefits are priced in and then earnings growth will look to drag in comparison as the organic growth won’t make up for the artificial delta. Ironically then pressure for efficiency improvements will arise and companies will rightsize in the name of efficiency gains to make up the difference, i.e. layoffs. So ironically corporate tax cuts in the long term will do the opposite of what they were advertised to do. One can virtually see it coming. But hey. Party away.


Fact is the tax cuts will not pay for themselves and deficits will be gigantic and the US treasury is already set to sell $1.3 trillion in debt next year alone.


My general premise is that deficits will further explode once the economy slows as the tax base will have shrunk. Paul Ryan is already on the record wanting to cut social security and medicare benefits. And the AARP knows who will get hurt:


Short term gain, long term pain, but the architects of this construct will be long gone enjoying their gains.


It’s been said that bull markets end on good news and in this regard this may be as good as it gets.


2017 will go down in history as a year where markets got everything beyond their wildest imagination:


The most liquidity injections by central banks ever. (Over $2 trillion). The loosest financial conditions in cycle history:


A Fed that promised a reduction in its balance sheet but actually only delivered noise:


In addition markets got to enjoy solid earnings growth coming from weakness in the years before. Never mind that most of the price expansion was multiple expansion related:


Other factors favoring asset prices: Negative interest rates across the globe continued to force money into high risk assets (“pushing people“). Central banks such as the SNB kept buying billions of dollars of US stocks. Record inflows of passive ETF inflows chasing returns they can’t find elsewhere. The elimination of organic sellers as part of a normally functioning market place. Buybacks, while not at a record pace, still continuing with billions upon billions of dollars allocated to reduce the float of shares. None of it related to organic growth.


And hence the disconnect of asset valuations from the underlying economy is now larger than during previous market peaks:


My summation here: Things will never be better for bulls. The supply demand equation will never be tilted so uniformly in one direction as they are now.


The combined effect of what I summarized above has produced massive multiple expansion and the end of any corrective activity in markets accompanied by record volatility compression:


The elimination of any price discovery. And what this chart above shows in the macro we see in the daily price action every day: Gaps, ramps & camps with virtually no price discovery in between:


Every day:


This is hubris. It’s not rooted in an economic growth base to back up the valuation growth presumed going forward. And the technical dislocation is not sustainable and I maintain all these gaps will fill into 2018.


Has it gone farther than we expected? Sure. Once you remove sellers from a market who knows where it ends up.


After all we find ourselves in an environment where companies can reach $10 billion market caps in the blink of an eye based on absolutely nothing.


The very definition of a mania.


So when I asked the other day whether we are sitting on a generational opportunity to sell equities I meant this not as a facetious question. Now granted I can’t say whether we top here, today or next year.


After all we now have a president literally promising higher stock prices on twitter:


Stock prices are now a matter of national security. The Fed views a sudden decline in asset prices as a threat to the economy and the president sees stock market levels, the poster child of widening wealth inequality in the population, as a benchmark of his presidency:


What hasn’t been priced in: Less looser financial conditions, less central bank liquidity, no more tax cut carrot. But perhaps more importantly? How sensitive will the consumer be to higher rates? I asked this question in Riddle me this.


Fact is consumers keep piling into debt while rates are rising:


And with rising rates come higher interest payments:


I trust you see the math problem there. Indeed the majority of Americans may find that the tax cut crumbs coming their way may go toward servicing their debt:


Perhaps that’s ok if unemployment stays low forever:


The unemployment chart however suggests that this is as good as it gets.


Friday, December 15, 2017

Greece Is Fixed? - Bond Yields Crash To Lowest Since 2006

For the first time since 2006, Greek 10Y sovereign bond yields have plunged below 4.00%.


The last few weeks have seen a veritable rush to grab that yield as GGBs plunged from 5.50% on Dec 4th to 3.98% today!!


Of course, this "signal" from the bond market is being heralded as proof that the worst is over and everything is awesome in Greece again - hooray.


It"s Not!


Over 40% of youth (under 25) are still unemployed, suicide rates remains extremely elevated, emigration among the smart and young is prevalent, and of course there is the immigrant crisis that Greece appears to have become the main bearer of.


As The Guardian reports, a study by the DiaNeosis thinktank found that 15% of the population, or 1,647,703 people, in 2015 earned below the extreme poverty threshold. In 2009 that number did not exceed 2.2%. The net wealth of Greek households fell by a precipitous 40% in the same period, according to the Bank of Greece. Unemployment, austerity’s most pernicious effect, hovers around 22%, by far the highest in the EU, despite a 5% drop in the last two years.


Faith in government claims that the country has turned the corner – based on a massively manipulated bond market – is in short supply.


“Greeks can’t see any light at the end of any tunnel,” said Christodoulaki, shaking her head in disbelief. “They won’t believe anything at this point until they see it for real in front of their eyes.”


For those affected hardest by Greece’s bankruptcy ordeal, the Syriza government has been praised for providing food vouchers and rental subsidies, free school meals and hospital care for some 2.5 million uninsured.


“For the poorest of the poor Syriza has been good,” said Mourtidou.


“But it has not done what the vast majority hoped and that is very dangerous. Tsipras had a calming effect when he came along. There isn’t another Tsipras to promise us the world and now I fear the earth could be trembling under our feet. The next choice could be the far right.”


It is a common concern. Greeks have responded to loss with fortitude and resilience but a mood of uncertainty prevails. Amid the rage and disappointment many worry the power of loss could assume other more menacing forms.


“Uncertainty is the new normality,” psychology professor Fotini Tsalikoglou noted. “It could manifest itself in apathy, violence, more uncertainty, we just don’t know.”


Monday, December 11, 2017

Near Record 5.6 Million Americans Were Hired In October, Most In Over 16 Years

After a burst of record high job openings which started in June and eased modestly in August, today"s October JOLTS report  - Janet Yellen"s favorite labor market indicator - showed a sharp drop in job openings across most categories now that hurricane distortions have cleared out of the system, with the total number dropping from 6.177MM to 5.996MM, well below the 6.135MM estimate, the biggest monthly drop and the lowest job openings number since May, resulting in an October job opening rate of 3.9% vs 4% in Sept.


After nearly two years of being rangebound between 5.5 and 6 million, the latest drop in job openings despite the alleged improvement in the economy is another inidication that an increasingly greater number of jobs may simply remain unfilled in a labor market where skill shortages and labor imbalances are becoming structural.


The number of job openings was down for total private and was little changed for government. Job openings increased in accommodation and food services (+94,000), construction  (+48,000), and real estate and rental and leasing (+40,000). Job openings decreased in wholesale trade (-90,000), finance and insurance (-47,000), information (-32,000), and nondurable goods manufacturing (-26,000). The number of job openings was little changed in all four regions. Now if only employers could find potential employees that can pass their drug test...


One notable change in this report was that despite the sharp drop in job openings, the number of hires in October soared by 232K to 5.552MM in October, the highest since March 2001, and further reducing the hiring rate from 3.8% to 3.6%. At the industry level, the number of hires increased in other services (+55,000) and health care and social assistance (+45,000). Hires decreased for state and local government, excluding education (-32,000). The number of hires increased in the Northeast region.


On an annual basis, the pace of hiring spiked in October, rising from 2.7% Y/Y in Sept., to 6.8% in October, the highest since February 2016.


The other closely watched category, the level of quits - which indicates workers" confidence they can leverage their existing skills and find a better paying job - was unchanged in October, and was identical to the 3.18MM quits in September, suggesting little change to worker confidence about demand for their job skills. The number of quits was little changed for total private, for government, and in all industries. In the regions, the number of quits increased in the South and decreased in the Midwest.


And with a total 5.2 million separations (a 3.5% rate), this means that there were 1.6 million layoffs and discharges in October, little changed from September. The layoffs and discharges rate was 1.1 percent in Oct. The layoffs and discharges level increased in finance and insurance (+37,000) and in mining and logging (+7,000). Layoffs and discharges decreased in construction (-69,000) and in state and local government, excluding education (-15,000). The number of layoffs and discharges decreased in the Northeast region.


Putting all the data in context:


  • Job openings have increased since a low in July 2009. They returned to the prerecession level in March 2014 and surpassed the prerecession peak in August 2014. There were 6.0 million open jobs on the last business day of October 2017.

  • Hires have increased since a low in June 2009 and have surpassed prerecession levels. In October 2017, there were 5.6 million hires.

  • Quits have increased since a low in September 2009 and have surpassed prerecession levels. In October 2017, there were 3.2 million quits.

  • For most of JOLTS history, the number of hires (measured throughout the month) has exceeded the number of job openings (measured only on the last business day of the month). Since January 2015, however, this relationship has reversed with job openings outnumbering hires in most months.

  • At the end of the most recent recession in June 2009, there were 1.2 million more hires throughout the month than there were job openings on the last business day of the month. In October 2017, there were 444,000 fewer hires than job openings.


Finally, and perhaps most notably, the Beveridge Curve (job openings rate vs unemployment rate), appears to be gradually normalizing after a nearly decade-long "drift" from its conventional pattern. From the start of the most recent recession in December 2007 through the end of 2009, the series trended lower and further to the right as the job openings rate declined and the unemployment rate rose. In October 2017, the unemployment rate was 4.1 percent and the job openings rate was 3.9 percent.


Bank of America: "We"ve Seen This Movie Before: It Ends With A Recession"

In a merciful transition from Wall Street"s endless daily discussions and more often than not- monologues - of why vol is record low, and why a financial cataclysm will ensue once vol finally surges, lately the main topic preoccupying financial strategists has been the yield curve"s ongoing collapse - with the 2s10s sliding and trading at levels last seen in April 2015, and with curve inversion predicted by BMO to take place as soon as March 2018. And, according to at least one other metric, the yield curve should already be some -25bps inverted. This is shown in the following chart from Bank of America which lays out the correlation between the US unemployment rate and the 2s10s curve, and which suggests that the latter should be 80 bps lower, or some 25 basis points in negative territory.


Here is some additional context from BofA"s head of securitization Chris Flanagan, who views "the recent sharp flattening of the yield curve, which has seen the 2y10y spread go from 80 bps to almost 50 bps since late October, as the natural course of events at this stage of the economic cycle. Unemployment is low, and probably headed lower, and the Fed is intent on raising rates to stave off future inflation; we"ve seen this movie before and it typically ends with a flat or inverted yield curve. Based on history (and gravity), we think the most likely path forward is that the 2y10y spread reaches zero or inverts sometime over the next year or so and that recession of some kind follows in 2020 or 2021. (Given that the curve has flattened 30 bps in just over a month, projecting an additional 50 bps flattening over the next year is not really too bold.) Of course, much can happen along the way to change that outcome, but for now that seems to us to be the most likely course of events to us."


Here Flanagan openly disagrees with the BofA"s "house call" of a steepening yield curve, and explains why:


We note that flattening is not the house call: BofAML rates strategists believe the curve will steepen due to easier fiscal policy, higher deficits, and a higher inflation expectation and the Fed will require higher 5y-10y yields as a precondition to flattening or inverting the curve. We recognize that the flattening process has already taken longer than we expected a few years back, due to multiple dovish Fed hikes, and we acknowledge the potential for what we think would be steepening detours along the way. In our Year Ahead Outlook, we tried to be especially mindful of the fact that a year is a long time and a lot can happen along the way. This would be a good example. Nonetheless, the Fed"s recent intentness on tightening in the face of low inflation readings makes us believe the last 50 bps of flattening likely will be achieved over the course of 2018.


Flanagan asks if a flattening curve is "a serious (grave) present day problem?" While it is true that a yield curve flattening and inversion always precedes a recession, the timing remains in flux. As a result, BofA notes that based on the history of the late 1990s and the 2005-2007 period, when the curve previously flattened into the 50 bps area, "we think it could be as long as 2+ years from now before spreads begin to meaningfully widen, which means 2020. In the meantime, again with history as a guide, we think securitized products spreads can continue to grind tighter. In other words, we are unlikely to see meaningful spread widening until recession actually arrives or is imminent. The recent sharp curve flattening is certainly noteworthy, but, in our view, it is way too early to start positioning for meaningful spread widening. The bull run in credit spreads has not yet ended and probably will last longer than many might expect."


Finally, for some timing context, BofA shows the following chart of GDP growth vs the yield curve: the curve hit zero by the end of 2005 and inverted in 2006; economic growth steadily slowed in 2006 and 2007 but it wasn"t until 2008 that the downturn accelerated. Credit spreads widened and began anticipating the downturn in mid-2007, after the curve had been flat for over a year.


Sunday, December 10, 2017

What You"re Not Being Told About The Real Economy

Authored by Jeffrey Snider via Alhambra Investment Partners,


The year 2000 was a transition year in a lot of ways. Though Y2K amounted to mild mass hysteria, people did have to get used to writing the date with 20 in front of the year rather than 19. It was a new millennium (depending on your view of Year 0) that seemed to have started off under the best possible terms.


Not only were stocks on fire at the outset, the economy was, too. The idea of this “new economy” leading toward a permanent new plateau of low inflation growth, driven by the breathtaking productivity gains in telecommunications and computing, seemed quite real on the surface. US GDP advanced by more than 3% in 15 straight quarters from Q2 1996 through Q4 1999, averaging a sizzling 4.7% in those nearly four years of dot-com supremacy.


The labor market was clearly robust, too. In March 2000, the BLS estimates (current benchmarks) that total payrolls (Establishment Survey) rose by 468k from that February. That brought the 6-month average up to +303k, a record of expansion that also mystified economists for its lack of inflationary wage pressures. In any case, the late nineties had roared up to the doorstep of the 21st century.


We all know what happened in April 2000, as investors suddenly got cold feet about first the high flying NASDAQ. It wasn’t just stock prices and IPOs, of course, as it really meant one of the major economic themes of that age was in danger being undermined, if not thoroughly debunked. The new economy of the 21st century might not have been grounded so solidly in true economics (small “e”) as everyone thought (especially those running the Fed).


The labor market of 2000 was a study in contrasts, starting out as good as it did, but by that June, there was a shocking minus for the monthly headline payroll number. It wasn’t just a one-time problem, either, as despite all assurances in all the usual places payrolls would contract again in August and also in October. To end the year 2000, the 6-month average for the Establishment Survey had fallen to just +109k.


It was, again, a year of transition, beginning as the “sky is the limit” dot-com era and ending in almost a tailspin just two months shy of official recession. In many ways, the economy has never recovered from it, the labor market (the eurodollar’s giant sucking sound) most prominently.


Because of this and really the length of time involved between then and now, we have forgotten what a good economy actually looks like. There have been, of course, brief moments when we get the sense that something just isn’t right, such as the “jobless recovery” of 2002 and 2003, as well as the whole aftermath of the Great “Recession” up until 2014. By and large, however, the economy and the labor market are described in terms that just don’t apply if almost by default (it’s less bad today, so mustn’t it be good?).


The current payroll report for November 2017 suggests a gain of 228k. It is characterized as everything from “solid” to “robust.” Is it? How would we really know?


The best way to confirm that suspicion is to compare the current labor statistics to those in the past, calibrating the most recent numbers by those before that were recorded during what were inarguably the best of times; such as the late nineties.


Using monthly payroll gains, though, can be misleading simply because of geometric progression. A gain of 228k in November is not equivalent to the 228k gain in November 2000. The latter is actually a better single month result starting as it did from a smaller base.


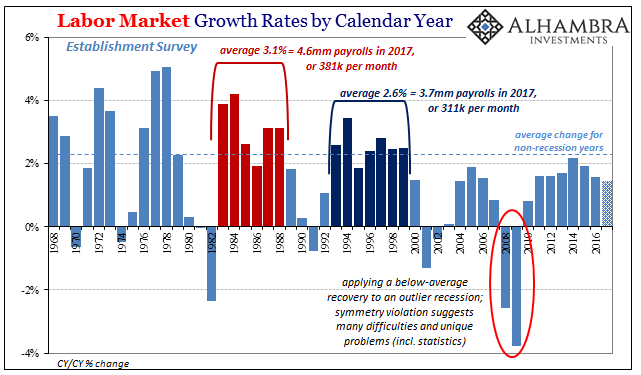
From 1993 through 1999, the labor market gained, on average, 2.6% per year according to the Establishment Survey. Since that time period is universally accepted as one featuring a strong economy, that is our standard for measurement. We can also go back to the eighties for what might amount to as an upper limit of sorts, the economy and labor market at that time being whatever is better than strong and robust – truly awesome.


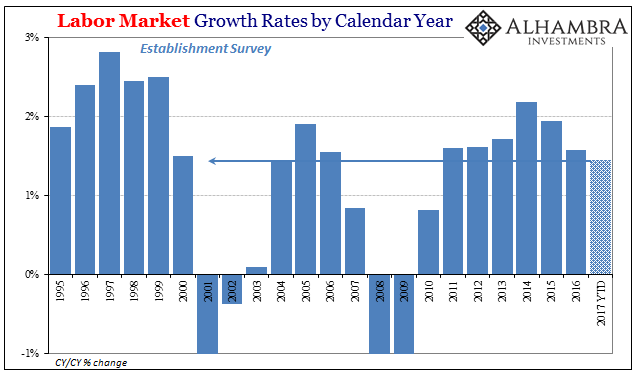
Translating those average gains into the 2016 base equals an expectation of 3.7mm payrolls gained for 2017 to be as good as the nineties, and 4.6mm, which would signal a splendid economic year consistent with the eighties. Through 11 months so far up to November, the Establishment Survey gives us just 1.9mm for 2017. Assuming December turns out equal or better than November’s “good” number, the year should end with a total payroll expansion around 2.1mm, maybe 2.2mm.


That’s less than two-thirds of the way to the nineties, and significantly less than half of the eighties. This year, no matter how many months at 200k plus, has not been a good one. In fact, payroll gains in the eleven months so far tallied by the BLS’s Establishment Survey are less than those presented in that transitional year of 2000.


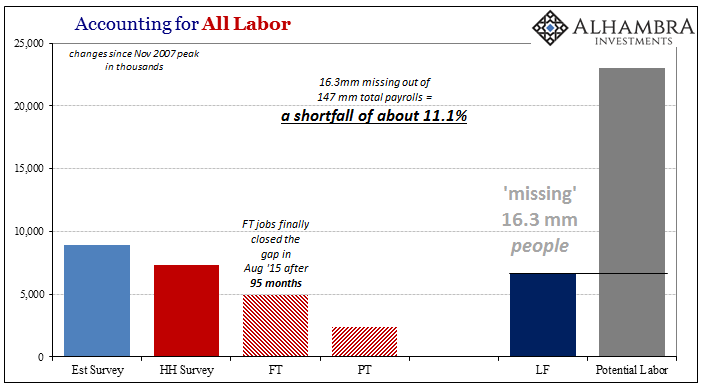
This is how you get the newest generation of American adults yearning in greater numbers for something vastly different, a radical political change if for no other reason than the establishment here continuing to say that everything is good when by every reasonable standard it isn’t even close! The “robust” labor market even of the past few years isn’t nearly enough to draw in those still sitting on the sidelines struggling, however, they do (parents’ basements) to just get along, leaving the economy instead it’s “missing” 16.3 million; a number that in a truly robust economy would be falling not rising.


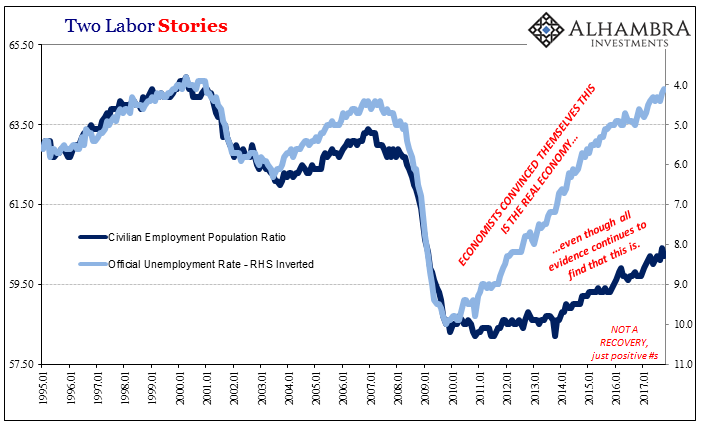
The issue clearly cannot be labor supply (Baby Boomer retirements, heroin, and fentanyl abuse in the Rust Belt) but shrunken labor demand; permanently shrunken economic demand. Therefore, there really should be no expectation for accuracy in the unemployment rate and what that means all around (inflation, baseline growth, monetary policy).


Once again in yet another month where the unemployment rate registers a ridiculous low, wages, and payroll earnings remain stuck at visibly low levels. The average weekly earnings of production and non-supervisory employees rose by just 2.6% year over year in November, after gaining 2.2% in October, 2.6% in September, and 2.7% in August. That’s nothing like in the past when the unemployment rate was where it is now. There is nothing like acceleration in earnings, not even solid growth.


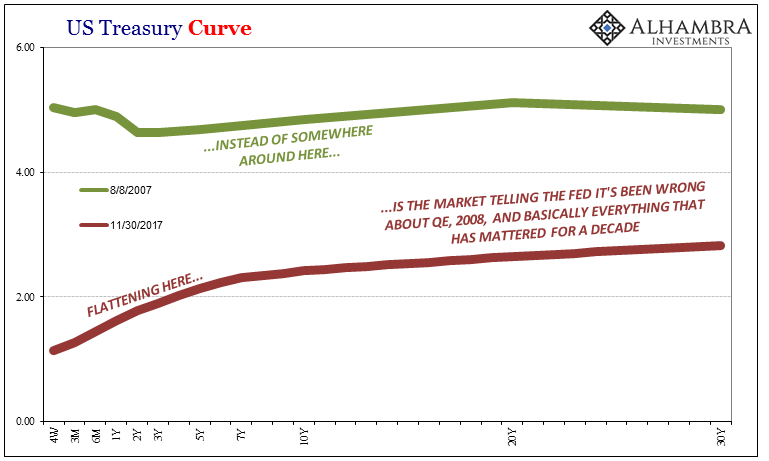
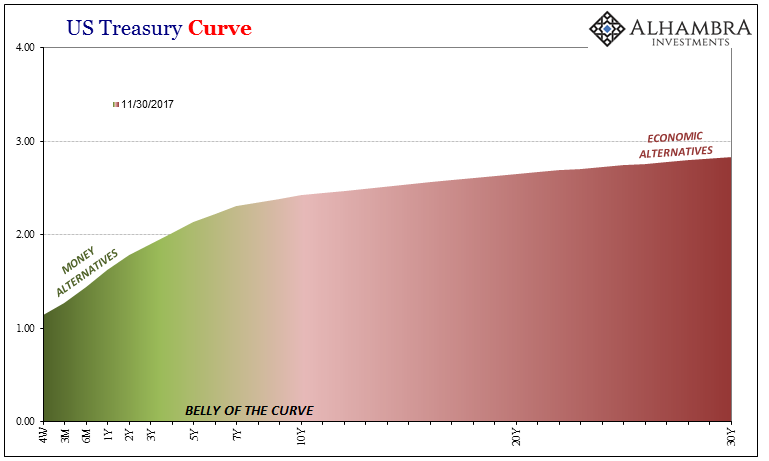
I don’t mean to make all this about the bond market every time (actually it’s appropriate), but the idea that treasuries at the long end have to be wrong has no basis other than misconception or intentional misdirection.


The data, including the BLS data, remains firmly on the side of flattening, and like the Establishment Survey’s paltry 1.9mm in 2017, it’s not even close.


Friday, December 8, 2017

As Stocks Soar To Record High, Americans" Consumer Confidence Tumbles In November

Despite soaring stock market values and an endless array of postive survey data from various estabishment-based entities, University of Michigan confidence tumbled in November.


Consumer sentiment in the U.S. cooled for a second month. While current conditions managed to improve, expectations for the future slumped...


“Perhaps the most important changes in early December were higher income expectations as well as a higher expected inflation rate in the year-ahead,” Richard Curtin, director of the University of Michigan consumer survey, said in a statement.


“The rise in inflation expectations in early December was a surprise, and confidence in this finding must await confirmation in the months ahead before any inferences are drawn.”


Thursday, December 7, 2017

Friday, December 1, 2017

Meanwhile... The Yield Curve Is Crashing-er

Remember Monday when stocks jumped and the yield curve steepened and every talking head and their pet rabbit said the bond market is about to explode... well the yield curve is now imploding again with 5s30s crashing almost 10bps to 64bps - the lowest since Oct 2007.


False start...


The trend is jnot The Fed"s friend...


This morning Fed"s Bullard warned that more rate-hikes could invert the yield curve (which has signal 7 of the last 7 recessions).


“There is a material risk of yield curve inversion over the forecast horizon if the FOMC continues on its present course of increases in the policy rate," Bullard, who doesn’t vote on the policy-setting Federal Open Market Committee until 2019, said on Friday in Arkansas.


“Yield curve inversion is a naturally bearish signal for the economy. This deserves market and policy maker attention.’’


Hoever, last night Cleveland Fed President Loretta Mester on Thursday played down concerns about the yield curve, instead advocating continued gradual increases in the federal funds rate.


“Long rates are going to go up given where we are in the economy and given where we see the economy going,” she said in an interview.


“But this is another reason why we need to keep raising up the short rate. These financial conditions are accommodative.”


So Bullard rightly worried, Mester - it"s different this time.