Showing posts with label BOE. Show all posts

Tuesday, December 26, 2017

Bubble Watch: The Fed KNOWS We"re in a 1999-Type Mania...

The Fed raised rates another 0.25% the week before last.


This marks the 5th rate hike since the Fed embarked on its policy tightening in December 2015 and the fourth rate hike in the last 12 months. The Fed’s latest statement also indicates it plans on raising rates three more times in 2018.


It is easy to gloss over the significance of this, but the Fed’s actions are indeed unusual; other major Central Banks (the Swiss National Bank, Bank of Japan, European Central Bank and Bank of England) are all currently running QE programs (the BoJ, ECB and BoE) or openly printing new money to buy stocks outright (the SNB).


What precisely is the Fed doing? Why the urge to tighten when other banks are all printing new money by the billions?


The following quotes from Fed offer us clues.


Fed Monetary Policy Report, June 2017:


“Forward price-to-earnings ratios for equities have increased to a level well above their median of the past three decades,


Fed minutes, July 2017:


"Since the April assessment, vulnerabilities associated with asset valuation pressures had edged up from notable to elevated, as asset prices remained high or climbed further, risk spreads narrowed, and expected and actual volatility remained muted in a range of financial markets."


Janet Yellen response to question from IMF Panel, October 2017:


Market valuations “are at high level in historical terms” when assessed on metrics akin to price-earnings ratios,


Fed Minutes, October 2017:


"In light of elevated asset valuations and low financial market volatility, several participants expressed concerns about a potential buildup of financial imbalances,"


Janet Yellen during Fed presser December 13th, 2017:


Stock valuations are at high end of historical levels.


I want to be clear on the significance of these statements.


The Fed’s primary role is to maintain financial stability. This means that the Fed will always downplay risks in its public statements. Indeed, former Fed Chair Ben Bernanke once stated that Fed policy is “98% talk, 2% action.”


With that in mind, the above quotes are astonishing in their clarity: the Fed is explicitly stating (in Fed terms) that the markets are in a bubble. And the Fed didn’t just do this once, the Fed has been warning about asset valuations/froth in the system for six months straight.


So just how “frothy” are things that the Fed is being so explicit?


Try “1999-levels” frothy.


Perhaps the best means of measuring frothiness in stocks is the Price to Sales (P/S) multiple. Most investors prefer to use Price to Earnings (P/E), but I am wary of that method because earnings can easily be fudged via gimmicks (different methods of depreciation, write-offs, reducing loan loss reserves, tax loopholes, etc.).


Sales, on the other hand, are very hard to fudge. Either money came in the door, or it didn’t. And if a company gets caught fudging its revenues, someone goes to jail.


With that in mind, consider that the S&P 500’s current P/S multiple has surpassed its former all time peak from 1999: a period that is now widely considered to be the single largest stock bubble in history.


Put simply, stocks are extraordinarily overvalued by a reliable measure.


H/T Bill King


However, there is one main difference between 1999 and today...


Namely, that the Fed has been INTENTIONALLY creating bubbles for nearly 20 years today... and it"s out of more senior asset classes to use!


Let me explain...


The late ‘90s was the Tech Bubble.


When that burst in the mid-‘00s, the Fed created a bubble in housing.


When that burst in ’08 the Fed created a bubble in US sovereign bonds or Treasuries.


And because these bonds are the bedrock of the US financial system, the “risk-free rate” of return against which ALL risk assets are valued, when the Fed did this it created a bubble in EVERYTHING (hence our coining of the term “The Everything Bubbleand our bestselling book by the same name).


On that note, we are putting together an Executive Summary outlining all of these issues as well as what’s to come when The Everything Bubble bursts.


It will be available exclusively to our clients. If you’d like to have a copy delivered to your inbox when it’s completed, you can join the wait-list here:


https://phoenixcapitalmarketing.com/TEB.html


Best Regards


Graham Summers


Chief Market Strategist


Phoenix Capital Research

Monday, November 27, 2017

The Perfect Storm (Of The Coming Market Crisis)

Authored by Lance Roberts via RealInvestmentAdvice.com,


It is always refreshing to step away from the keyboard for a few days and hit the “reset button,” which is exactly what I did last week. My wife and I took a quick trip to Mexico to get a little sun on our face while we wiggled our toes in the sand.


I came back astonished.


Over my 30-odd years of working with money in various capacities, I learned to “shut-up and listen.” This is particularly the case when you are in an airport lounge or packed like sardines in a missile-shaped tube hurling through the air at 35,000 feet.


People love to talk…if you let them.


I had a dozen “listening sessions” with a wide variety of people who each told me roughly the same thing summarized as follows:


  1. The market is a “can’t lose” proposition.

  2. So is “Bitcoin” (even though they had no idea what it really is when I asked them.)

  3. The market is only going higher from here because the Fed won’t let it go down.

You get the idea.


And just when I thought I was sure I had the most bullish views wrapped up – Kevin Matras fro Zack’s Research hit my inbox with the following:


“The S&P will double. And not just eventually. But over the next 5 years (or sooner).


Sounds like a Herculean task on the surface, but it’s really not. In fact, the market only needs to gain on average of 14.9% per year in order to do so. That’s not such a stretch given the market has been averaging 14.9% per year since this bull market began in early 2009, even though GDP (prior to this year) has only been increasing at an anemic 1.48% annual rate.


My 5-year doubling thesis also means that we won’t see another recession until stocks double again, nor will we see another bear market until stocks double again.


So, there you have it.


No bear market until the market racks up another 2600 points and dwarfs every other economic growth cycle in history.


Meanwhile….Back On Earth


Before I go further, let me clarify one thing.


As a portfolio manager, I am neither bullish nor bearish. I don’t really care which way the market is headed personally. If it is rising, as it is now, I am long equities. When it reverses that trend, I will either be short equities and long bonds and cash.


That’s my job.


My job is also to pay attention to the risks that could quickly remove large chunks of investment capital from my client’s portfolios. Like any professional gambler knows, you can only play the game as long as you have a “stake” to play with. Lose your capital, and you lose the game. 


The Perfect Storm Cometh


In the movie, “The Perfect Storm,” George Clooney plays the Captain of the “Andrea Gail.” The Captain, after having a bad start to the fishing season, convinces his crew to go out one last time and they venture well past their usual fishing grounds leaving a developing thunderstorm behind them. After ignoring repeated warnings, a desperate Captain, and crew, head into a confluence of two powerful weather fronts and a hurricane in order to cash in on their bounty.


They all died.


Investors today, after having missed out on the first few years of the current bull market cycle, have now decided to throw all caution to the wind and ignore the repeated warnings in hopes of attaining the “riches” they have been promised.


And, like the “Andrea Gail,” they are currently heading into a perfect storm.


Storm One


Currently, there are many articles pointing our various risks in the market. One that caught my attention over the weekend was a note on the volatility index by Kevin Muir.


“For the longest time, I felt the concerns from the VIX were overblown. For years, market pundits have been bandying about charts meant to scare investors about the potential dislocation in the VIX market. I even wrote a piece called, The VIX Article no one will like.”


He is right.  For the last several years, each time the volatility index hit new lows, there were fears of a massive reversal on the horizon. Yet stocks marched higher while the volatility index made even lower lows.


But Kevin goes on to make an important point:


Yet the frenetic pace of VIX shorting has intensified to a level that frightens me. There is now $1.2 billion of market cap of the inverse VIX ETF XIV, with another $1.3 billion of SVXY (another inverse ETF). This is insanity.


If we get a sharp move higher in VIX, there will be a snowball effect. If it is big enough, monster positions, like $2.5 billion of short VIX ETFs will have to be bought back in a hurry. And let me break it to you, there is no one large enough to take the other side of that trade. At least no one willing to do it without extracting many pounds of flesh first.”


Kevin is absolutely correct.


The only question is how far does it have to rise before the “margin calls” begin to occur. More importantly, volatility runs very long cycles which, unsurprisingly, follow the psychological investment cycles of the market from fear to greed back to fear.


But that is not the only problem.


Storm Two


Once the $VIX trade begins to fail, investors will find themselves almost immediately confronted the “high-yield bond storm.”


American corporations are levered to the hilt with total corporate debt surging to $8.7 trillion – its highest level relative to U.S. GDP (45%) since the financial crisis. In just the last two years, corporations have issued another $1 trillion of new debt NOT for expansion but primarily for share buybacks to boost bottom line earnings per share.


Note: This is also why “repatriation” won’t lead to massive economic growth, wages or employment. Instead, it will go to share buybacks, dividends, and executive compensation. 


For the last 9-years, the Fed’s “zero interest rate policy” have left investors chasing yield and corporations were glad to oblige. The end result is the risk premium for owning corporate bonds over U.S. Treasuries is at historic lows.


I have written for some time that during the next market reversion, the 10-year rate will fall towards “zero” as money seeks the stability and safety of the U.S Treasury bond. However, corporate bonds are an entirely different issue. When “high yield,” or “junk bonds,” begin to default, as they always do, which is why they are called “junk bonds” to begin with, investors will face sharp losses on the one side of their portfolio they “thought” was supposed to be safe. 


Let the panic selling begin.


As shown below, when the rout begins, the yields on junk bonds sharply deviate from that of the U.S. Treasury bond. Again, the 10-year Treasury rate is not going higher anytime soon, but everything else likely will.


Storm Three – The Hurricane


Of course, as investors begin to get battered by the “volatility and junk bond storms,” the subsequent decline in equity valuations begins to trigger “margin calls.” 


As the markets decline, there will be a slow realization “this decline” is something more than a “buy the dip” opportunity. As losses mount, the anxiety of those “losses” mounts until individuals seek to “avert further loss” by selling.


There are two problems forming.


The first is leverage. While investors have been chasing returns in the “can’t lose” market, they have also been piling on leverage in order to increase their return.


It is often stated that margin debt is “nothing to worry about” as they are simply a function of market activity and have no bearing on the outcome of the market.


That is a very short-sighted view.


By itself, margin debt is inert.


Investors can leverage their existing portfolios and increase buying power to participate in rising markets. While “this time could certainly be different,” the reality is that leverage of this magnitude is “gasoline waiting on a match.”


When an “event” eventually occurs, it creates a rush to liquidate holdings. The subsequent decline in prices eventually reaches a point which triggers an initial round of margin calls. Since margin debt is a function of the value of the underlying “collateral,” the forced sale of assets will reduce the value of the collateral further triggering further margin calls. Those margin calls will trigger more selling forcing more margin calls, so forth and so on.


That Sinking Feeling


Unwittingly, investors have compounded their risks by piling into exchange-traded funds under the mistaken assumption it is an “easy way to invest.”


Over the past 9-years, the number of ETF’s available to investors has now eclipsed the number of stocks available for them to invest in. This leads to a liquidity problem and the risk of a “disorderly unwinding of portfolios.” As the head of the BOE, Mark Carney, warned:


“Market adjustments to date have occurred without significant stress. However, the risk of a sharp and disorderly reversal remains given the compressed credit and liquidity risk premia. As a result, market participants need to be mindful of the risks of diminished market liquidity, asset price discontinuities and contagion across asset markets.”


The issue of liquidity is not a small one.


Investors mistakenly assume there is ALWAYS a buyer at the price at which they wish to sell. 


This is wrong.


While the answer is “yes,” as there is always a buyer for every seller, the question is always “at what price?” 


At some point, that reversion process will take hold. It is at that point where the storms all collide into a massive wave of panic driving selling. It will not be a slow and methodical process, but rather a stampede with little regard to price, valuation or fundamental measures.


It will be the equivalent of striking a match, lighting a stick of dynamite and throwing it into a tanker full of gasoline.


Importantly, as prices decline it will trigger margin calls which will induce more indiscriminate selling. The forced redemption cycle will cause catastrophic spreads between the current bid and ask pricing for ETF’s, junk bonds, and option pricing. As investors are forced to dump positions to meet margin calls, the lack of buyers will form a vacuum causing rapid price declines which leave investors helpless on the sidelines watching years of capital appreciation vanish in moments.


Don’t believe me? It happened in 2008 as the “Lehman Moment” left investors helpless watching the crash.


Over a 3-week span, investors lost 29% of their capital and 44% over the entire 3-month period. This is what happens during a margin liquidation event. It is fast, furious and without remorse.


Currently, with complacency and optimism near record levels, no one sees a severe market retracement as a possibility. But maybe that should be warning enough. 


Where the majority of mainstream punditry gets it wrong, in my opinion, is they keep saying we “can’t have another ‘great financial crisis’ again” because things are different.


That’s true.


NO market “mean reverting” event has EVER been based on the same issues that caused the previous event.


The next event won’t be the same as any past event either.


Only the outcomes remain the same.


The “perfect storm” is coming.


Friday, November 17, 2017

BOE Warns Weekly Fund Redemptions Of 1.3% Would Break Corporate Bond Market

The Bank of England has done some timely and truly eye-opening research into the resilience of corporate bond markets. The research is contained in the Bank of England Financial Stability Paper No.42 and is titled “Simulating stress across the financial system:  the resilience of corporate bond markets and the role of investment funds” by Yuliya Baranova, Jamie Coen, Pippa Lowe, Joseph Noss and Laura Silvestri.


The starting point of the analysis is to revisit the Global Financial Crisis (GFC) which saw $300 billion of related to subprime mortgages amplified to well over $2.5 trillion of write-downs across the global financial system as a whole. One of the problems was that the system was structured in a way that did not absorb economic shocks, but amplified them. The amplification came via a feedback loop. As the crisis unfolded, fears about credit worthiness of banks led to the collapse of interbank lending. Weaker banks had their funding withdrawn, which led to a downward spiral of asset sales and the strangling of credit in the broader economy.


The paper notes that, since then progress has been made and the Bank of England’s stress tests now include the feedback loop created by interbank loans.


Indeed, the 2016 test showed that the potential for solvency problems to spread between UK banks through this channel has “fallen dramatically” since the crisis. Furthermore, interbank lending has been cut back and is more often secured against collateral.


The report cautions that other feedback loops might be present, especially since banks only account for about half of the UK financial system. Indeed, a key objective for regulators is to assess how the non-bank part of the system – termed “market-based finance” in the paper, responds to economic shocks. In particular, could the non-bank system, which trades “market-based finance” (principally bonds), amplify shocks in a similar way to the banking system during the last crisis? The report characterises market-based finance and the related risks as follows.


The system of market-based finance includes, among other parts, investment funds, dealers, insurance companies, pension funds and sovereign wealth funds. It supports the extension of credit and transfer of risks through markets rather than banks. It has expanded rapidly since the crisis.  At the global level, assets held by non-bank financial intermediaries increased by more than a third since the financial crisis. The potential spillover effects in market-based finance centre on ‘fire sales’ of assets, which affect prices of financial assets and functioning of markets.  Participants in this part of the system can face incentives, or be forced into, sudden asset sales.


The report sees the potential for another dangerous feedback loop developing from falling asset prices which lead to declines in net worth, prompting a withdrawal of funding which leads to more asset sales and further falls in prices. They are hardly reinventing the wheel here and what they’re really describing is the evidence that investors often behave pro-cyclically. It raises the valid concern that pro-cyclical behaviour is most dangerous in less liquid assets with short-notice redemption – the classic liquidity mismatch. The post-Brexit problem in 2016 in UK commercial property funds was a great example.


These dynamics were illustrated clearly in 2016 in funds investing in UK commercial property.  With the property market in hiatus following the United Kingdom’s referendum on membership of the European Union, these open-ended funds faced redemption requests from investors concerned about the prospect of future price falls and fearing that other redemptions would force the funds to suspend.  The process was self-fulfilling and many funds were forced to suspend redemptions.


The report goes on to highlight the challenges for broker-dealer liquidity and hedge funds if asset managers aggressively sell securities in a crisis. It’s obvious stuff, i.e. that broker-dealer are less able to warehouse securities and less able to provide funding to hedge funds, which might be buyers, and could become forced sellers. The BoE models what would have when one type of shock - redemptions by open-ended funds - trigger selling by the funds with spillover effects for broker-dealers and hedge funds.


The paper that follows seeks to model how the aggregate behaviour of several sectors within the system of market-based finance, including investment funds and dealers, could interact to spread and amplify stress in corporate bond markets.  That focus stems from the growing importance of bond markets to the financing of the economy, alongside the rapid growth in holdings of such bonds in fund structures.  It does not focus on individual companies; the analysis is conducted at a sector level.  It is not concerned with the capacity of the sectors to absorb losses.


Basically, the model estimates the sensitivity of investment grade corporate bonds yields in Europe if funds sell the equivalent of 1% of their total assets on a weekly basis – which was similar run rate to the redemptions in October 2008 (4.2% over the month – see below). Since then, however, broker-dealer capacity has contracted and investment grade issue issuance risen sharply. Importantly, it also addresses the scale of redemptions which might overwhelm the ability of broker-dealers and hedge funds to absorb the selling. The model assumes that there is a shock leading to an initial round of redemptions which prompts investment funds to make asset sales. Broker-dealers require lower prices to compensate them for absorbing the selling which leads to a second round of redemptions and selling. After that, further selling “breaks” the market and leads to dislocated prices on the downside.


The paper explains the market-breaking points as follows.


The level of redemptions at which the second-round price impact line ends is where dealers reach the limit of their capacity to absorb those asset sales by funds not purchased by hedge funds.  We assume that market liquidity is tested at this point and refer to it as the market-breaking point. Transactions could still occur beyond this point — for example, if a dealer can immediately match a buyer and seller or if it sells other assets to purchase corporate bonds — but are assumed to take place at highly dislocated prices.  


Conclusion:
The BoE paper estimates that a weekly level of redemptions from funds equivalent to 1% of their assets would increase investment grade corporate bond yields by 40 basis points. However…this is the key…it estimates that initial redemptions equivalent to only 1.3% of assets on a weekly basis would be “needed to overwhelm the capacity of dealers to absorb those sales, resulting in market dysfunction”, i.e. the market-breaking point. It describes this as an “unlikely but not impossible event.”


We disagree, we are in a far bigger bubble than 2007-08.


Thursday, November 16, 2017

BoE Deputy Governor Gives Crazy Speech Warning Markets Have Underestimated Rate Rises

On 2 November 2017, the Bank of England raised rates for the first time in a decade and Sterling’s initial rise was promptly sold off by forex traders as we discussed.


The 7-2 vote by the Monetary Policy Committee was not the unanimous decision some had expected, while Cunliffe and Ramsden saw insufficient evidence that wage growth would pick up in line with the BoE’s projections from just over 2% to 3% in a year’s time. Ben Broadbent, MPC member, deputy governor and known to be a close confidant of Governor Carney, gave a speech today at the London School of Economics (LSE) in which he warned markets that Brexit issues didn’t necessarily mean that interest rates have to remain low.


Bloomberg reports that Broadbent stated that the Brexit impact on monetary policy depends on how it affects demand, supply and the exchange rate.


"There are feasible combinations of the three that might require looser policy, others that lead to tighter policy."


Which sounds alot like he doesn"t know, although he stuck to the central bankers trusty tool, reassuring LSE students the Phillips Curve "still seems to have a slope".


According to the FT.


The deputy governor of the Bank of England has warned that financial markets have underestimated the chance of further interest rate rises. In a speech at the London School of Economics on Wednesday, Ben Broadbent said markets had placed too much emphasis on the idea that interest rates needed to be kept low in the face of Brexit uncertainty. The deputy governor said it was “uncertain” and “complex” to anticipate how Brexit would affect inflation. But he rejected the assertion that Brexit “necessarily implies low interest rates”.


“Even as inflation rose, and the rate of unemployment fell further, interest-rate markets continued to under-weight the possibility that (the) bank rate might actually go up this year,” he said.


The BoE’s Monetary Policy Committee announced its first interest rate rise in more than a decade earlier this month. But the central bank has struggled to convince financial markets that it is likely to raise rates further.


BoE officials were taken aback when sterling sold off on the day it announced the rate rise, and two-year gilt yields remain below the BoE base rate, suggesting markets are sceptical that the MPC will raise rates further while there is still considerable uncertainty around the UK’s economic future outside of the EU.


Broadbent acknowledged that there is a risk that Brexit uncertainty could adversely impact UK demand. However, he sees the potential for other factors, a reduction in trade, for example, which could crimp UK capacity and necessitate a rise in rates. While Broadbent’s thinking is flawed, and his barley field example plainly ridiculous, the FT continues.


Brexit-related uncertainty could weigh on demand and motivate the MPC to keep interest rates low to support the economy, but other factors could push the central bank to raise rates.


For example, if Brexit reduced the UK’s openness to trade, the country’s output capacity could suffer, which would require the BoE to raise rates to temper inflation.


“Economists often presume that changes in an economy’s underlying productivity occur only slowly,” Mr Broadbent said. However, he added: “A sharp reduction in the degree of openness (to trade) could have a more immediate impact. “A field currently producing barley, sold into the European market, can’t easily or as fruitfully be replanted with olive trees”. He said the challenge for monetary policymakers was that “reductions in supply can add inflationary pressure even as they lower aggregate (gross domestic product)”.


So, let’s consider Broadbent’s example...


The UK suffers a drop in aggregate demand due to a contraction in trade, the BoE raises rates in an over-leveraged economy to stem the inflation and…undoubtedly makes the contraction in GDP much worse. That makes no sense and is the kind of one dimensional thinking that we’ve had to put up with from central bankers. What’s worse is that Broadbent has specific responsibility for monetary policy and a c.v. as long as your arm – Cambridge, Harvard PhD, Fulbright Scholar, Columbia University, Goldman Sachs and UK Treasury.


It’s no wonder we are in such a mess with people like this pulling the levers of policy in the central banks. Crazy ideas aside, Broadbent and his BoE colleagues might be unhappy with market projections for the future path of interest rates, but they can hardly blame investors for being sceptical.


Which way are rates going, Ben?


Monday, November 13, 2017

FX Weekly Preview: Is The USD Correction Done Yet?

Submitted by Shant Movsesian and Rajan Dhall MSTA of fxdailyterminal.com


USD correction done yet?


After a number of weeks of painfully tight ranges, there is little on the horizon which looks potent enough to warrant a break out.  Has the apathy in global stocks spread into FX? It looks like it, especially when looking at the carry trade.  Watching USD/JPY has been nothing short of tortuous as we currently remain hemmed into a 113.00-115.00 range.  We have been getting used to watching EUR/USD as the benchmark rate to spark off fresh activity across the currency spectrum, but despite the open "ended-ness" of the APP come Jan 2018, the pair is now in a fresh stalemate as bids in the mid 1.1500"s have only served to limit the correction which was so evidently needed once we had reached the first objective at 1.2000.  For USD/JPY, the market is pinning hopes for tax reform to take off, but the chinks are starting to show again with the corporate rate tax cut to 20% set to be delayed until 2019.  As we saw in the aftermath of president Trump"s victory, there seems to be little concern over how these tax cuts are going to be paid for and perhaps move significantly greater concern as to how much they will add to GDP if/when implemented.


Scepticism set in earlier this year once we had pushed above the 116.00 mark, and while the extension stretched into the 118.00"s, calls for 120.00 soon fell flat.  After the move down into the 107.00"s, we have since moved back into the upper end of the 2017 range, but still looking for a move above 115.00.  There was little data to feed off in the US last week, but we have inflation and consumer data in the week ahead which will shed more light on whether the USD run is truly exhausted or not.  Little correlation with rates at the moment, with the 10yr US benchmark backing off 2.50% in recent weeks, but to little effect, but 2.30% has held since then.  


In Europe, as the turmoil in Spain calms down, divisions inside the ECB flare up again, with Germany calling for firmer guidance towards signalling an end to QE.  President Draghi and a number of his fellow members are keen to keep the Euro recovery from fizzling out, so keeping the APP open ended at this stage offers them room for manoeuvre as well as containing another impulsive EUR rally.  On the latter, they have succeeded, but in the mid 1.1500"s, strong buying last week underlined the focus on a longer term recovery.  Little prospect of a surge back up to 1.2000 at this stage, but that is partly down to the USD.  


All the big names from the ECB are due to speak next week - again - but in the steady flow of rhetoric nothing will impact the near term consolidation in the EUR other than a firmer commitment towards and "end date".  Inflation is tailing off again as we are expected to see in the final Oct reading on Thursday, but on Tuesday we get the second reading on Q3 GDP which will need to stick at 0.6% at the very least to underpin the tentative hold in the single currency.  Flash GDP in Germany also out, and mixed readings in factory orders could seen this slip back towards 2.0% annualised.  Italy is closer to 1.5%, but Portugal and Holland are over 3% for comparison, but all from a lower base remember. 


It will be an interesting start to the week for the Pound, as we wait to see how the market reacts to news that around 40 MPs are ready to sign a letter of no confidence in Theresa May.  The PM is really struggling to get a break at the moment, in a government which we should not forget, still hasn"t got majority.  As if fending off the hard Brexiteers and the "remainers", is not hard enough when negotiating exit from the EU, recent departures from her cabinet and constant in-fighting makes here position untenable by the day, and this will continue to weigh on GBP, if not, then when we push on to higher levels, which we did at the end of last week.  


The Brexit talks offered nothing now, indeed perhaps more to be concerned about as Michel Barnier effectively gave the UK a few more weeks to commit to the divorce bill which some papers have suggested will be raised in order to get progress onto the next stage of trade talks.  Optimistic or opportunistic, the longer the EU talks, the more business investment will suffer, so arguments for buying GBP at these levels based on valuation lose credibility by the day.  Were Cable down at 1.2000 or 1.2500, this would carry more weight, but inside 1.3000-1.3500, buyers must be looking for 1.4000+ at the very least, and few can justify that with the rate perspective also dashed after the previous week"s dovish hike by the BoE.  


EUR/GBP is more likely to be range bound in the meantime, but we have continued to test sub 0.8800 with little progress, but 0.9000+ is equally lethargic at this stage.  


Plenty of data though next week, with the latest inflation print on Tuesday, employment on Wednesday and retail sales on Thursday.  Notable are some of the concerns over the UK high street at the moment.  CPI above 3.0% is expected, but the BoE believe it will top out at 3.2% - lets see.  


In Australia, rising employment has been the economic saviour which keeps the hopes of wage inflation alive - as it has in the US.  We get the Oct report on Thursday.  Despite the strong gains in industrial metals price, the AUD has been clearly faltering in recent weeks, and we are not convinced that 0.7600-25 is the low just yet.  What happens when commodity prices adjust, or if the Chinese data fades again?  If the AUD cannot recover at this time, then we cannot rule out a move on 0.7500 just yet, with the market focusing on softer inflation which has seen the yearly rate slip below the 2-3% RBA range, and set to fall further after the CPI re-weighting. 


Industrial production in China is due out on Thursday, but the yoy rate is currently above 6.0%, so expectations for a drop off from 6.6% to 6.3% will likely be dismissed at this stage.  


Nothing of note for NZ however, so focus here will be on any fresh policy announcements from the new government.  RBNZ mandate reform is set to bring full employment into policy considerations, but as we have seen in the Q3 numbers, job gains are moving the right way, so any dovish implications will be held back for now. Indeed, last week"s RBNZ statement was pretty positive on the outlook, with NZD softness of late also welcome.   0.7000 capping the NZD/USD rate for now though, and as with the AUD/USD rate, the base at 0.6815-20 does not fill us with confidence as yet.  


In Canada, we have to wait until Friday to get any top tier data, which will be Oct CPI.  BoC gov Poloz was focusing on this last week, in what looked to be another turnaround in policy sentiment, focusing on the inflationary impact of reaching full capacity and output.  The central bank have done well to contain the rate pricing euphoria which took the 10yr rate up to 2.20%, and USD/CAD down into the mid 1.200"s, but with long end rates back below 2.00% and the spot rate back under 1.2700, the gov can afford to be a little more neutral.  1.2500-1.2700 looks to be fair value in the meantime, so expect to see rallies above 1.2900 sold into (if we test back here again) as we have seen from late Oct.  


For Norway we have Q3 GDP next week, while in Sweden it is inflation time also, but NOK/SEK is starting to threaten the upside again, which is not unsurprising given where Brent Oil is trading at the moment.   EUR rates look more congested at the present time, but looking at the weekly spot charts, we can see further USD progress has been rejected for now.   


Monday, November 6, 2017

The Deflating Rally

Authored by Sven Henrich via NorthmanTrader.com,


Record prices continue to be printed on US indices as the global multiple expansion on the heels of still ongoing record central bank intervention has yet to slow down in a significant way.


All central banks were in essence dovish in recent days and weeks, whether the FOMC, the ECB, the BOE and of course the ever active BOJ as well as the SNB as it showed a new record $88B in direct holdings of US stocks.


Yet, despite the record prices on indices, the rally appears to be deflating from within.


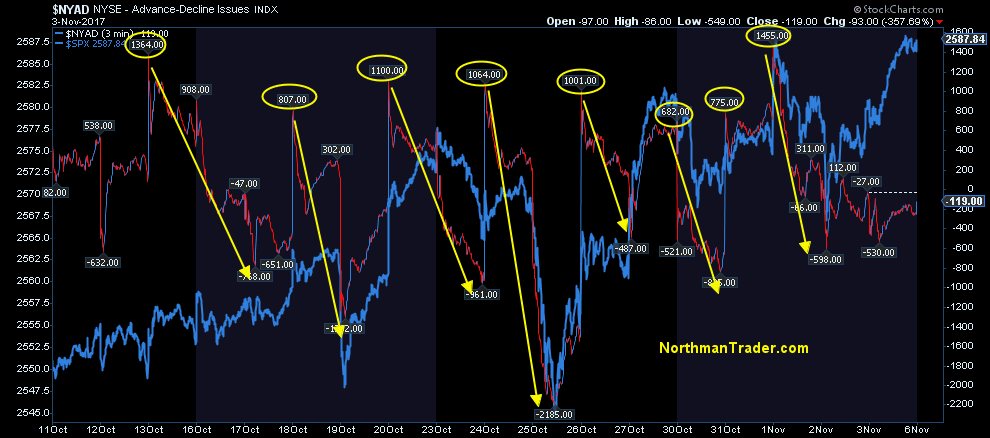
In the past several weeks I’ve pointed out a very specific pattern of positive internals on market opens and then a very distinct pattern of internals weakening throughout most days:


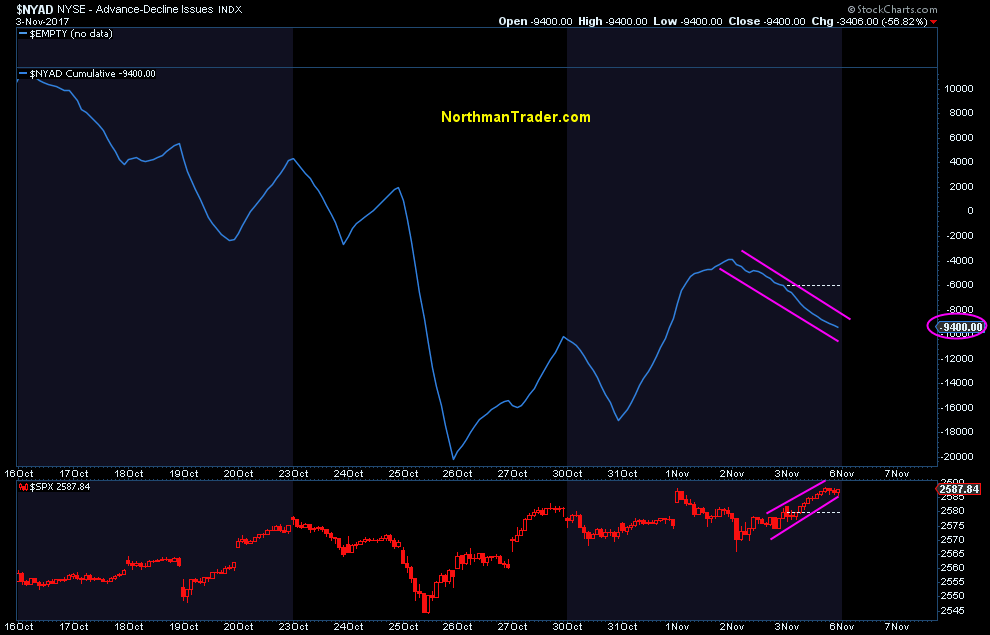
This trend has impacted the cumulative advance/decline picture and shows that recent highs have come on a negative cumulative advance/decline:


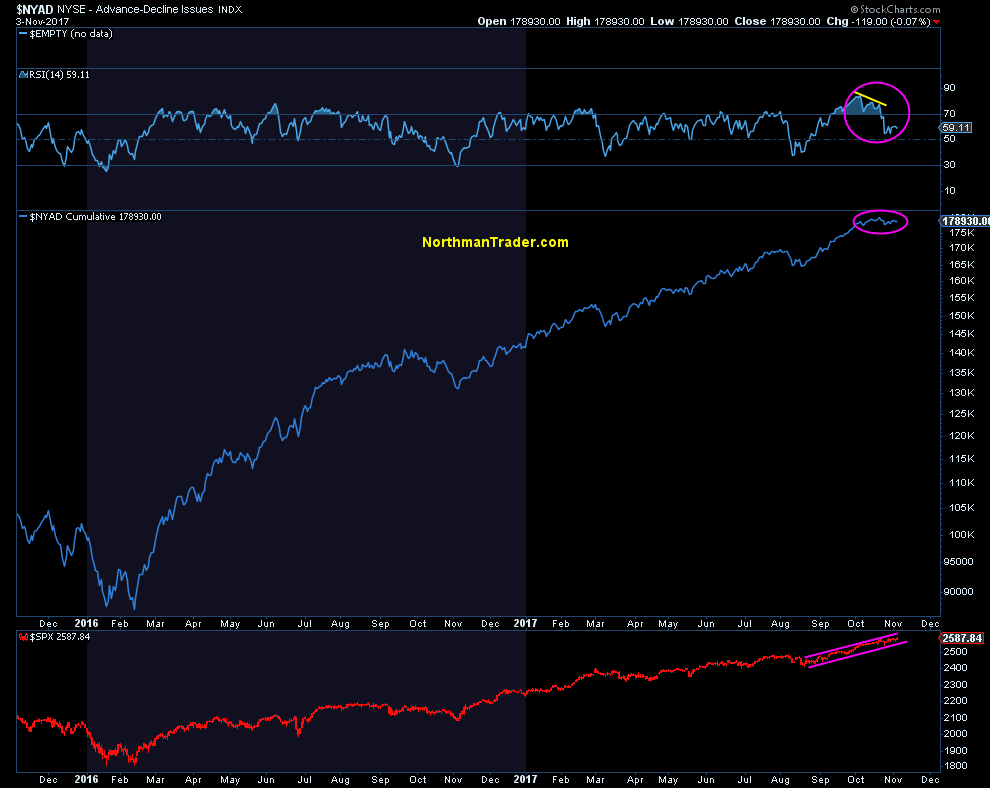
Since this rally began with massive global central bank intervention in February 2016 the cumulative advance/decline picture has often been cited as a sign of underlying core strength in markets. This picture has changed:


Recent highs came on negative divergences in relative strength despite index prices continuing to advance in a seemingly steady trend.


Yet the internal picture is practically collapsing.


Take the recent highs in the Nasdaq.


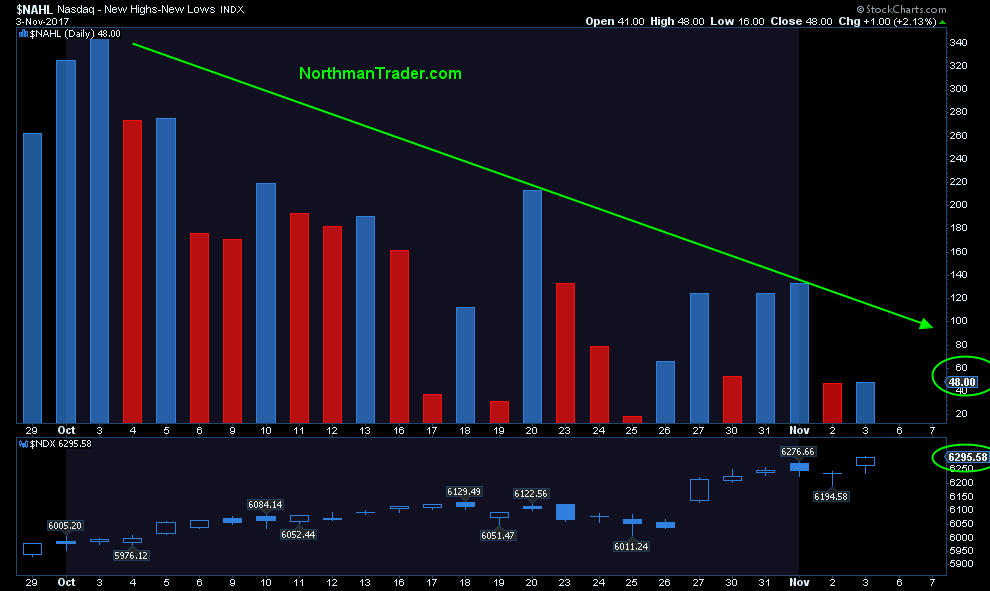
Ever since the beginning of October all new highs in the $NDX have come on fewer new highs versus new lows. Indeed Friday’s $NDX highs came on the lowest expansion yet:


On $NDX itself we can observe a complete collapse in the amount of stocks above the 50MA as $NDX printed new highs. Only 56% of components are still above the 50MA:


A similar picture can be observed on the $SPX:


And of particular note: All recent highs have come on a negative $NYMO:


The message: Somebody is selling this market. Every day. And it’s very cleverly done as to not disturb the seeming tranquility in markets.


Note that despite all the selling volatility compression continues at a record pace as during each Friday, no matter what happens in the world, the $VIX is ensured a close below 10 by week’s end:


You’d think we’d have more volatility with such an internal breakdown in stocks. But the concentration of market cap in only a handful of stocks continues to mask the selling underneath.


On an equal weight basis we’ve noted the divergence in markets for quite some time. This indicator has now fallen off the cliff as the correlation has completely broken down:


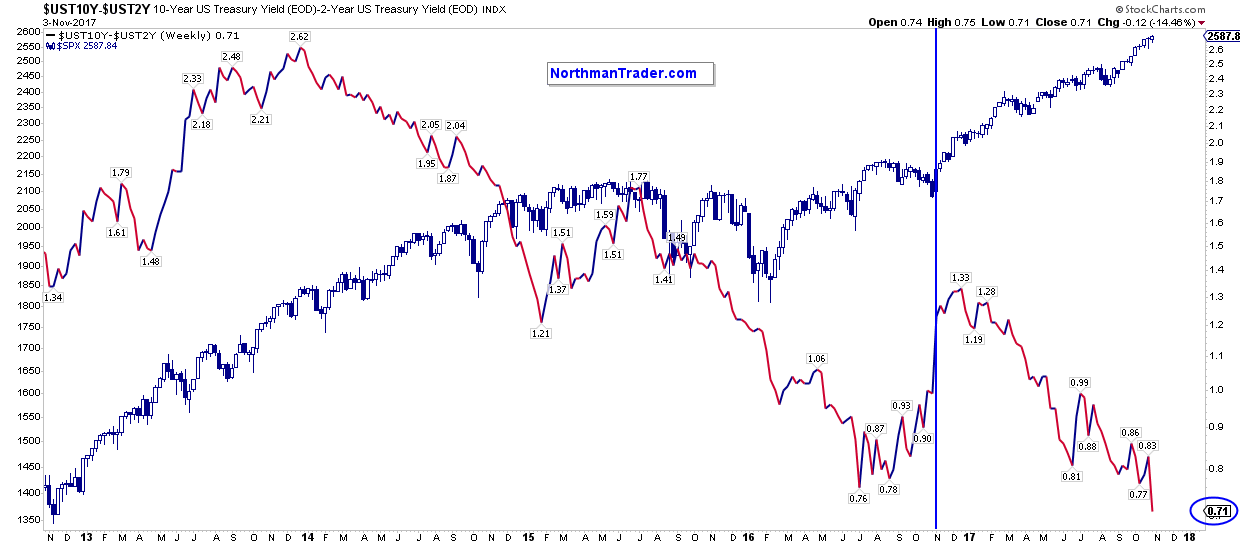
As has the yield curve which hasn’t believed in this rally in months:


2017 has seen more central bank intervention on a global basis than ever. But this party is slowly coming to an end. And while central banks will still intervene in 2018 it will be at a reduced pace. The last time we’ve seen central banks intervene at a reduced pace? 2015. And it produced sizable selling in the summer of 2015 and at the beginning of 2016 forcing record intervention since then.


All global markets have proven is that they can perform splendidly with record intervention:


2018 will then be a test case how well markets can fare with less than record intervention, a new reality. Another new reality: Soon US markets will also have their answer in regards to tax cuts. All will be priced in one way or the other.


And, from the looks of it, someone has begun selling ahead of both of these emerging realities. And once the rest of the market takes notice we suspect Friday $VIX closes below 10 may suddenly become a thing of the past.


Tuesday, October 31, 2017

BoE Expected To Vote 6-3 For Rate Increase And Signal Markets Underpricing Future Hikes

The last time the Bank of England raised rates was July 2007, when rates increased to 5.75%. Credit markets began to dislocate a month later (when LIBOR diverged from Fed Funds), equity markets peaked three months after the increase and things eventually got much worse.


So, the track record is not auspicious, but the alleged global macro narrative this time is one of synchronised global growth, notwithstanding Catalonia, North Korea and embryonic concerns about Chinese deleveraging. On the domestic front, UK inflation is a bit too warm, growth a bit too tepid and Brexit a bit too uncertain.


Nonetheless, the BoE is expected to vote 6-3 in favour of a rate hike from 0.25% to 0.50% on Thursday, as Bloomberg reports, not everyone at the Bank of England will be on board with raising interest rates.


While Nov. 2 may see the U.K.’s first rate increase in more than a decade, economists surveyed by Bloomberg say three out of nine officials on the Monetary Policy Committee will vote against the move. That’s based on the median estimate from 24 responses. Any divide within the BOE panel reflects the conflicting signals from the economy, which is seeing both a currency-driven inflation surge and weaker expansion. While for some officials, the economy may still be too fragile to endure a rate increase, Governor Mark Carney and others see Brexit reducing potential output, making the U.K. more vulnerable to overheating.


Two of the three likely dissenters are two of the three deputy governors no less, as Bloomberg notes...


Policy makers Dave Ramsden and Jon Cunliffe may be among those to dissent. Ramsden said this month he doesn’t yet see domestic inflationary pressures building, and Cunliffe said it’s an “open question” when the BOE should lift its benchmark rate from a record-low 0.25 percent.


Silvana Tenreyro, described as “neutral” on policy by Bloomberg Economics, has also hinted that she’ll proceed with caution. The overriding thinking on the committee, however, seems to be that above-target inflation and a shock to supply from leaving the European Union means a rate hike is warranted.


In the build-up to the decision on Thursday, some recent data may have emboldened the more hawkish policy makers. The economy expanded by 0.4 percent in the third quarter, more than economists expected, and inflation hit 3 percent last month, a full percentage point above the BOE’s target. The central bank will update its economic forecasts alongside the policy decision. Compared with August, economists see a chance of an increase in the bank’s inflation estimate for this year.


If a rate hike is forthcoming - and markets are pricing in an 88% probability of one - the more important question is the signal about future hikes. While many commentators believe that it will be a question of “one and done” (a “dovish” hike), Bloomberg believes that the “BOE may also say markets underestimating further hikes”, noting, even with a division on the MPC, economists forecast that the BOE will keep alive the prospect that further rate increases are on the cards. While another move may not come soon, more than half of those surveyed expect Carney to indicate that markets are still under-pricing the odds of future tightening.


Never mind further rate hikes, a substantial percentage of economists are against a rate increase this week. A Reuters poll published in the past week showed more than 70 percent of economists believe now is not the time to raise rates - though slightly more than that said it would happen anyway.


When Carney was appointed BoE Governor in 2012, then UK Chancellor of the Exchequer, George Osborne, described him as “the outstanding central banker of his generation.” While he might be outstandingly handsome (we’re told), the coming months will determine whether he lives up to that billing, or is seen as making a catastrophic policy error - like Jean Claude Trichet in 2008.


Friday, October 27, 2017

UK Retail Employment Plunges Most Since 2008 As Retail Sales Crash

Yesterday we notedthe surge in cable following the stronger-than-expected Q3 GDP print of 0.4% Q/Q, above the 0.3% estimate. Afterwards, the market was calculating an 87% chance that the BoE would hike next week. Brown Brothers commented that:


The case against a hike is that inflation appears poised to peak shortly, the economy is softening, and real wages are falling. This may already be squeezing households, where an increase in the base rate is quickly passed through to households.


However, two reports from the UK retail sector might encourage some nervous MPC members to stand pat.


Bloomberg reports, U.K. retail sales are falling at the fastest pace since the depths of the recession in 2009 and worries about the housing market could exacerbate the weakness in consumer spending seen this year. The Confederation of British Industry said its measure of sales plunged to minus 36 in October - the lowest since March 2009 -- from a positive 42 in September. Sales for the time of the year were slightly below the usual seasonal rates, it said.


Rain Newton-Smith, CBI Chief Economist, blamed the weakness on higher inflation.


“It’s clear retailers are beginning to really feel the pinch from higher inflation. While retail sales can be volatile from month to month, the steep drop in sales in October echoes other recent data pointing to a marked softening in consumer demand.”


According to Bloomberg, faster inflation has put the squeeze on shoppers this year, and a separate report on Thursday suggests a cooling housing market could further dampen consumers’ enthusiasm for spending.


YouGov and the Centre for Economics and Business Research said while their headline sentiment measure rose this month, confidence in the housing market weakened. For Bank of England policy makers, all this may play into their thinking as they prepare for a crucial meeting next week.


While they’ve signalled that an interest-rate increase may be needed soon, a rate hike - even a small one - could also have an impact on spending habits, particularly for those concerned about the cost of their mortgage. Most U.K. property reports point to a property slowdown, with Halifax saying annual price growth has fallen to 4 percent from 10 percent in early 2016. According to Acadata and LSL, London house prices may be falling at their fastest pace since the financial crisis.


“The downtick in the house value measures is a concern,” said Nina Skero, head of macroeconomics at the CEBR.


“One’s perception of own home value has direct implications on their future willingness to spend.”


The CBI survey points to continued pressure on households from the mix of stronger price increase and sluggish wage growth. Official data this month showed stores had their worst quarter in four years in the three months through September. The John Lewis Partnership, owner of a grocery and department store chain, has seen sales growth slow by more than half this year.


The second report on the UK retail sector was from the British Retail Consortium which stated that retail employment dropped at the fastest rate since 2008.


From The Independent, UK retailers cut jobs over the past three months at the fastest rate since comparable records began in 2008, due to technological change and rising employment costs, the British Retail Consortium said on Thursday.


The BRC, which represents major retailers, said its members employed 3.0 per cent fewer staff in the third quarter of this year than during the same time in 2016, and total hours worked fell by 4.2 per cent year-on-year.


Both were the steepest falls since the BRC started collecting records in 2008, when Britain was in the middle of its sharpest recession in decades. This contrasts with the picture in the broader economy, where the unemployment rate is its lowest since 1975 and job creation has been strong, albeit partly at the expense of wages. Still, the BRC report chimed with a European Commission survey last month that showed British retailers’ expectations for employment sank to their lowest since late 2011.


“The pace of job reductions in the retail industry is gathering steam,” BRC chief executive Helen Dickinson said.


“Behind this shrinking of the workforce is both a technological revolution in retail, which is reducing demand for labour, and government policy, which is driving up the cost of employment,” she added.


Retail, which accounts for just under 10 per cent of jobs in Britain, has a lot of low-paid jobs that have been affected by rapid rises in the minimum wage in recent years, as well as a new government training levies and pension requirements.


So while Corbyn and May continue to battle, and the central bank is threatening rate-hikes, the nation"s core is collapsing. One wonders whether hard, soft, or no Brexit would make any difference now...


Monday, October 23, 2017

It"s Time To Take Central Bankers" "Calm Assurances" With A Pinch Of Salt

"It could be time to fire up your engines," suggests former fund manager Richard Breslow, urging some life back into the seemingly oblivious markets...


Via Bloomberg,


There’s a lot of uncertainty out there and the response to it shouldn’t be an inability to trade. How about a little frenetic back and forth?


We could use some of the good kind of noise, as in, let’s show a little life. Markets are inching toward some really interesting levels and it’s time for them to show a little spirit and giddy up.


For once, try taking central bankers at their word that tapering and, eventually, rates, are on the move. And take all of these blithe assurances that everything during the process will be calm, cool and collected with a grain of salt. We need to stop saying global economic growth and trade are showing meaningful strength and then agree that everything is still horrible and we can’t afford to change.


Do you know why there’s no inflation? We measure it incorrectly. I can assure you it’s more expensive to live than it used to be. Which is the simplest and truest definition. Why isn’t wage growth higher? Because we’ve utterly skewed the relative bargaining power between capital and labor. Monetary policy will never be able to fix that. Nor the masses forever soothed by rolling out another reality show.


No matter who is selected as the next Fed Chair, rates are likely going up in December and will be in play for March. Tapering is beginning. The BOE is looking to pull back some stimulus and the ECB wants to as well. Even the BOJ has begun to include warnings about investor complacency in their comments. Yesterday’s Japanese election may seem like a strong endorsement of the status quo, but it has also changed the underlying discussion on a number of topics in a meaningful way. The Bank of Canada may be on pause, but they are among a number of banks waiting to pull the switch.


At whatever point along the Treasury yield curve you look, the charts suggest we have crept up to important pivot points. And it’s going to be even more apparent if the recent mini bounce in its steepness can generate some momentum. What a difference it will feel like if the 10-year can break above 2.40%. Not a big ask given we sit so close below. Yet, if it was so easy, we wouldn’t be having this discussion. Twos and fives are right where they will have to decide whether to fish or cut bait. Where they go from here matters. And if I wanted to be a starry-eyed optimist, I’d point out that while it remains low, option volatility has traced out a nice floor since July and has been trying to push higher in the last week.


The dollar, too, is showing some signs of life, even though the majors continue to see volatility selling. The dollar index traded at 94 this morning and if it can eke out another half-percent, there’s going to be a different narrative circulated.


Which countries’ set of woes will take center stage? Or to put it another way, how much of whose bad news is already priced into prevailing levels?


As Brewslow concludes, "I hope this all leads to something interesting... Because who wants to sit around watching the paint dry some more."


In any case, at these prices, you definitely have something well worth watching. Volatility pricing can be backward looking as well as prescriptive.