Showing posts with label Stock market index. Show all posts

Tuesday, November 14, 2017

Goldman Discovers Something Odd: Stock Moves Are Increasing Even As Index Moves Are Decreasing

One wouldn"t know it by looking at the moves in equity indexes, but this earnings season has been unusually volatile for stocks, which however has yet to translate into bigger moves at the macro level. That is the bizarre observation made by Goldman"s derivatives strategist John Marshall (whose team grew by one when ex-Deutsche Banker Rocky Fishman joined recently).


As Goldman shows in the chart below, while earnings day moves have increased in the US and globally, and stock dispersion generally has jumped to the highest since the Trump election, index moves have been the smallest in years. Goldman believes this is further evidence "of increased uncertainty in the equity market."


Quantifying the delta between the two vol indicators, Goldman writes that over the past two weeks, the SPX has moved an average of 0.17% per day (1-standard deviation BELOW its 3-year average), while looking under the hood at the stocks in the S&P 500 the standard deviation of returns has been 1.8% on average (1-standard deviations ABOVE its 3-year average). As an indication of just how much turblience there is below the surface, earnings day moves are 4.2x average daily moves for US stocks (3.6x for European and 2.3x for Asian) in this earnings season so far.


Using the charts below, Goldman shows the earnings day absolute move in stocks relative to the non-earnings days 1 month before and after. This includes data through November 9, 2017 for the current quarter. Earnings day moves are above average levels relative to the past decade, while non-earnings days have had lower volatility.


What does this bifurcated volatility pattern mean? According to Goldman, "this as evidence that fundamental uncertainty is rising (stock moves on earnings days) while general macro fears have fallen (stock moves on non-earnings days)." In practical terms, and based on the relationship of index volatility and the standard deviation of S&P 500 stock returns over the past 15 years, Marshall writes that he would expect "the SPX to be moving 90bps per day rather than the current 17bps. This implies realized volatility above 15%." Of course, that may not be possible (or allowed by central banks) because as we wrote two weeks ago, the beta of VIX spot has exploded to -19, which means that even a mere 90bps down day in the S&P could launch a self-reinforcing vol cascade which crushes the millions of vol sellers, unleashing a another sharp correction, or worse.


Goldman"s conclusion:


A rise in single stock volatility is generally associated with a decline in equity returns. Based on the relationship between the standard deviation of S&P 500 stock returns and forward returns in the SPX over the past 15 years  (controlling for index returns and index volatility), this elevated level of stock volatility would suggest a decline in the SPX of 0.8% over the next two weeks +/- 1.5%.


Alas, that observations is completely meaningless as due to the margin of error, the market can rise by 0.7% and Goldman can still claim it was right.


In any case, Goldman ends on a cautious note and warns that "while we do not believe this alone is a compelling reason to sell the market today (or buy VIX), we believe it is a trend worth monitoring closely."




Monday, November 6, 2017

Divergences sending bearish message to stocks?


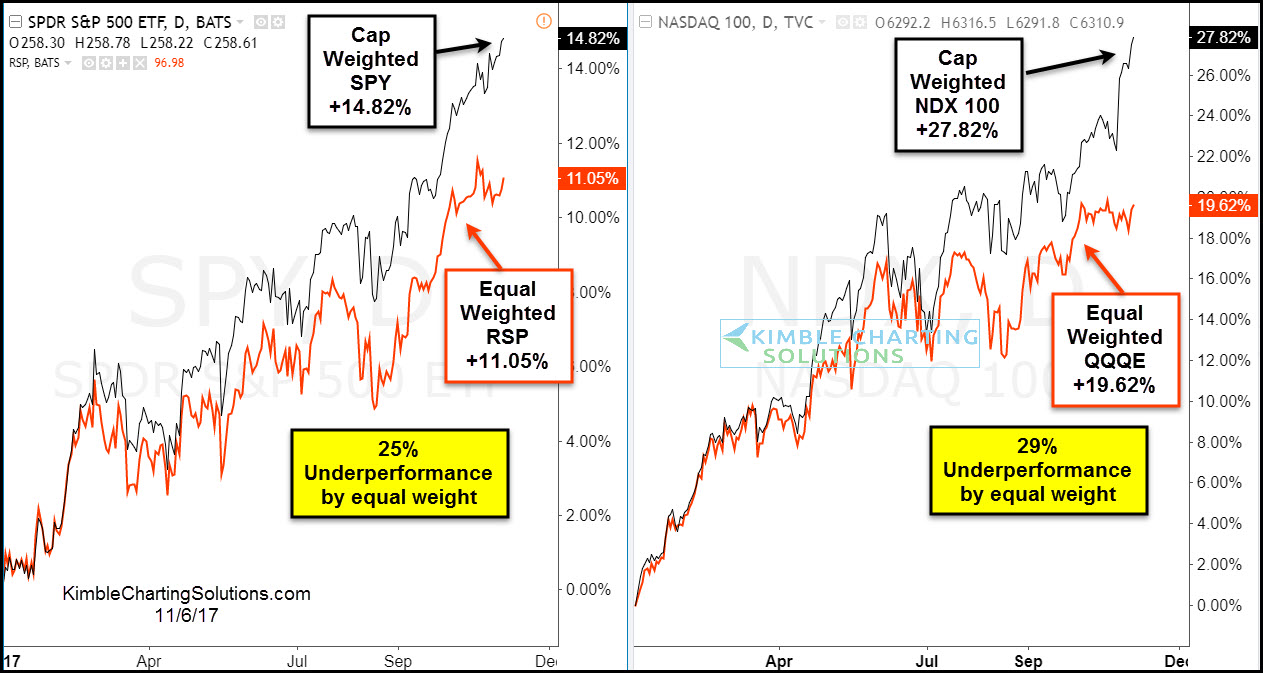
The 2-pack below compares the Cap weighted and Equal weighted performance year to date of the S&P 500 and Nasdaq 100-


CLICK ON CHART TO ENLARGE


The chart above reflects that the equal-weighted S&P 500 ETF (RSP) and the equal weighted NDX 100 ETF (QQQE) have both underperformed the Cap weighted indices by over 25% this year. Both of the equal-weighted ETF’s over the month have trades sideways, while the Cap weighted are moving higher.


The lagging performance by the equal-weighted ETF’s reflects that fewer stocks are participating in the rally.


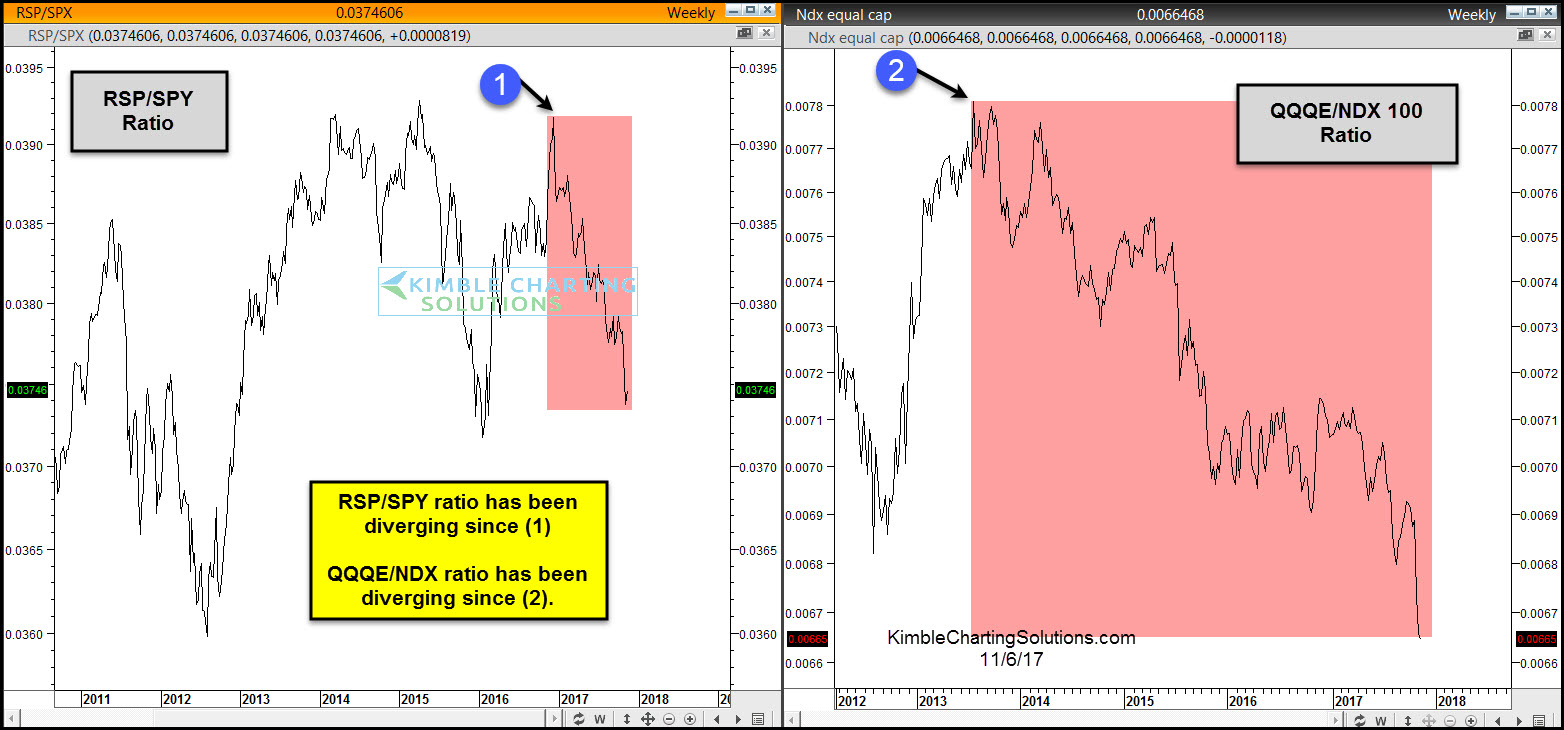
Below looks at Cap/Equal weighted ratios for the S&P 500 and NDX 100-


Divergences are taking place by both ratios as the S&P has been diverging since earlier this year and the NDX has been diverging the past few years.


The divergences by themselves do not mean the market has to head south right or a bear market is ready to start. Historically when fewer and fewer stocks are powering a bull market rally, it does reflect a thinning of the market and could result in unimpressive gains going forward.


Stock bulls want to see these ratios heading higher, not continuing to diverge.


Why you see chart pattern analysis with brief commentary:   There is a ton of news and opinions about markets and stocks that make the decision-making process more difficult than it needs to be.   


I believe the Power of the chart Pattern provides all you need to see what is taking place in an asset and determine the action to take. 


This approach has worked well for me and our clients and I encourage you to test it for yourself.


Receive my free research posted on the blog daily here 


Or,  send an email if you would like to see sample research and take me up on a trial of my premium or weekly research where I provide actionable alerts on breakouts and reversals in broad market indices, sectors, commodities, the miners and select individual stocks 


Email services@kimblechartingsolutions.com  


Call us Toll free 877-721-7217 international 714-941-9381 


Website: KIMBLECHARTINGSOLUTIONS.COM 


Monday, September 4, 2017

Gold Pops, Stocks Drop As Futures Open After Korean Chaos

In an echo of last week"s move following North Korea"s teating of missiles across Japan"s territory, futures markets are opening in a decidedly risk-off mannwr following North Korea"s "hydrogen bomb" test. Dow Futs down 100 points, Gold jumping and Treasury bonds bid...


All major US equity indices are down...


Gold is back above $1340...


USDJPY broke below 110.00


And VIX futures are spiking back into last week"s Korea crisis region...


Of course, what happens next is anyone"s guess as last week saw the BTFDers panic-buy stocks to their best week in 10 months1

Thursday, August 17, 2017

Tech Rally Internals Tank: Nasdaq Ratio Crashes To Record Low

Via Dana Lyons" Tumblr,


On an equal-weight basis, the Nasdaq 100 just dropped to a relative all-time low.


There are countless ways to measure the level of participation in a stock market rally. By “participation”, we are referring to the number of stocks that are taking part in the rally. One way is to look at the market’s “internals”, e.g., advances vs. declines, new highs vs. new lows, etc. As an indication of good quality participation, we like to see a high number of each of the former vs. each of the latter. When that is not occurring, even as the indices hold up well, we say that the rally is “thinning”, or seeing a decreasing level of participation. We’ve published multiple examples of this internal weakness in recent weeks.


Another way of measuring participation within a rally is by looking at indices on an equally-weighted basis instead of a cap-weighted basis. In the latter, an index may remain propped up by a relatively few number of stocks, if they are among the largest and most heavily weighted in the index. When that is the case, the market may be susceptible to weakness since it is being supported by just a relatively small number of issues. A couple of them go by the wayside, and the market does not have that broad support to compensate. One of the current rally leaders may be falling into such a predicament now.


There is no doubt that tech stocks and large-cap growth stocks have been among the relative strength leaders during this bull market, especially throughout 2017. However, as we see in today’s Chart Of The Day, the durability of that leadership may be at risk, if we can consider the Nasdaq 100 (NDX) as representative of those stock groups. The reason we say this is because the equally-weighted NDX is now badly lagging the cap-weighted version.


Specifically, the relative performance of the Nasdaq 100 Equal Weight ETF (QQEW) just hit an all-time low when compared with the cap-weighted QQQ ETF.


The inception of the QQEW was in 2006, so an “all-time” low is really just an 11-year low. Even still, as the chart shows, the relative ratio hit proximate lows in 2008, 2012 and 2015-2017. The recent break below those levels is not, in our view, a trivial event.


[ZH: and as we noted previously, there is an even greater concentration going on currently as traders appear to be rotating from FANG stocks to AAPL]


Friday, August 11, 2017

What Happens When $500 Billion in Risk Parity Funds Hit "Sell" on Stocks?

The market riggers are now pulling the pin.


All market rigs end badly. And given the fact that this one has been particularly egregious, the results will be quite ugly.


You cannot pin the S&P 500, perhaps the single most important stock index in the world, for weeks and expect it to end well. This is particularly true when you’re pinning it using Risk Parity Funds and their “buy/sell” algorithms.


Those same algorithms that have mindlessly bought stocks every time the VIX gets smashed, will mindlessly SELL stocks when the VIX explodes higher.


And the VIX will be exploding higher. Historically, the average level for the VIX since 1993 has been around 18-20. We’ve been stock at 9-10 for weeks now.


Not anymore. Today’s move could very well be the start of something big. The below chart predicts a move to 30 if not 40 in the coming weeks. If this was a chart for an individual stock, you’d say it was a screaming buy.


So what happens when the VIX spikes to 30-40 and the $500 billion worth of capital managed by Risk Parity Funds starts dumping stocks?


Buckle up, we’re about to fund out.


On that note, we are already preparing our clients for this with a 21-page investment report titled the Stock Market Crash Survival Guide.


In it, we outline the coming collapse will unfold…which investments will perform best… and how to take out “crash” insurance trades that will pay out huge returns during a market collapse.


We’ve extended our offer to download this report FREE due to today’s market breakdown. But this is the last day this report will be available to the general public.


To pick up one of the last remaining copies…


https://www.phoenixcapitalmarketing.com/stockmarketcrash.html


Best Regards


Graham Summers


Chief Market Strategist


Phoenix Capital Research


Monday, May 8, 2017

Goldman: "The Last Time Correlations Were This Low Was Just Before The Financial Crisis"

In a note from Goldman"s cross-asset strategist Ian Wright, the bank points out something troubling: on one hand, over the past six months, or rather since the US elections, equity markets around the globe have soared, and returns across regions have been "strong" - S&P 500, Stoxx 600, Nikkei 225 and MSCI EM ($) have returned roughly 11%, 16%, 20% and 11% in local currency price terms, respectively, with MSCI World ($) up 12% over the same period.  In other words, everything is up. And yet, while equity indices have rallied across regions, inter-regional equity return correlations have actually fallen materially to their lowest levels since 2000.


Why is this troubling? Because as Wright casually throws out, "the last time correlations were this low was in 2007, just preceding the financial crisis"


So does this imply that a financial crisis is imminent? Goldman isn"t sure, and notes that the collapse in correlations "leads to the questions whether we expect correlations to remain low or whether we expect equity markets to recouple and move more in lock step, and what the environment will be from here. In our asset allocation, we are overweight Asian and European equities and underweight US equities over both 3- and 12-month views, with the former on growth expectations inflecting and an earlier cyclical position supporting EM and EAFE while, in the latter, the expectation that higher valuations and the later cycle of the US weigh on returns (see Exhibit 2 for return forecasts).


And just to hedge its bets, and not upset too many clients, Goldman even provides a bullish spin on the data: As Wright adds, "Exhibit 9 shows that while inter-regional equity correlations have indeed come down on average, they have remained more elevated between non-US markets such as Europe and Japan. We would not be surprised to see this trend continue in the absence of growth shocks and with anchored volatility, with the US the lagging performer from here. Data based on May 5, 2017 market close."


Which will be right outcome: collapsing volatility as a precursor to another crash, or a catalyst for even more gains? Look to this week"s barrage of Fed speakers for the (rhetorical) answer.