Showing posts with label S&P 500 Index. Show all posts

Tuesday, November 14, 2017

Goldman Discovers Something Odd: Stock Moves Are Increasing Even As Index Moves Are Decreasing

One wouldn"t know it by looking at the moves in equity indexes, but this earnings season has been unusually volatile for stocks, which however has yet to translate into bigger moves at the macro level. That is the bizarre observation made by Goldman"s derivatives strategist John Marshall (whose team grew by one when ex-Deutsche Banker Rocky Fishman joined recently).


As Goldman shows in the chart below, while earnings day moves have increased in the US and globally, and stock dispersion generally has jumped to the highest since the Trump election, index moves have been the smallest in years. Goldman believes this is further evidence "of increased uncertainty in the equity market."


Quantifying the delta between the two vol indicators, Goldman writes that over the past two weeks, the SPX has moved an average of 0.17% per day (1-standard deviation BELOW its 3-year average), while looking under the hood at the stocks in the S&P 500 the standard deviation of returns has been 1.8% on average (1-standard deviations ABOVE its 3-year average). As an indication of just how much turblience there is below the surface, earnings day moves are 4.2x average daily moves for US stocks (3.6x for European and 2.3x for Asian) in this earnings season so far.


Using the charts below, Goldman shows the earnings day absolute move in stocks relative to the non-earnings days 1 month before and after. This includes data through November 9, 2017 for the current quarter. Earnings day moves are above average levels relative to the past decade, while non-earnings days have had lower volatility.


What does this bifurcated volatility pattern mean? According to Goldman, "this as evidence that fundamental uncertainty is rising (stock moves on earnings days) while general macro fears have fallen (stock moves on non-earnings days)." In practical terms, and based on the relationship of index volatility and the standard deviation of S&P 500 stock returns over the past 15 years, Marshall writes that he would expect "the SPX to be moving 90bps per day rather than the current 17bps. This implies realized volatility above 15%." Of course, that may not be possible (or allowed by central banks) because as we wrote two weeks ago, the beta of VIX spot has exploded to -19, which means that even a mere 90bps down day in the S&P could launch a self-reinforcing vol cascade which crushes the millions of vol sellers, unleashing a another sharp correction, or worse.


Goldman"s conclusion:


A rise in single stock volatility is generally associated with a decline in equity returns. Based on the relationship between the standard deviation of S&P 500 stock returns and forward returns in the SPX over the past 15 years  (controlling for index returns and index volatility), this elevated level of stock volatility would suggest a decline in the SPX of 0.8% over the next two weeks +/- 1.5%.


Alas, that observations is completely meaningless as due to the margin of error, the market can rise by 0.7% and Goldman can still claim it was right.


In any case, Goldman ends on a cautious note and warns that "while we do not believe this alone is a compelling reason to sell the market today (or buy VIX), we believe it is a trend worth monitoring closely."


Monday, November 6, 2017

Divergences sending bearish message to stocks?


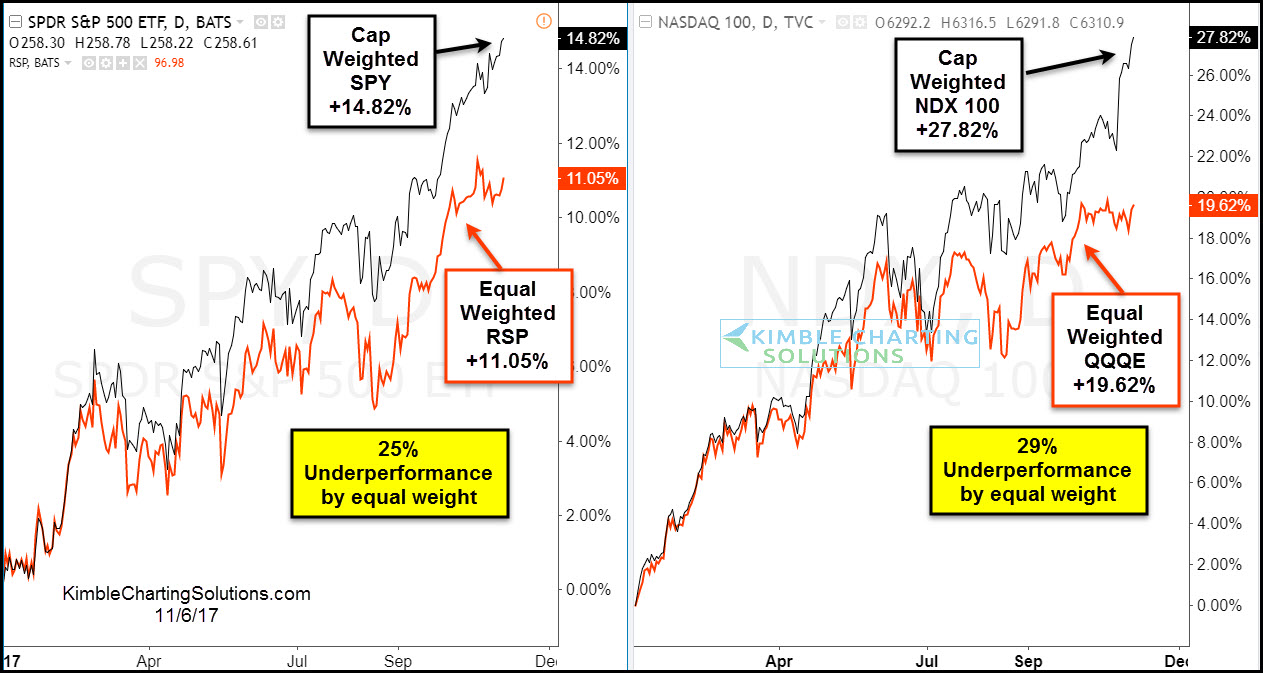
The 2-pack below compares the Cap weighted and Equal weighted performance year to date of the S&P 500 and Nasdaq 100-


CLICK ON CHART TO ENLARGE


The chart above reflects that the equal-weighted S&P 500 ETF (RSP) and the equal weighted NDX 100 ETF (QQQE) have both underperformed the Cap weighted indices by over 25% this year. Both of the equal-weighted ETF’s over the month have trades sideways, while the Cap weighted are moving higher.


The lagging performance by the equal-weighted ETF’s reflects that fewer stocks are participating in the rally.


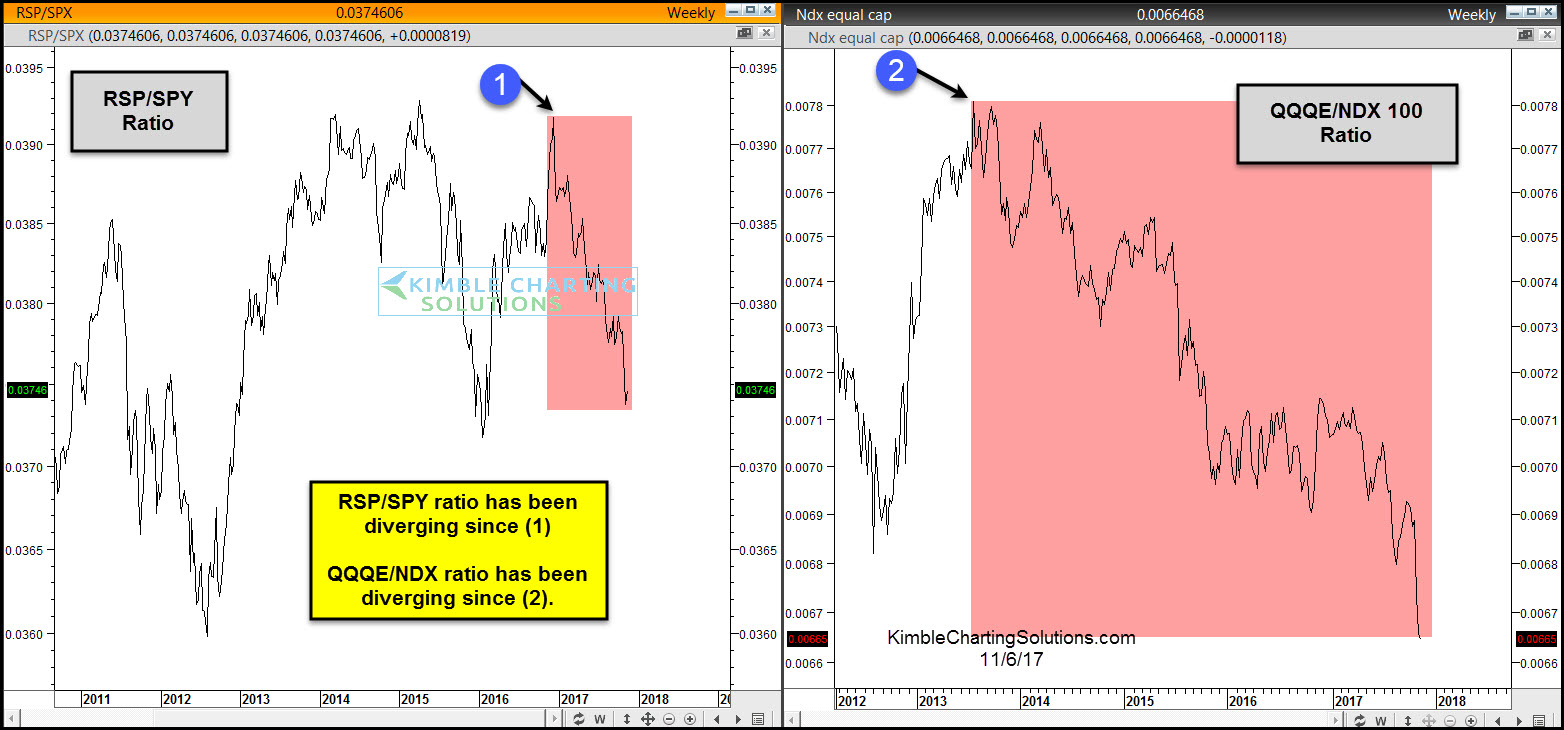
Below looks at Cap/Equal weighted ratios for the S&P 500 and NDX 100-


Divergences are taking place by both ratios as the S&P has been diverging since earlier this year and the NDX has been diverging the past few years.


The divergences by themselves do not mean the market has to head south right or a bear market is ready to start. Historically when fewer and fewer stocks are powering a bull market rally, it does reflect a thinning of the market and could result in unimpressive gains going forward.


Stock bulls want to see these ratios heading higher, not continuing to diverge.


Why you see chart pattern analysis with brief commentary:   There is a ton of news and opinions about markets and stocks that make the decision-making process more difficult than it needs to be.   


I believe the Power of the chart Pattern provides all you need to see what is taking place in an asset and determine the action to take. 


This approach has worked well for me and our clients and I encourage you to test it for yourself.


Receive my free research posted on the blog daily here 


Or,  send an email if you would like to see sample research and take me up on a trial of my premium or weekly research where I provide actionable alerts on breakouts and reversals in broad market indices, sectors, commodities, the miners and select individual stocks 


Email services@kimblechartingsolutions.com  


Call us Toll free 877-721-7217 international 714-941-9381 


Website: KIMBLECHARTINGSOLUTIONS.COM 


Tech Stocks Accounted For 75% Of The Market"s October Return

For some context on the unprecedented dominance of the tech sector on the overall market, here is some perspective from BofA"s Savita Subramanian on October returns, when Tech continued to lead the other ten sectors, generating +7.8% on a total return basis. This translates into a whopping 75% of the S&P 500"s return last month!


Furthermore, with virtually every lagging hedge fund rushing to buy the tech sector, chasing such activist central banks as the SNB, the sector"s 24.5% weight in the S&P 500 is now the highest since October 2000.


That said, considering tech companies reported some of the strongest 3Q earnings results, the best revision trends, and rank at the top of BofA"s quant model, is there anything to be concerned about?


According to BofA, the biggest risk is the extreme crowding and positioning by fund managers. As Subramanian expains: "we hear frequently from clients, "you don"t want to sell Tech until year end." And funds certainly reflect this sentiment: Tech is the most overweighted sector by large cap active managers, displacing Discretionary whose relative weight dropped for the sixth consecutive month." As noted above, the recent Tech rally means the sector now represents 24% of the S&P 500 index - a post-tech bubble high - and a remarkable 30% of all active fund holdings today, the highest levels in BofA data history since 2008 (Chart 1).


What about other sectors: in addition to Tech, Utilities (+3.9%), Materials (+3.9%), and Financials (+2.9%) outperformed last month. Laggards were generally defensive: Telecom (-7.6%), Staples (-1.4%) and Health Care (-0.8%) underperformed the most, while Energy (-0.7%) was also in the red despite the rally in oil prices.


YTD, Tech maintains its dramatic lead (+37.2%), contributing just under half of the S&P 500"s 16.9% total return, followed by Materials (+20.3%) and Health Care (+19.4%). Telecom (-11.9%) and Energy (-7.2%) remain in the red.


To be sure, the impact of tech on underlying financial metrics is also staggering, as the following charts from Credit Suisse show: with tech, EBITDA margins are near all time high. Ex tech, they are roughly 3% lower and in secular decline, courtesy of high barriers to entry.


The next chart shows that while tech holds the highest share of S&P market cap, it is also the fastest growing sector.


And while the massive crowding in the tech sector is a red flag for Bank of America, for Credit Suisse this is perfectly normal, and in a report released today, its analyst Andrew Garthwaite writes that "many clients cite data indicating that just a handful of stocks (largely tech) account for almost half of returns. However, we don"t find such analysis to be particularly informative; such dynamics are far from unusual – in fact, it is often the case that a small number of stocks account for an outsized share of market gains, as shown in the chart below."


Of course, it is also that same small number of stocks that gets hammered once the tide reverses. For now, however, with vol at all time lows, traders have yet to express any concerns that the tremendous tech rally of 2017 is in dangers of ending. Ironically, the single biggest threat to the US tech sector may be the US government itself, which is starting to realize that it is leaving just a little too many pounds of flesh on the table...


Tuesday, October 17, 2017

VIX Shorts Hit New Record High As S&P Surpasses 2017's Most Bullish Forecast

At the start of 2017, the most optimistic strategist forecast the S&P 500 at 2,500 by year-end.


S&P Year-End forecasts as of 1/6/17...


In the last few weeks, the market has not only surpassed that most-exuberant guess...


As Bloomberg notes, despite two strategists upgrading their targets on Friday, professional prognosticators are hardly raging bulls: At 2,524, their average estimate represents a 1% decline in the benchmark gauge.


But as it has melted up from there, investors are entirely unafraid as traders extend their VIX shorts to a new record high...


Additionally, the number of VIX contracts outstanding just hit a fresh record. Wagering on equity swings has become increasingly popular this year as the gauge of stock swings heads for its lowest ever annual average. While the VIX is up this month, history shows that it tends to fall in the fourth quarter.


So what now? RCMAlternatives.com has developed the folowing nifty flowchart of just how to proceed from here...


Thursday, October 12, 2017

"Black Swan" Anxiety Has Never Been Higher

The Fed"s Williams warns that they "don"t want there to be excesses in financial markets... "


Two quick things...


The market has almost never been this expensive...


As Peter Boockvar warns: "Almost there. S&P 500 price to sales ratio is just 4% from March 2000 peak."


And investors have never been more concerned about "black swans"...


As Bloomberg notes, concern is building that years of record-setting gains for U.S. stocks may give way to a market plunge, according to Jim Paulsen, Leuthold Group Inc.’s chief investment strategist. In a report Monday, he cited the Chicago Board Options Exchange’s SKEW Index, which shows the perceived risk for a so-called black-swan event that’s reflected in S&P 500 Index option prices.


Trade accordingly...

Monday, September 4, 2017

VIX Set For Lowest Annual Average Ever, But...

While intra-month the CBOE Volatility Index reached its highest since November, before plunging back to earth into the end of the month, VIX is still on track to post its lowest annual average on record.


Bloomberg notes that in the past decade, VIX gains in August were followed by September declines in all but one instance.


While VIX has collapsed so far this year, it may not last.


Though VIX ended up paring its August gain to 3.2% - a gauge tracking longer-term wagers posted its biggest increase since January 2016.


In fact, after last month’s 11 percent gain, the CBOE S&P 500 3-Month Volatility Index has reached its highest level relative to the VIX since Aug 2012"s European credit crisis.


The September Federal Reserve gathering and debt-ceiling discussions are among events that could lead to increased market volatility at a time when the S&P 500 Index trades near a record high.

Saturday, September 2, 2017

How To Beat The Market - Buy The F**king Tuesday

Authored by Dmitri Speck via Acting-Man.com,


Recurring Phenomena


Many market participants believe simple phenomena in the stock market are purely random events and cannot recur consistently. Indeed, there is probably no stock market “rule” that will remain valid forever.


However, there continue to be certain statistical phenomena in the stock market – even quite simple ones – that have shown a tendency to persist for very long time periods.


This chart illustrates a “rule that changed” – for eight decades (actually longer, but on this chart we can see the final eight decades during which the rule applied) the dividend yield on the S&P 500 Index would never fall much below 3%. Whenever that level was reached, everybody knew a correction or a bear market was imminent. This changed profoundly in the mid 1990s. The culprit: massive monetary inflation. [PT] – click to enlarge.


In today’s report I examine such a phenomenon: namely, the performance of the S&P 500 Index on individual days of the week.


Tuesday is a Particularly Strong Trading Day, Friday a Weak One


The chart below shows the annualized performance of the S&P 500 Index since the turn of the century in black, as well as the cumulative annualized return generated on individual days of the week in blue.


I have measured the price changes from close to close; thus the performance of e.g. Tuesday represents the difference between the closing level on Monday and the closing level on Tuesday.


S&P 500 Index, performance by individual days of the week, 2000 to 2017 – annualized.  Friday is on average a down day.


As you can see, two days are standing out in terms of positive performance: Thursday, and especially Tuesday. The cumulative return of the stock market on Tuesdays alone was actually better than the cumulative return  achieved on all five trading days combined!


By contrast, Friday was on average quite weak. On Mondays and Wednesdays the market by and large tended to move sideways on average.


The difference between these returns, which was measured over no less than 4,436 trading days, is statistically quite significant. This suggests we are unlikely to merely look at a random phenomenon [ed. note: even though it is not possible to actually explain it off the cuff, the statistical significance indicates that an explanation must exist. PT].


What do these data look like in specific market environments though, i.e., during bull and bear market periods?


The Days of the Week Under the Microscope


The next chart shows the performance of the S&P 500 Index since the turn of the century in black, as well as the cumulative return achieved on individual days of the week in other colors – all indexed to 100.


S&P 500 Index, cumulative returns by day of the week, 2000 – 2017, indexed.  Even in 2008 investing exclusively on Tuesdays ended up generating a gain! – click to enlarge.


Take a close look at the performances during the bear market after the year 2000 peak and in the course of the 2008 financial crisis. Even in these otherwise difficult times for the market, Tuesdays (red) and Thursdays (blue) delivered pretty decent results.


In 2008, the cumulative return generated on Tuesdays was actually significantly positive, in the face of an extremely bearish market trend!


In short, these two trading days are indeed rather extraordinary.


Combinations Improve Results


By investing only on Tuesdays, one would have been able to outperform the market over the entire period examined above. However, in rally periods, such as e.g. the rally beginning in 2009, the cumulative return achieved on Tuesdays lagged behind that of the trading week as a whole.


That should actually be expected, as strong gains require longer investment periods, and being invested just 20 percent of the time is simply unlikely to be enough.


This problem can be addressed by implementing combinations. As already illustrated by the first chart, overall, the S&P 500 Index has gained 2.95% annualized since 2000, while the cumulative gain of all trading sessions on Tuesdays was 3.19%.


Combinations can make a very big difference though. Investing on Tuesdays and Thursdays combined would have generated an annual return of 5.52%. If one had additionally sold the market short on Fridays, the annualized gain would have improved to 8.07% –  definitely an excellent result!


Combining Independent Factors Will Lead to More Stable and Reliable Returns


Alas, there is a drawback to this combination strategy as well: the returns generated on individual days of the week are interdependent. For instance, it may well happen that at some point in the future, in an otherwise slightly uptrending stock market, Tuesdays and Thursdays no longer deliver a strong return over the entire investment period, but turn out to be weak instead.


If that were to happen, it would be highly unlikely that the returns generated on Fridays would remain as weak as they have been to date. In short, all three partial components of the strategy would then exert an unfavorable effect on the overall investment result.


From a statistical perspective, it is therefore as a rule better to combine independent factors, such as those that can be found with the help of the Seasonax app (available on Bloomberg and/or Thomson-Reuters). The probability that what was valid in the past will continue to be valid in the future is higher that way.


PS: For now, you can probably relax on Mondays and enjoy the action on Tuesdays!

Thursday, August 17, 2017

"The Best Of Times" - Stocks Surge To 2nd Longest Dip-less Streak In History

The S&P 500 has not seen a drawdown of more than 3% since the election last November. As PensionPartners" Charlie Bilello notes, this is the second longest run in history...


The Dow has hit 31 all-time highs in 2017 and has done so with no more than a 3% pullback.


Additionally, Bilello notes this is the fourth longest streak in US history without a 5% drop...


It’s been more than a year since the S&P 500 has suffered a 5% pullback...


"The best of times" indeed...


Thursday, July 27, 2017

Tech Wreck 2.0? FANG Stocks Suddenly Slammed, Nasdaq Dives, VIX Spikes Above 10

VIX is suddenly spiking higher (back above 10) and stocks lower - amid no obvious catalyst...


Nasdaq is tumbling...


As Dow Transports suffer their second biggest drop in 10 months...


And FANG Stocks dive...


NFLX and GOOGL are the big laggards today/this week...


We note that Bloomberg reported earlier that gains for Facebook and Amazon.com account for about two-thirds of the S&P 500’s 5 point gain.


Do Algos read Howard Marks?

Sunday, July 16, 2017

Hedge Fund CIO: "We’ve Realized Roughly 3 Years Of Gains In The First 6 Months Of 2017"

As part of the local Sunday ritual, here is Eric Peters with his latest Weekend Notes, providing some context on recent, and not so recent market moves.


Weekend Notes


“US stocks rise roughly 7% per year,” he said. “Same holds true for Australia; basically, for all economies uninterrupted by catastrophic war at home.”


The 7% roughly equals 5% nominal GDP growth plus an extra 2% which is due to the S&P 500 index periodically kicking out bad companies and replacing them with better ones.


“Sometimes the market runs ahead of this 7% rate of return, which doesn’t mean it’s the wrong price, it simply means it’s premature.” In a world of fiat money, high prices are never wrong, they’re only early. 


“It took fourteen years for the stock market to return to its 1968 highs,” he continued. “And at that point in 1982, with overnight interest rates at 20% and the S&P 500 price-to-earnings multiple at roughly 8, the market still had miles to run.”


By the year 2000 with the S&P 500 P/E multiple at roughly 29, it was kind of the opposite. Then roughly 13 years later, it broke back above that Jan 2000 high, with a P/E ratio of roughly 17.


Today the trailing P/E is roughly 26, with overnight rates 19% below the 1982 levels, and 4.5% below the 2000 levels. 


“So we’re obviously not at a similar point to 1982,” he continued. “But where are we?”


Nerds forecast a 3% a year S&P 500 returns for a decade. Quants say we’re in the top few percentiles of historical valuation across every asset class (except volatility).


The S&P 500 is up roughly 10% this year. Which means we’ve realized roughly 3yrs of gains in the first 6mths of 2017.


“At some point, you rally so much that your 10yr return forecast turns flat. At which point you could go sideways for a decade.” But roughly speaking, stocks either go up, or down.


Wednesday, June 28, 2017

Think Small- Bullish breakout for Micro Caps!

think


So far this year, Small & Micro Cap ETF’s are lagging the S&P 500. Over the past month the opposite is taking place, as small and micro caps have been stronger. Below takes a peak at micro cap ETF (IWC) and the potential bullish pattern it is attempting to breakout from.


Micro cap etf IWM chart, kimble charting solutions


CLICK ON CHART TO ENLARGE


While IWC was trading sideways for several months, it lagged the S&P 500. Now that IWC is working on a breakout at (2), it has been stronger than the S&P 500 this past month and is now working on hitting all-time highs. Historically when Small & Micro caps are hitting all-time highs at the same time, sends bullish message to large caps.


Full Disclosure- Premium and Sector Members are long small cap stocks due to this pattern in IWC and IWM.


This information is coming to you from Kimble Charting Solutions.  Home of the Power of the Pattern where we provide Concise, Timely and Actionable chart pattern analysis and commentary so in very little time you know the pattern at hand and action to take 


Send us an email if you would like to see sample reports or a trial period to test drive our Premium or Weekly Research


Website: KIMBLECHARTINGSOLUTIONS.COM


Questions: Email services@kimblechartingsolutions.com or call us toll free 877-721-7217 international 714-941-9381

Thursday, May 25, 2017

Another Rigged Market: Scientific Study Finds Systemic VIX Auction Manipulation

To the list of "rigged" markets (e.g. Libor, FX, Silver, Treasuries...) we can now add VIX (which explains a lot) as two University of Texas at Austin finance professors find "large transient deviations in VIX prices" around the morning auction, "consistent with market manipulation."


As Bloomberg reports, in addition to being an index that is much quoted in articles about market complacency, the VIX is used as a reference price for derivatives: If you want to bet that stock-market volatility will go up, or down, you can buy or sell futures or options on the VIX. These products are cash settled: The VIX is not a thing you can own, so if your option ends up in the money you just get paid cash for the value of the VIX at settlement.  


CBOE gets an official settlement level of the VIX based on a special monthly settlement auction of S&P 500 options. The auction runs from 7:30 a.m to 8:30 a.m., Chicago time. Traders submit bids and offers for S&P 500 options, the auction matches buyers and sellers to find clearing prices, and the prices of those S&P 500 options are used to compute the official settlement level of the VIX.


Guess what?


At the settlement time of the VIX Volatility Index, volume spikes on S&P 500 Index (SPX) options, but only in out-of-the-money options that are used to calculate the VIX, and more so for options with a higher and discontinuous influence on VIX.


We investigate alternative explanations of hedging and coordinated liquidity trading. Tests including those utilizing differences in put and call options, open interest around the settlement, and a similar volatility contract with an entirely different settlement procedure in Europe are inconsistent with these explanations but consistent with market manipulation.


That"s from this paper by John Griffin and Amin Shams of the University of Texas, who find a lot of trading in the S&P 500 options underlying the VIX during these settlement auctions, trading that pushes the settlement price of the VIX up or down. So for instance in months where the trading pushes the VIX up, the prevailing price of the VIX-influencing options will jump during the auction, peak at around 8:15 a.m. (the deadline for VIX-related bids in the auction), and then drop seconds after the auction ends when the options start trading normally:


The blue line there is a measure of the indicative prices of VIX-influencing options, spiking at 8:00 a.m. and peaking near 8:15. (If you ignore the numbers on the axis, you can almost think of it as being a chart of the VIX price.) The red dot is the trading price of those options about 25 seconds after the auction finishes.


The average effect is something like 0.31 VIX points, sometimes up and sometimes down, depending on the month.


 What is going on? Usually when you see patterns like this, the innocent explanation is hedging. But Griffin and Shams consider and reject that notion here, noting for instance that traders don"t seem to be closing out existing hedge positions but instead adding new ones. They argue that it"s more likely to be explained by attempts to move the VIX: If you are a dealer who is long (short) VIX futures, you can push up (down) the VIX at settlement by buying (selling) some deep-out-of-the-money S&P 500 options.


That is generically true in any derivatives market: If you are long a derivative, you can buy the underlying and push up the derivative price. But Griffin and Shams give a list of reasons why you"d almost expect the VIX to be manipulated:


First, the upper-level VIX market is large and liquid, enabling a trader to invest a sizeable position in VIX derivatives. In contrast, many of the lower-level SPX options, where the VIX values are derived from, are illiquid.


Griffin and Shams calculate that "the size of VIX futures with open interest at settlement is on average 5.7 times the size SPX options traded at settlement, and it is 7.3 times for VIX options that are in-the-money at settlement."


So if you are a trader who owns a lot of the market in VIX futures, you could push around a large dollar value of futures by trading a small dollar value in options. This is particularly true because the S&P option volume is divided among many strikes, and the illiquid deep out-of-the-money S&P 500 options have a big influence on the VIX: You can move the price of those options a lot with relatively small trades, and those price changes have a disproportionate effect on the VIX.


Second, the VIX derivatives are cash settled. Therefore, if the VIX settlement value deviates from its true value, the VIX position will automatically be cashed out at the deviated price.


If cattle are trading at the wrong price when your cattle futures settle, that doesn"t matter so much, because you just get the cattle. But you can"t just get the VIX: You get cash, so if the VIX is at the wrong price at settlement, that"s the price you get.


Third, the settlement occurs within a short period of time based on the SPX options pre-open auction.


You don"t have to intervene over some long period to keep options prices up; you can just submit bids in the pre-opening auction once a month and move the settlement price for that month.


There is a sort of hierarchy of manipulability in markets. At the top is Libor manipulation: Trillions of dollars of derivatives settled based on Libor, but Libor was calculated by essentially asking banks "what should Libor be?" The banks didn"t even have to do any trading in order to push the number around; manipulation was, in effect, costless. (Later, with the fines, it was costly.)


At the bottom is, like, manipulating the price of a stock by trading that stock. There are cases of it! It"s a thing. But it is a dumb thing; it really shouldn"t work. If you buy a stock, you will push the price up, sure. But to make any money you then have to sell the stock, which should push the price right back down.


But if you are going to manipulate a tradable market -- as opposed to a made-up one like Libor -- then VIX looks pretty tempting.


The product that you trade (S&P 500 options) is different from the product where you make your money (VIX futures and options), and the trading market is in the relevant sense smaller than the derivative market: You can move a lot of value in VIX products by trading a small amount of value, in a confined period of time, in the underlying market. So you can cheerfully lose money executing the manipulation -- trading the S&P options -- and make back more in the derivative.


If Griffin and Shams are right that there"s manipulation, there"s no particular pattern to it: Sometimes VIX gets anomalously pushed up during the settlement, sometimes down. That"s consistent with, for instance, a story of big dealers adding up their positions before each monthly settlement, realizing that they"re net long (short), and trying to push VIX up (down) to help out their positions. It would be like the kind of Libor manipulation that banks did to help out their trading books (which was up or down depending on their positions) -- not the kind of Libor manipulation that banks also did to disguise their funding costs (which moved Libor systematically down).


Finally, The Wall Street Journal notes that it is, of course, tough to rule out the possibility that something more benign is going on. For example, investors who had used the expiring derivatives to protect themselves could be seeking replacement protection when they participate in the auction, some say. Messrs. Griffin and Shams believe it’s not hedging activity due to the trading patterns they observed.


Full Study below:

Monday, May 8, 2017

VIX Crashes To A 9 Handle - Lowest Level Since Feb 2007

Amid the "calmest" market for the S&P 500 since 1964... 


Traders are shedding protection at a record clip. For the third time in the last week, VIX just traded with a 9 handle - down to 9.73 - the lowest since Feb 2007...


The last two trading days have seen some "odd" shifts in the equity-vol correlation regime though...


And judging by the collapse in realized vol, VIX could have further to fall...


Wednesday, March 29, 2017

Strong markets struggling at breakout levels of late


The S&P 500, Banks, Small Caps and Transportation indices continue to climb higher, as the long-term trend remains up. The two charts below, look at performance over the past month and how each index is testing long-term breakout levels.


The chart below looks at how the above mentioned indices have performed over the past 30-days.


S&P 500 , russell banks transports


CLICK ON CHART TO ENLARGE


These key markets are a little soft the past 30-days. The Power of the Pattern below looks at where this softness is taking place.


S&P 500 Russell 2000 transportation Banks


CLICK ON CHART TO ENLARGE


Multi-year trends remain up for each of the indices above, as they create a series of higher lows and higher highs.


Each are testing key breakout levels at each (1), where a little softness has taken place the past month. Transports index (lower right) could be creating a pattern similar to what it did in 1999 and 2007. The odds of Transports creating an identical pattern to the 1999 and 2007 highs is low for sure. If Transports would turn weak at (1), bulls might want to keep a tight stop on positions.


Great news for the bulls if these breakout at (1). If they would breakout, each should attract buyers. Bulls don’t care to see weakness start taking place at each (1). Will be very interesting where each of these are 30 days from now!


Blog:  KIMBLECHARTINGSOLUTIONS.COM/BLOG


Get our daily research posts delivered to your inbox here


Website: KIMBLECHARTINGSOLUTIONS.COM


Questions: Email services@kimblechartingsolutions.com or call us toll free 877-721-7217 international 714-941-9381