Showing posts with label VIX. Show all posts

Wednesday, December 27, 2017

Gold Jumps To Key Technical Level As VIX Collapses

Traders are dumping equity protection and buting chaos protection as VIX tumbles near the year"s lows and Gold jumps back towards its 100-day moving average - and its highest level in a month.


Gold is up 9 of the last 10 days, at its highest since early Dec and testing its 100DMA... ($1292)


And while Bitcoin has stabilized, the divergence between the alt-currencies is closing...


Monday, December 18, 2017

Nasdaq Tops 7,000 For First Time Ever As VIX Crashes

Having passed 6,000 for the first time in April, Nasdaq has now soared 17% since then to surpass 7,000 today...


As soon as cash markets closed last Friday (quad witch), US equity futures spiked... then spiked again on Sunday night"s open, and again at the US equity cash open this morning...


And VIX has been crushed this morning...


Saturday, December 2, 2017

VIX Futures (Don"t) Breakout: a Slinky"s Story of Epic Failure

Volatility Index Futures (VX)


VIX futures spiked up to 13.47 during the session before reversing 12% lower and closing back down at 11.88.  Today"s 13.47 intraday high was just:


  • 0.03 lower than the 11/15 swing high of 13.50, which is...

  • 1.15 lower than the 10/25 swing high of 14.65, which was...

  • 3.85 lower than the 9/05 intraday spike up to 18.50, which was...

  • 0.50 lower than the 8/29 intraday spike up to 19.00, which was...

  • 0.75 lower than the 8/11 swing high of 19.75, which was...

  • 0.45 lower than the 6/29 intraday spike up to 20.20, which was...

  • 1.75 lower than the 5/18 swing high of 21.95, which was...

  • 1.55 lower than the 4/17 swing high of 23.50


fibozachi super rsi vix


Drawing trendlines from each Lower Low provides future resistance at several levels.  After another failed breakout attempt, the only thing noteworthy for VIX bulls is that the Super RSI™ has registered consecutive bullish divergences as the RSI has made higher lows while price has made lower lows.


fibozachi super rsi vix daily resistance levels


A good way to get an early "heads up" that VIX futures may be ready for a true breakout is to draw the trendlines on the RSI"s plot values.  We can see that the RSI value is turned up and poised to break above the trendline from the August highs, but true confirmation of a long-term VIX bottom will require a break above the trendline connecting the two major swing highs from 4/17 and 8/11. 


fibozachi super rsi vix trendline levels


Check out Fibozachi.com to learn about modern technical analysis and trading indicators that actually work.


Wednesday, November 29, 2017

VIX - From Fear Index To Greed Index

Authored by Peter Tchir via Forbes.com,


We have all heard the VIX or volatility index referred to as the Fear Index or Fear Gauge.  Rising VIX was meant to signal fear in the markets.  That is how most investors have historically thought about VIX and traded it (directly or through Exchange Traded Products).


I have gone back in time and combined the total assets under management of XIV and SVXY (two short VIX products) and UVXY and VXX (the two largest long VIX products).  There are others and it doesn"t account for the fact that UVXY incorporates leverage, but the point is the same.


The funds that in theory helped investors "hedge" their portfolios went from being the dominant species to those that enable investors to sell volatility.


Short VIX Funds are Larger than Long VIX Funds (source Bloomberg)


This has rarely been the case.


Typically investors had more interest in hedging their portfolios despite the evidence that the long VIX ETFs and ETNs had to continually perform reverse splits as their share prices drifted lower (some would argue "raced" lower is a more accurate description).


While the products looking to benefit on a volatility spike still attract inflows (otherwise their assets under management would be even lower), they have lost the competition to the VIX sellers.


The only other gap of similar size and duration was in late August 2015 - AFTER the market sold off and volatility spiked.


This time, it is occurring as stock markets are near all-time highs and VIX is still close to the all-time low it set just a few weeks ago (VIX is only calculated since 1990).


Whether this has finally reached a stage of complacency is anyone"s guess, but the "Golden Goose" of selling VIX that I wrote about in March of this year - is clearly not a secret.


I"m not overly concerned about complacency, it is after all, a slow and typically low vol period for domestic markets, but it is something that investors need to focus on.


A spike in volatility could be far more problematic than the market is prepared for as even a small spike could turn into a larger problem with so many people positioned the other way.


Sunday, November 26, 2017

Muir: "People Are Going To Be Wiped Out" By Short-VIX ETFs

Back in August, we highlighted a story in the New York Times about a former manager at Target who decided to try day trading with $500,000 he had saved up. Over the following years, he turned that into $13 million by following one simple strategy: Shorting volatility every time it spiked.


As MacroVoices host Erik Townsend points out, that strategy has worked for many retail investors over the past eight years. And in a brief “postgame” interview with the Macro Tourist Kevin Muir following a longer interview with Francesco Filia, a fund manager at Fasanara Capital, the former explains how many investors don’t understand the risks associated with shorting volatility, as well as the possible repercussions if exchanges and brokerages don’t take the appropriate steps to limit this.


Townsend begins the discussion by asking Muir about a chart he created of the VXX - the long-VIX ETF - which, because of the low-volatility environement, has repeatedly split leading to unbelievable wealth destruction.


Going back to 2009, the price of the ETF has gone from $120,000 a share to just $35. And while a sudden spike in volatility could see it surge, with so many investors on the other side of the trade, it"s worth considering what might happen if they couldn"t pay.


It’s frightening. And I don’t think enough people are – well, there are some – but I don’t think that enough people are really considering all these things. And I think that guys like the Interactive Broker chairman, that are taking proactive steps to make sure that there’s enough margin, we need to see more of that. We need to see more people saying, hey, wait, this is actually a very, very scary instrument that has a lot of risk in it.


I watched a Real Vision interview with John Hempton from Bronte Capital, and he talked about phoning up the infamous Target salesman guy, the fellow that quit his job as a Target manager to trade XIV and all the VXX products, and he turned his 1/2 a million bucks into 13 million bucks. The part that really scared me about it was that John phoned him up and he was expecting to talk to this very sophisticated guy, and his basic takeaway was that, although he had a lot of buzzwords, and he understood kind of what the products represented, he didn’t really understand his true risk.


And I think that there’s just a myriad of people out there that are trading these things that don’t understand that. The more people that wake up and realize this, and stop playing this game, the better off we’ll be, actually.


Brokerages have caught on to this, Muir says. Interactive Brokers, one of the largest online brokerages, is now asking retail investors to post between 300%-400% margin when they short certain VIX contracts – because brokerages recognize that one sharp drawdown in the S&P 500 could blow millions of short traders out of their positions, potentially leaving thousands of customers with massive negative balances that could threaten the brokerages’ existence.


Erik, you’re absolutely correct. And Interactive Brokers, one of the largest electronic brokers out there, realizes the risk. If you look at the way that they’re margining these products, they’re margining them completely different than what the exchanges and everyone else say is the proper amount.


So if you look at the VIX futures, the front month is $6,200 – the exchange minimum is $6,200 – which works out to roughly 50% of a contract. The next month is $4,000, which works out to 30% of a contract. And the far months are $2,500, which works out to 17% of a contract.


But if you go to Interactive Brokers and you want to sell this VIX contract short, you have to put up 300%–400% of the contract. Because they’ve looked at it and they’ve realized that if the S&P has a 10% down move, which isn’t out of the realm of possibility, that the VIX could spike up to 37 really easily. And people are going to be wiped out if that happens.


Should the VIX suddenly spike, the repercussions of such a move would be further complicated by the billions of dollars sitting in various VIX-linked ETFs. Because individuals sellers would probably disappear from the market in such a situation, the ETF market makers would find it nearly impossible to hedge their positions, potentially triggering the dissolution of the funds, or even the collapse of some of these firms.


There’s $1.2 billion of the XIV, which is the short ETF. There’s $1.3 billion of the SVXY, which is another short one. These are staggering numbers.


In my days, when I was on the institutional desk, we had this big – I did index arbitrage, and we used to go out and buy the baskets and sell the futures. One day the risk manager came to me and said, if you had to take this position off (because we had accumulated this big position) how long would it take you? And who would do it?


And I said, the reality is that there’s nobody. You know, we were the biggest player in the market and there was nobody that was going to take this off of us. The only way was to go all the way to expiry.


Well, the reality is that these numbers are way bigger than any market player can absorb. And, if we get a situation where – as Francesco says, all it’s going to take is a return of the VIX from its current level of 10 to its average level of 18 or 19 to wipe out these products.


I guess that’s the point that I want to make: If you’re actually owning these things, you should be aware that all it will take is a move of 80% and then they’re going to wind down these products. So the XIV, when it moves up, if all of a sudden VIX goes from 10 to 18 in a day, they’re going to wind down that product.


And what’s going to be really scary is the amount of VIX futures that is going to have to be bought, because they’re short all those VIX futures and they’re going to have to buy them back.


And I just don’t know who’s going to sell it to them. For the first time – for a long time, I didn’t view this VIX as that big a deal, and there were some smart guys like Jesse Felder that were going on about it – I just think that it has been taken to a level that is becoming increasingly worrisome. And it actually could create a market dislocation in itself.


And what is it Warren Buffett says? What the wise man does in the beginning the fool does in the end. Well, VIX, at this point, we’re hitting a point where if you’re actually continuing to bet on it you’re going to be in the fool category.


Because it’s not going to take much to have a big spike that wipes a lot of people out. And it’s actually very, very worrisome.


Of course, it would take a large intraday move to trigger a truly catastrophic spike in the VIX. But at least one analyst, Bank of America’s Michael Hartnett – whose work we have cited here – believes there could be a 1987-style crash in the early months of 2018. Hartnett’s reasoning? The bearish positioning seen at the beginning of 2017 has completely flipped. Investors’ long positions are larger than they’ve been in years.


And as we’ve repeatedly pointed out, with volatility and volume so subdued, hedge funds have remained overwhelmingly short vol, fearful of missing out on even one tick of the torrid rally for fear of pissing off their clients.


One things for certain: Given the market’s already dramatically overextended rally, the day of reckoning is coming. The only question is will it be a steady decline, or will it happen suddenly?


Given the incredibly stretched nature of positioning, the latter scenario, Muir and Co. believe, seems far more likely.


* * *


Muir"s discussion begins just after the hour mark:


Saturday, November 25, 2017

"You Are Here": Citi"s Stunning VIX Chart

Something snapped in the VIX complex, seconds after Friday"s early close, sending it to a new record low of 8.56 at 13:00:14 ET...


... which as we showed yesterday, was less than 10% of the all time VIX high of 89.53, hit on October 24, 2008.


However, while the Friday VIX snap - which is still on the feeds and thus wasn"t a fat finger error - is yet another indication of just how broken, and/or how overrun by vol sellers the market is, below we present two even more striking, longer-term perspectives on the VIX courtesy of Citi.


As Citigroup notes, even after the recent backup, the VIX index is in its 0.5th percentile – that is, historically it has been wider than currently on 199 out of every 200 days. In other words, the "you are here" on the chart below has never been more to the left.


But it is not just a question of having reached this low level of implied volatility. As much as anything it is about the extended period of time we seem to be spending there.


Which brings us to one of the most striking VIX charts we have seen: as Citi"s strategists note, over the last six months, VIX has spent more than 40 days below 10. Putting this staggering outlier in context, the index has never managed to accumulate more than 6 days that low, measured over the same time interval, over the last 30 years. Or, as today"s central bankers would say after one look at the chart below which they have created "perfectly normal."


Commenting on the above charts, Citi, which has turned increasingly bearish on credit in recent weeks, says that "implied vol is, in other words, sailing in the same unchartered waters as corporate credit", and concludes sarcastically, "why buy vol if you believe that any selloff is impeded by a central bank backstop?"


Why indeed?


So keep selling vol until one day vol finally explodes as CBs lose control, wiping out trillions in fake wealth in the process; just please don"t use the words "market" and "price discovery" until that happens.


Thursday, November 16, 2017

Stocks Are Surging, But What Happens When Europe Closes?

Not the same shit on this different day...


The Dow is up 180 points, VIX is below 11.5, HYG is up the most in 3 months... all following China"s massive 820 billion Yuan liquidity injection.


There"s just two things...


The FX market ain"t buying it...


And nor are bonds...


So what happens when Europe closes...


Tuesday, November 14, 2017

Dow Drops To 3-Week Lows

Well that escalated quickly as the USDJPY ramp momo ignition failed...


 VIX pushed up to itshighest in 3 weeks as stocks tumbled below yesterday"s lows to 3-week lows...


All major indices red for November


The question is... are HY bonds the canary?


Goldman Discovers Something Odd: Stock Moves Are Increasing Even As Index Moves Are Decreasing

One wouldn"t know it by looking at the moves in equity indexes, but this earnings season has been unusually volatile for stocks, which however has yet to translate into bigger moves at the macro level. That is the bizarre observation made by Goldman"s derivatives strategist John Marshall (whose team grew by one when ex-Deutsche Banker Rocky Fishman joined recently).


As Goldman shows in the chart below, while earnings day moves have increased in the US and globally, and stock dispersion generally has jumped to the highest since the Trump election, index moves have been the smallest in years. Goldman believes this is further evidence "of increased uncertainty in the equity market."


Quantifying the delta between the two vol indicators, Goldman writes that over the past two weeks, the SPX has moved an average of 0.17% per day (1-standard deviation BELOW its 3-year average), while looking under the hood at the stocks in the S&P 500 the standard deviation of returns has been 1.8% on average (1-standard deviations ABOVE its 3-year average). As an indication of just how much turblience there is below the surface, earnings day moves are 4.2x average daily moves for US stocks (3.6x for European and 2.3x for Asian) in this earnings season so far.


Using the charts below, Goldman shows the earnings day absolute move in stocks relative to the non-earnings days 1 month before and after. This includes data through November 9, 2017 for the current quarter. Earnings day moves are above average levels relative to the past decade, while non-earnings days have had lower volatility.


What does this bifurcated volatility pattern mean? According to Goldman, "this as evidence that fundamental uncertainty is rising (stock moves on earnings days) while general macro fears have fallen (stock moves on non-earnings days)." In practical terms, and based on the relationship of index volatility and the standard deviation of S&P 500 stock returns over the past 15 years, Marshall writes that he would expect "the SPX to be moving 90bps per day rather than the current 17bps. This implies realized volatility above 15%." Of course, that may not be possible (or allowed by central banks) because as we wrote two weeks ago, the beta of VIX spot has exploded to -19, which means that even a mere 90bps down day in the S&P could launch a self-reinforcing vol cascade which crushes the millions of vol sellers, unleashing a another sharp correction, or worse.


Goldman"s conclusion:


A rise in single stock volatility is generally associated with a decline in equity returns. Based on the relationship between the standard deviation of S&P 500 stock returns and forward returns in the SPX over the past 15 years  (controlling for index returns and index volatility), this elevated level of stock volatility would suggest a decline in the SPX of 0.8% over the next two weeks +/- 1.5%.


Alas, that observations is completely meaningless as due to the margin of error, the market can rise by 0.7% and Goldman can still claim it was right.


In any case, Goldman ends on a cautious note and warns that "while we do not believe this alone is a compelling reason to sell the market today (or buy VIX), we believe it is a trend worth monitoring closely."


Monday, November 6, 2017

The Deflating Rally

Authored by Sven Henrich via NorthmanTrader.com,


Record prices continue to be printed on US indices as the global multiple expansion on the heels of still ongoing record central bank intervention has yet to slow down in a significant way.


All central banks were in essence dovish in recent days and weeks, whether the FOMC, the ECB, the BOE and of course the ever active BOJ as well as the SNB as it showed a new record $88B in direct holdings of US stocks.


Yet, despite the record prices on indices, the rally appears to be deflating from within.


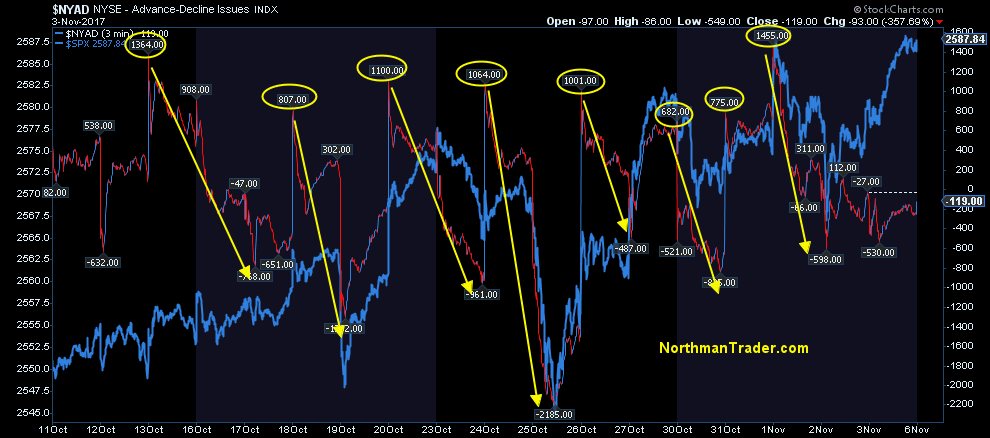
In the past several weeks I’ve pointed out a very specific pattern of positive internals on market opens and then a very distinct pattern of internals weakening throughout most days:


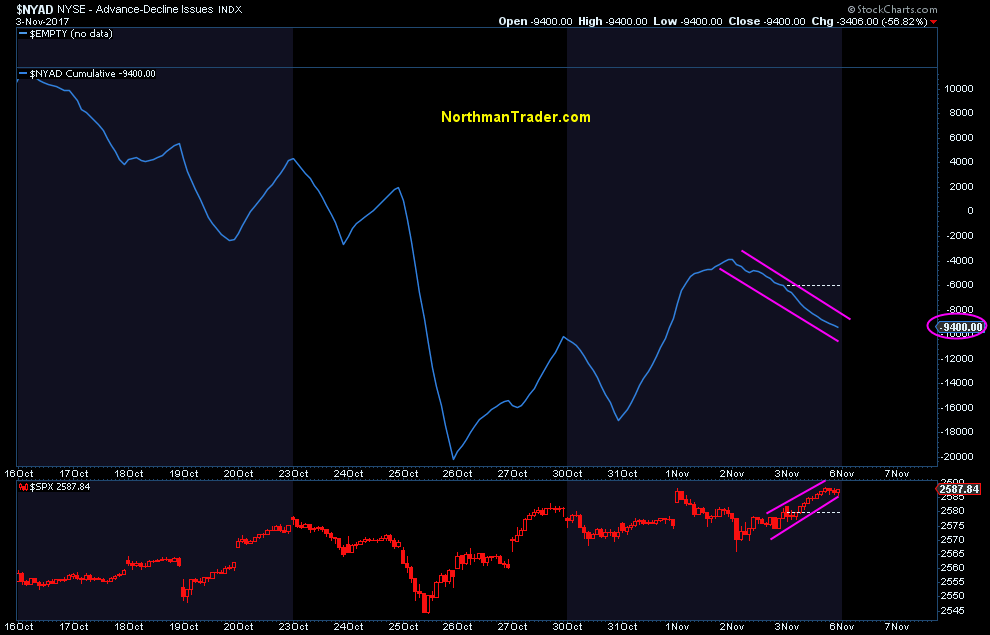
This trend has impacted the cumulative advance/decline picture and shows that recent highs have come on a negative cumulative advance/decline:


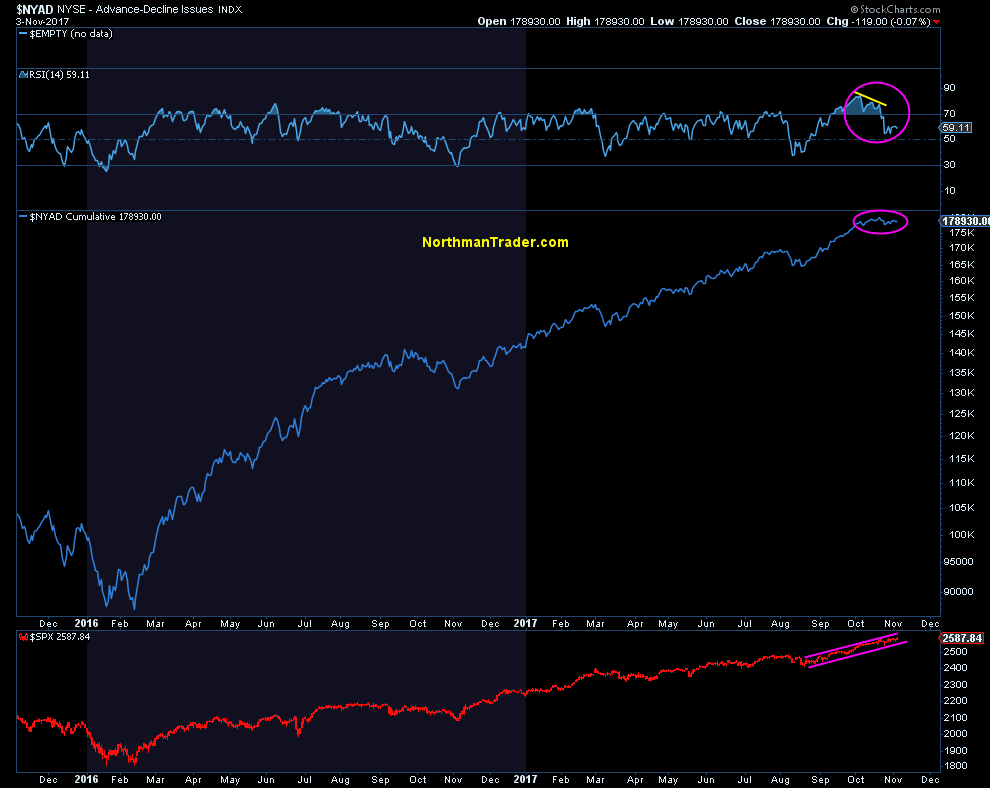
Since this rally began with massive global central bank intervention in February 2016 the cumulative advance/decline picture has often been cited as a sign of underlying core strength in markets. This picture has changed:


Recent highs came on negative divergences in relative strength despite index prices continuing to advance in a seemingly steady trend.


Yet the internal picture is practically collapsing.


Take the recent highs in the Nasdaq.


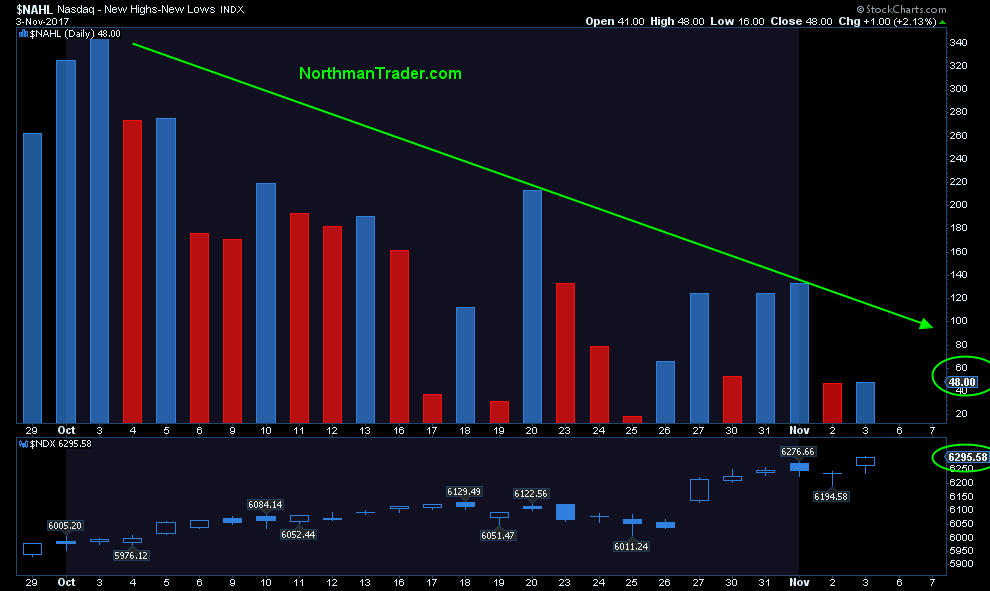
Ever since the beginning of October all new highs in the $NDX have come on fewer new highs versus new lows. Indeed Friday’s $NDX highs came on the lowest expansion yet:


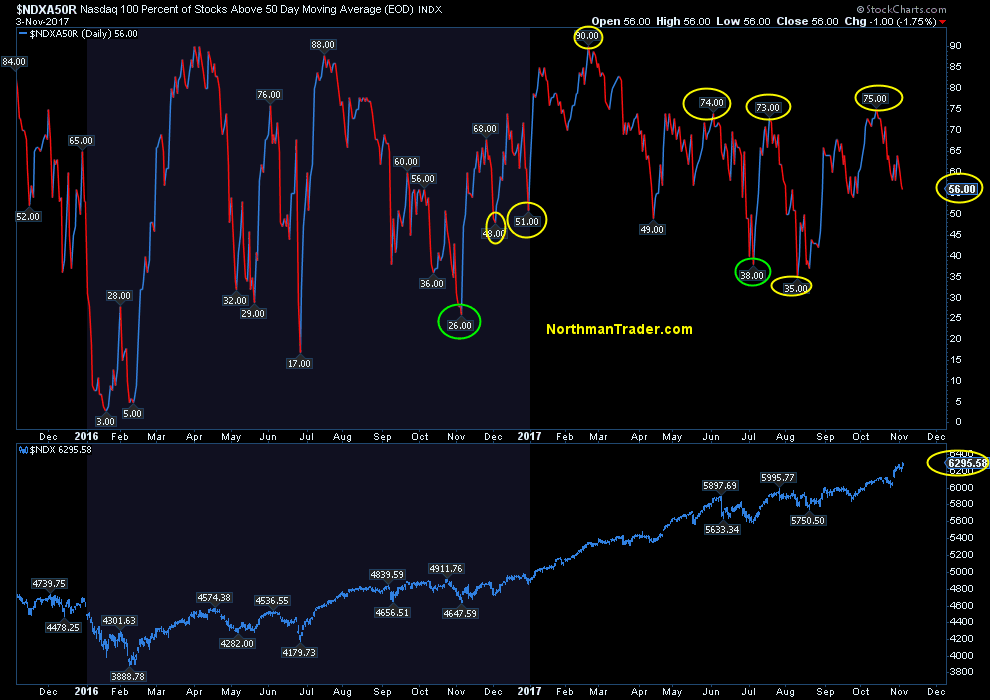
On $NDX itself we can observe a complete collapse in the amount of stocks above the 50MA as $NDX printed new highs. Only 56% of components are still above the 50MA:


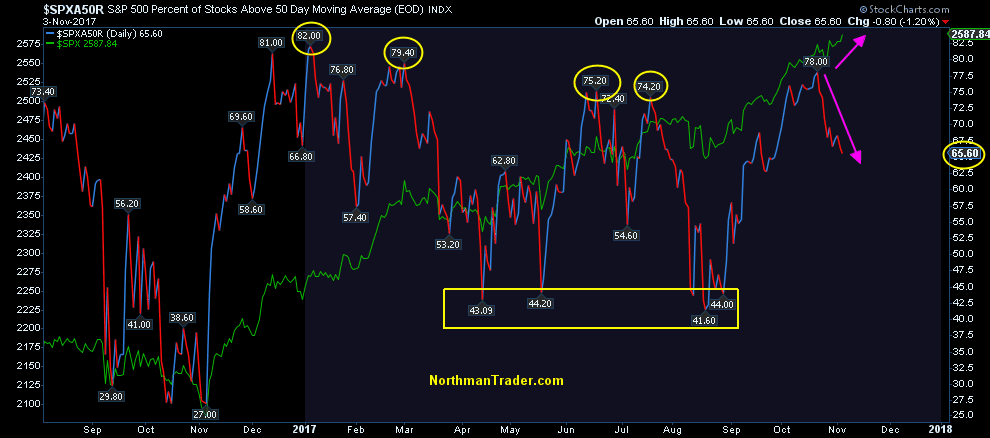
A similar picture can be observed on the $SPX:


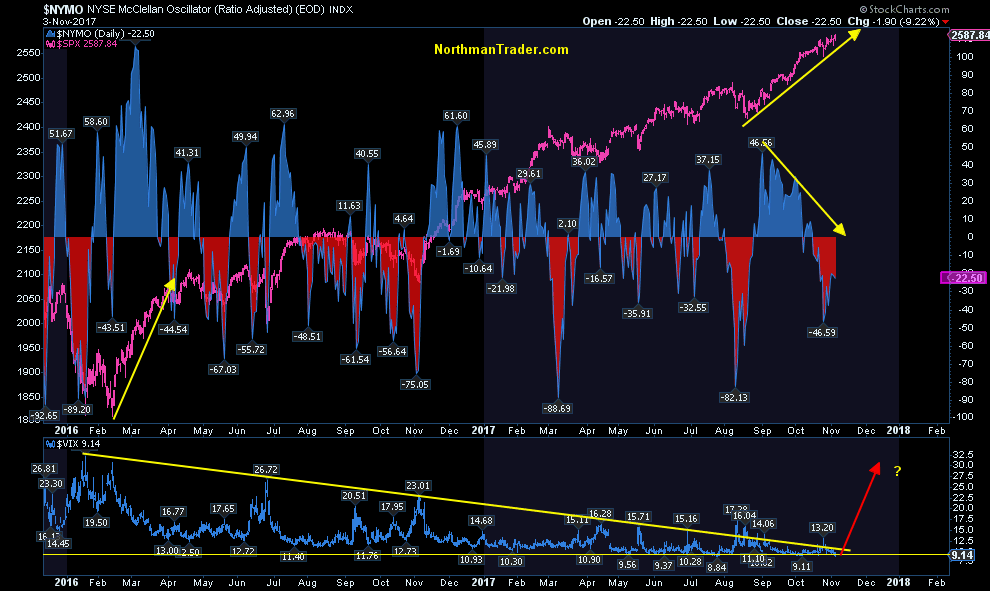
And of particular note: All recent highs have come on a negative $NYMO:


The message: Somebody is selling this market. Every day. And it’s very cleverly done as to not disturb the seeming tranquility in markets.


Note that despite all the selling volatility compression continues at a record pace as during each Friday, no matter what happens in the world, the $VIX is ensured a close below 10 by week’s end:


You’d think we’d have more volatility with such an internal breakdown in stocks. But the concentration of market cap in only a handful of stocks continues to mask the selling underneath.


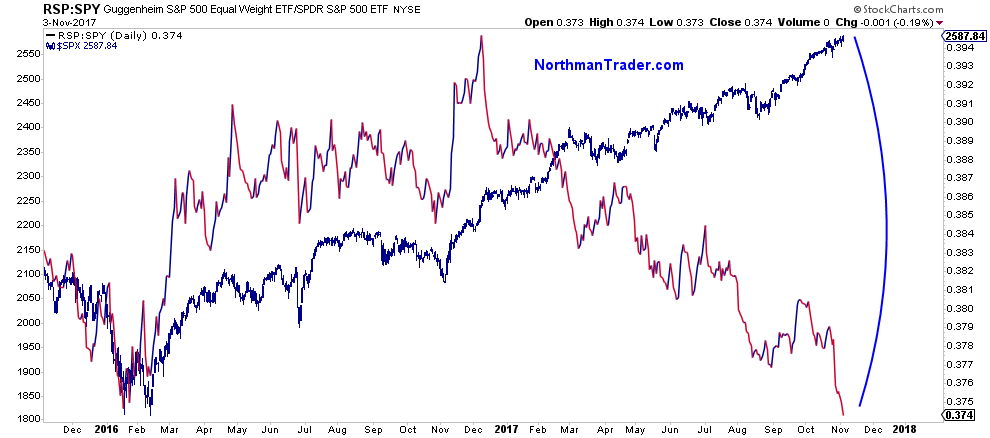
On an equal weight basis we’ve noted the divergence in markets for quite some time. This indicator has now fallen off the cliff as the correlation has completely broken down:


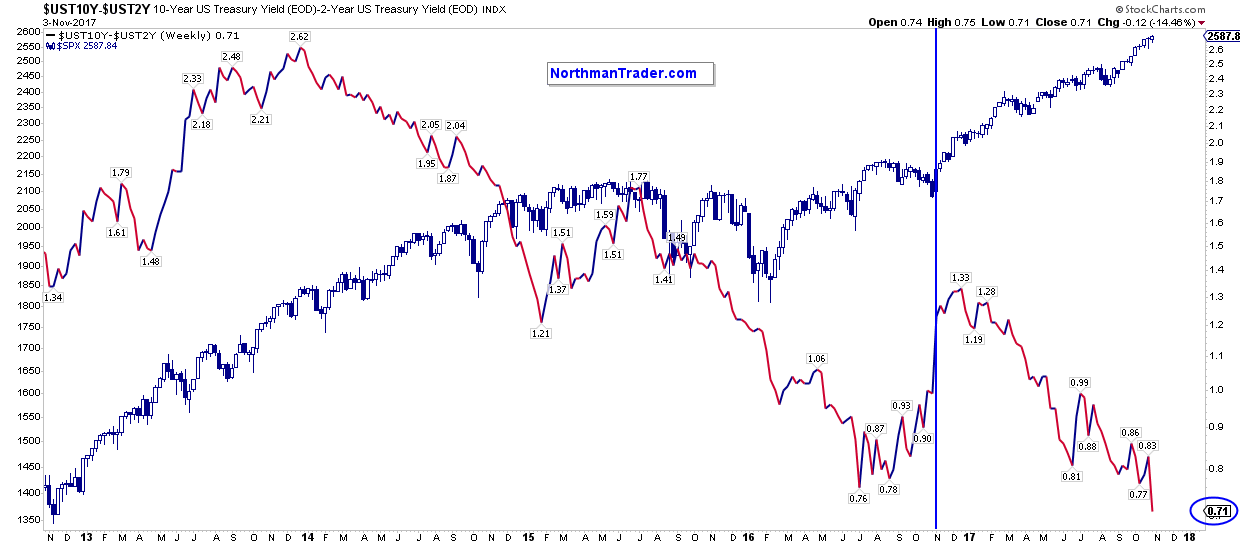
As has the yield curve which hasn’t believed in this rally in months:


2017 has seen more central bank intervention on a global basis than ever. But this party is slowly coming to an end. And while central banks will still intervene in 2018 it will be at a reduced pace. The last time we’ve seen central banks intervene at a reduced pace? 2015. And it produced sizable selling in the summer of 2015 and at the beginning of 2016 forcing record intervention since then.


All global markets have proven is that they can perform splendidly with record intervention:


2018 will then be a test case how well markets can fare with less than record intervention, a new reality. Another new reality: Soon US markets will also have their answer in regards to tax cuts. All will be priced in one way or the other.


And, from the looks of it, someone has begun selling ahead of both of these emerging realities. And once the rest of the market takes notice we suspect Friday $VIX closes below 10 may suddenly become a thing of the past.