Showing posts with label Chart pattern. Show all posts

Friday, November 10, 2017

Sweet melt up potential here says Joe Friday


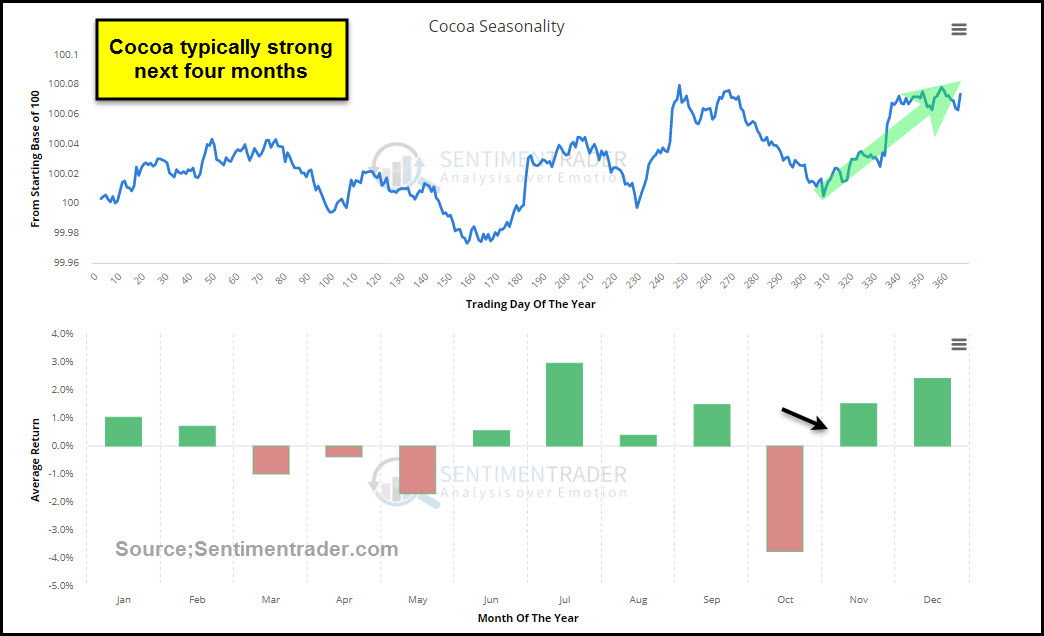
Tis the season for Chocolate (Cocoa) to do well, will it repeat its historical pattern again this year?


Below looks at the seasonal pattern of Cocoa from Sentimentrader


CLICK ON CHART TO ENLARGE


Going into this period of seasonal strength, Cocoa bulls of late are hard to find and dumb money traders have established one of the largest short positions in this commodity in years. The triple combo could make the price action of this commodity very interesting going forward.


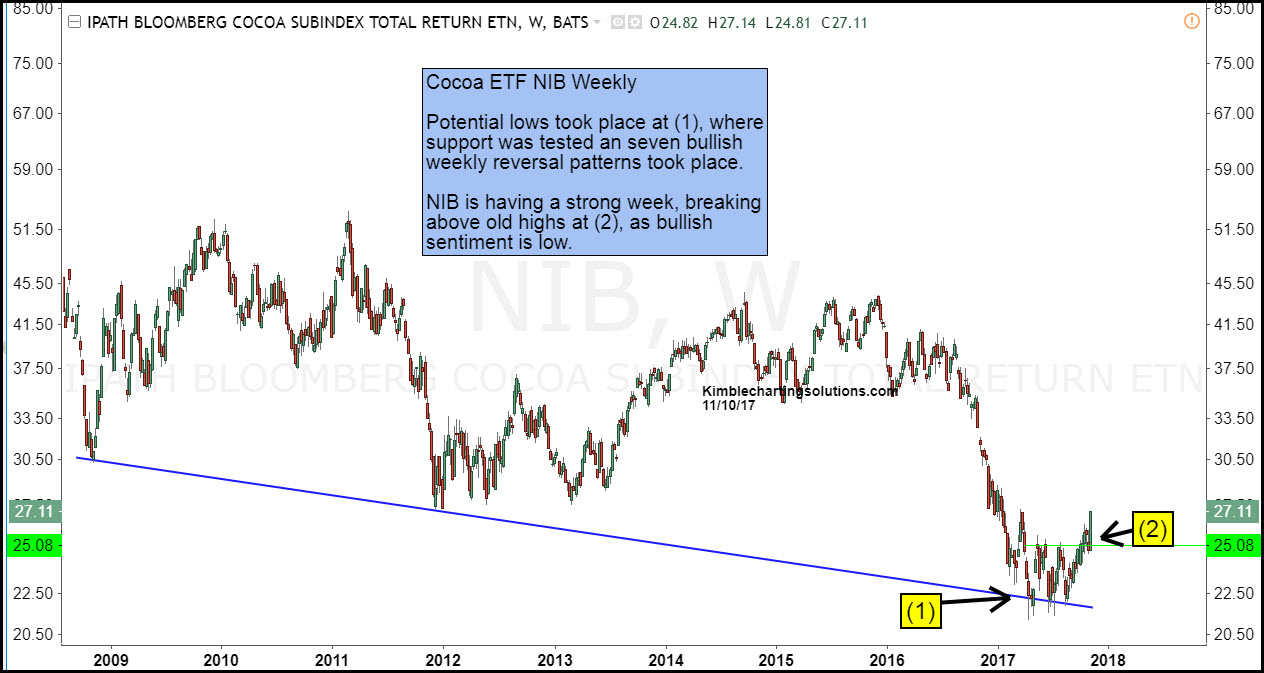
This commodity can be played in the futures markets or two different ETF’s (NIB & CHOC). Below looks at NIB


CLICK ON CHART TO ENLARGE


Cocoa ETF NIB could have built a base at, where seven different bullish wicks (reversal wicks) took place just above 10-year support at (1). Of late NIB has been moving higher and this week looks to be breaking above highs hit earlier this week at (2).


A nice combo of pattern, sentiment and traders positions is in play in this asset that is down nearly 50% in the past couple of years.


Some perspective- since the first of this month, NIB has gained over 7%, which is nearly half of what the S&P has done year-to-date.


Full disclosure Premium and Sector members have been long NIB since the end of October. If you would like to become aware of these type of pattern and sentiment setups, we would be honored if you were a member.


Why you see chart pattern analysis with brief commentary:   There is a ton of news and opinions about markets and stocks that make the decision-making process more difficult than it needs to be.   


I believe the Power of the chart Pattern provides all you need to see what is taking place in an asset and determine the action to take. 


This approach has worked well for me and our clients and I encourage you to test it for yourself.


Receive my free research posted on the blog daily here 


Or,  send an email if you would like to see sample research and take me up on a trial of my premium or weekly research where I provide actionable alerts on breakouts and reversals in broad market indices, sectors, commodities, the miners and select individual stocks 


Email services@kimblechartingsolutions.com  


Call us Toll free 877-721-7217 international 714-941-9381 


Website: KIMBLECHARTINGSOLUTIONS.COM 


follow on Twitter 


See our latest webinar


Wednesday, July 12, 2017

Double Breakout Here Would Be Good News For Bulls

block letters for kimble charting solutions post


Over the past several weeks, select cyclical sectors have started to perk up.  From Industrials to Transports to Financials to Materials, all have seen strength.


This is good news for investors, as this could signal a fresh leg higher for stocks. Today, I’d like to zoom in on the Financials (NYSEARCA:XLF) and Transports (NYSEARCA:IYT).


This post was originally written for See It Markets.com. To see rest of the post, CLICK HERE


IYT and XLF charts


This post was originally written for See It Markets.com. To see rest of the post, CLICK HERE


This information is coming to you from Kimble Charting Solutions. This is the home of the Power of the Pattern where we provide concise, timely and actionable chart pattern analysis and commentary so in very little time you know the pattern at hand and action to take.   We are honored by your interest in our chart pattern analysis.  


Send us an email if you would like to see sample reports or a trial period to test drive our Premium or Weekly Research


Website: KIMBLECHARTINGSOLUTIONS.COM


Questions: Email services@kimblechartingsolutions.com or call us toll free 877-721-7217 international 714-941-9381

Monday, July 10, 2017

This mining stock much stronger than GDX!

weight lifter for kimble charting solutions Miners post


The past year has been rough for Gold Mining stocks, as Gold Miner ETF (GDX) has declined over 30%, in the chart below. Below compared GDX to Freeport Mcmoran (FCX) over the past year, reflecting a large difference in performance.


fcx vs gdx miners for kimble charting solutions post


CLICK ON CHART TO ENLARGE


Over the past year, GDX has been a good asset to avoid from a buy and hold basis and our members have. The chart below looks at the FCX/GDX ratio over the past 5-years.


FCX/GDX ratio for kimble charting solutions post


CLICK ON CHART TO ENLARGE


Since the start of 2016, the ratio has created a series of higher lows. Rising support was hit of late and turned higher again. The ratio is now attempting a breakout above falling resistance at (1). This move higher continues to reflect that FCX is acting stronger than Gold Miners (GDX).


The Power of the Pattern likes the idea of owning Gold and Copper miners when prices suggest to do so. At this time Premium and Metals members like the pattern FCX is presenting at this time and are long FCX.


This information is coming to you from Kimble Charting Solutions. This is the home of the Power of the Pattern where we provide concise, timely and actionable chart pattern analysis and commentary so in very little time you know the pattern at hand and action to take.   We are honored by your interest in our chart pattern analysis.  


 Send us an email if you would like to see sample reports or a trial period to test drive our Premium or Weekly Research


Website: KIMBLECHARTINGSOLUTIONS.COM


Questions: Email services@kimblechartingsolutions.com or call us toll free 877-721-7217 international 714-941-9381

Thursday, July 6, 2017

Emerging Markets about to Submerge?


Emerging Markets (EEM) has done well this year, gaining over twice as much as the S&P 500 (17% -vs- 7%). These gains have Emerging markets facing resistance dating back to the highs in 2008 and a couple of other important resistance lines in the chart below.


Emerging markets monthly (EEM) kimble charting solutions


CLICK ON CHART TO ENLARGE 


Emerging markets have been a downside leader since 2008 and an upside leader since early 2016. EEM is testing triple resistance with momentum lofty.


If support would give way at (2), selling pressure could pick up speed, leaving room for Emerging markets to “submerge!” Important price point at (2) for this key market. The tight jam EEM finds itself at right now, could create a good deal of movement, when it resolves this narrowing pattern!


Bulls so much need EEM here to breakout to the upside!


This information is coming to you from Kimble Charting Solutions. This is the home of the Power of the Pattern where we provide concise, timely and actionable chart pattern analysis and commentary so in very little time you know the pattern at hand and action to take.   We are honored by your interest in our chart pattern analysis.  


 Send us an email if you would like to see sample reports or a trial period to test drive our Premium or Weekly Research


Website: KIMBLECHARTINGSOLUTIONS.COM


Questions: Email services@kimblechartingsolutions.com or call us toll free 877-721-7217 international 714-941-9381