Showing posts with label Hedge. Show all posts

Friday, December 8, 2017

Gold Hangs Above 2016 Low Despite BTC (Now in BitCon Futures), Brexit Deal,Tax Bill, and Fund Pukers


The only thing that truly trends is humans extrapolating their rates of return emotionally. Everything else will regress to the mean at some point.  


Investors are being given a gift and do not see it. Every rally in stocks should be used to lighten exposure to a crash  and every corresponding dip in gold should be bought from a balanced portfolio approach.  You should be peeling back equity exposure on every new high and adjusting your risk into something that is stable, holds buying power, and is liquid. That is the point of investing. Your home, your art, and your bitcoin will not fit those guidelines. Gold and silver do.


Do you think the millennials will be buying your 401k shares in 5 Years? Don’t be naive. No one went broke banking profits. And the Fed is handing you an opportunity retire with enough money now as they have moved the housing bubble back into the stock market. It took 10 years. Do you have another 10 years to wait if we crap out again? Protect your profits now. 


Admittedly the title sounds like a Gold Bull rationalizing a losing position, as so many gold salesmen do, and we are long and are not selling you Gold. We are also swing trading from the short side. So it is what it is.


It"s jobs day and noone really thnks that matters to Fed policy anymore,  Brexit breakthrough agreed, and shutdown avoided for now. A couple points before getting to the reason for our title. Let’s first count the ways in which Gold has had to deal with bad news these past 2 months. 


Counting the Ways Gold is Bashed


Fund liquidation, Trump Tax Bill, Bitcoin, Brexit deal, Venezuela default (bearish for gold as they had to sell), and the usual short side players with deeper Fed sponsored  pockets than the longs woth which they do battle. These are a few of Gold’s obstacles these past couple months. And yet here we are $100 above last years lows. 


Kicking Gold Today’s Edition


The Brexit deal and Govt shutdown avoidance alluded to above, along with the end of year puke-age and Trump’s Tax Bill (as we have written about here extensively) have all been major negatives for Gold the past few weeks. And yet gold sells off (again) before the news comes out.. strange... 


To be fair, we are seeing more longs with end of year hopes dashed selling these last couple days. There are some shorts getting in now however. Just not enough to spur  a sustainable  a rally we think. 


Banks and The Fed in Bed Again And Gold Suffers for It


Post 2008 banks have been on the outs with The Fed as risk managers. The Fed had mandated more risk be cleared through exchanges. And they have succeeded somewhat.


In doing so, the border collies that run our monetary system have herded much derivative risk into a larger basket. TBTF became Bigger and more centralized (like Fannie Mae..).Their reason is this basket is more easily watched, and since they regulate exchanges, can be “advised” on policy.


But along comes an existential threat not just to global fiat backed governments, but to the US Banks that are their overlords. And boom! They have a common enemy. And that Enemy is Bitcoin.


Gold is suffering real collateral damage now as the banks pitch their new wonderful product to replace gold.. and it’s having an effect. 


BTC Futures: Regulation and Repression to Follow


Note the complete banking industry turnabout to hailing BTC as the new gold on the coincidental heels of new futures contracts approved by the CFTC. Banks and brokers have a new product to sell you folks, and they are actually calling it a store of value, a new gold, if you will. This is in complete contrast not just to BTC behavior (volatile and a wealth generating currency, but don’t call it money yet), but to gold itself (low volatility, wealth preserver, money but not currency)  Line up suckers for a new product to be castrated, regulated, and repressed by banks through exchanges with government blessing and oversight. People not long  Bitcoins will be buying futures on margin while banks long BTC  will be hedging and killing their much shallower pocketed but greedy clients. Let the fleecing begin in the NEW GOLD.  JPM Calls BTC “New Gold”; Spoofing Starts Monday


Love Michael, Hate it When he’s Right


Michael Moor has been spot-on in handicapping market moves given price triggers. Read UPDATE: “Bear Trend with a $1700 Target” Has Problems for more. He saw for different reasons than us, a large bull move fermenting last month. He gave a level where that was negated. That level was breached. Now,to our chagrin, he’s called this sell-off from the $1272 area very nicely. In the process, he stopped us from buying dips for now. But we wish he’d see the end.. for our sake! 


UPDATING OUR LEVELS


1-Our macro trade system says we should be out If the market is here come December 31.


2-The VBS indicator has yet to be triggered for a longer term volatility expansion. So according to that indicator we are still in a trading range, hard as that is to feel when you are long as we are. 


Point being; Nothing has Changed


We made the observation that funds like to get in above the 12 month MA for punts. They did and they are now puking. We have a long position based on this and are swing trading around it. 


We secondly stated that volatility would be expanding in 90 days. We are 45 into that and things are starting to percolate. We did say November would be one to remember. So that was a bit premature.


We believed a $50 move one way was coming which would cause  a spike in volatility and a follow up move anywhere between $50 and $200.


All of this is in play and lining up from our original statements to today’s activity.


The only thing you have to ask yourself is will you be in a position to buy gold if it drops another $50 and then another $100 from there. Because that is what gold is for. It is to be bought when it gets cheaper. We will be buying to hold for 12-18 months at least as we roll equity profits into wealth preservation vehicles. We will also be trading it from both sides of the table. But this is what we do professionally. 


You should be peeling back equity exposure on every new high and adjusting risk into something that is stable, holds buying power, and is liquid. Your home, your art, and your bitcoin will not fit those guidelines. Gold and silver do.


On combination, Michael says we may have another $30 or so of downside coming. This would trigger the VBS indicating a $50-$200 move relatively quickly in one or the other direction. 


Which brings us back to our original post a month ago declaring volatility is soon to expand in about 90 days. We also stated then a $50 move in either direction will yield another $200 in continuation or reversal of that first move. 


VBS Trading Algo Levels for Gold Oct 25th


Notes From a call today on potential gold trades.


  1. It looks like we will be seeing a move of $50 to $75 in either direction in the next 90 days. 

  2. That move could be slow and orderly, or fits and starts, that is not handicappable  or important to the system

  3. If a move like above occurs, then we will most definitely get a signal to be long Vol. on a risk reward basis as the monthly indicator will expand

  4.  Directionally, our first play would be to go with the direction at time of the trigger. Our second would be to stop and reverse at a predetermined level.

  5. this is a longer term play than usual for the VBAS so we will most likely express the position traditional way via long straddles. 

  6. Direction would then be expressed by NOT hedging gamma on daily break evens but more like every 2 weeks, and then only half of accumulated deltas. In this way we would remain long/ short in direction of the trend.

Monthly:


  1. Buy straddles or hedged call spreads on a monthly settlement above 1305 or below 1191 [Edit- now $1338 and $1192 per chart below]

  2. early entry- put on 1/2 position on a day signal as described above.

  3. exit everything on 3 bars if not profitable. 

  4. Gamma hedging TBD.


Monthly chart updated today. Gold has dropped approximately $35 thus far from that call. A $75 drop from Oct 25th"s level would be in shouting distance of $1192 and likely trigger the indicator of even higher volatility.


The plan is: Gold drops $50 from that post date, triggering the VBS for expanding volatility. 


At that point one either goes with the trend, or waits for a quick exhaustive selloff and reversal for a major rally. In simple terms: of Gold trades $1192, it will not sir there long. We will sell if it hits there, initiating a short. But that is only to keep our finger on the pulse. Having a position in a market heightens your radar and forces you to respect your discipline. Doing so will tell us if being short is wrong. This will in turn mean being long is right. And we will reverse hard. 


So, here’s to a market dump to $1193 and what could be the beginning of a new run higher. Yes, VBS also implies lower is equally possible from $1193, but given the seasonal nature of Gold and it’s tendency to make lows at end of the year as funds sell, we’re optimistic that the buy low and sell high rule of investment will replace our current swing trading behavior of selling weakness and buying it lower. This as we described all part of trading around a core long position. We’d love to start swing- trading from the long side with a core long position. Stay tuned.


Previously:


About the author:Vince Lanci has 27 years’ experience trading Commodity Derivatives. Retired from active trading in 2008 after netting $90MM in an Energy arbitrage strategy he devised for a NY hedge fund; Vince now manages personal investments through his Echobay entity and advises natural resource firms on market risk. Over the years, his expertise and testimony have been requested in energy, precious metals, and derivative fraud cases. Lanci is known for his passion in identifying unfairness in market structure and uneven playing fields going back to his first anonymous Zerohedge post on Silver. He remains a contributor to Kitco, Zerohedge, and Marketslant on such topics. Vince contributes to Bloomberg and Reuters finance articles as well. He continues to lead the Soren K. Group of writers on Marketslant. 


Bloomberg reports:


Progress


An early-morning breakthrough on Brexit first-round negotiations takes the process toward the next stage of forging the U.K.’s post-exit relationship with the European Union. The thorny issue of the Irish border was effectively parked while outline agreements on citizen rights and the divorce bill were achieved.  Leading Brexit campaigner Nigel Farage labeled the deal a “humiliation.” Gilts dropped and the pound remained relatively unchanged in the wake of the deal. 


Bank rally


Shares in European lenders are soaring this morning, with the Stoxx 600 Banks Index climbing as much as 3 percent, after Basel III capital rules will see “no significant increase” in provisioning for the institutions. The final batch of post-crisis regulations announced yesterday will see requirements decline for some large banks. The agreement and culmination of intense lobbying removes a regulatory risk which had been hanging over the sector for almost a decade. 


Markets rise


Overnight, the MSCI Asia Pacific Index added 0.6 percent, while Japan’s Topix index closed 1 percent higher following data showing the country’s economy expanded faster than expected. In Europe, the surge in bank shares is lifting the Stoxx 600 Index, which was trading 0.9 percent higher at 5:45 a.m. S&P 500 futures added 0.3 percent, the 10-year Treasury yield was at 2.389 percent and gold continued its recent slide. 


Shutdown


Congress sent President Donald Trump a bill extending federal funding for government spending to Dec. 22, avoiding a shutdown which was scheduled to begin today. Lawmakers, who already have a busy schedule coming into the year end, will seek to resolve issues on spending limits in the next couple of weeks which would allow for agreement on a longer-term budget.


Sunday, November 26, 2017

Muir: "People Are Going To Be Wiped Out" By Short-VIX ETFs

Back in August, we highlighted a story in the New York Times about a former manager at Target who decided to try day trading with $500,000 he had saved up. Over the following years, he turned that into $13 million by following one simple strategy: Shorting volatility every time it spiked.


As MacroVoices host Erik Townsend points out, that strategy has worked for many retail investors over the past eight years. And in a brief “postgame” interview with the Macro Tourist Kevin Muir following a longer interview with Francesco Filia, a fund manager at Fasanara Capital, the former explains how many investors don’t understand the risks associated with shorting volatility, as well as the possible repercussions if exchanges and brokerages don’t take the appropriate steps to limit this.


Townsend begins the discussion by asking Muir about a chart he created of the VXX - the long-VIX ETF - which, because of the low-volatility environement, has repeatedly split leading to unbelievable wealth destruction.


Going back to 2009, the price of the ETF has gone from $120,000 a share to just $35. And while a sudden spike in volatility could see it surge, with so many investors on the other side of the trade, it"s worth considering what might happen if they couldn"t pay.


It’s frightening. And I don’t think enough people are – well, there are some – but I don’t think that enough people are really considering all these things. And I think that guys like the Interactive Broker chairman, that are taking proactive steps to make sure that there’s enough margin, we need to see more of that. We need to see more people saying, hey, wait, this is actually a very, very scary instrument that has a lot of risk in it.


I watched a Real Vision interview with John Hempton from Bronte Capital, and he talked about phoning up the infamous Target salesman guy, the fellow that quit his job as a Target manager to trade XIV and all the VXX products, and he turned his 1/2 a million bucks into 13 million bucks. The part that really scared me about it was that John phoned him up and he was expecting to talk to this very sophisticated guy, and his basic takeaway was that, although he had a lot of buzzwords, and he understood kind of what the products represented, he didn’t really understand his true risk.


And I think that there’s just a myriad of people out there that are trading these things that don’t understand that. The more people that wake up and realize this, and stop playing this game, the better off we’ll be, actually.


Brokerages have caught on to this, Muir says. Interactive Brokers, one of the largest online brokerages, is now asking retail investors to post between 300%-400% margin when they short certain VIX contracts – because brokerages recognize that one sharp drawdown in the S&P 500 could blow millions of short traders out of their positions, potentially leaving thousands of customers with massive negative balances that could threaten the brokerages’ existence.


Erik, you’re absolutely correct. And Interactive Brokers, one of the largest electronic brokers out there, realizes the risk. If you look at the way that they’re margining these products, they’re margining them completely different than what the exchanges and everyone else say is the proper amount.


So if you look at the VIX futures, the front month is $6,200 – the exchange minimum is $6,200 – which works out to roughly 50% of a contract. The next month is $4,000, which works out to 30% of a contract. And the far months are $2,500, which works out to 17% of a contract.


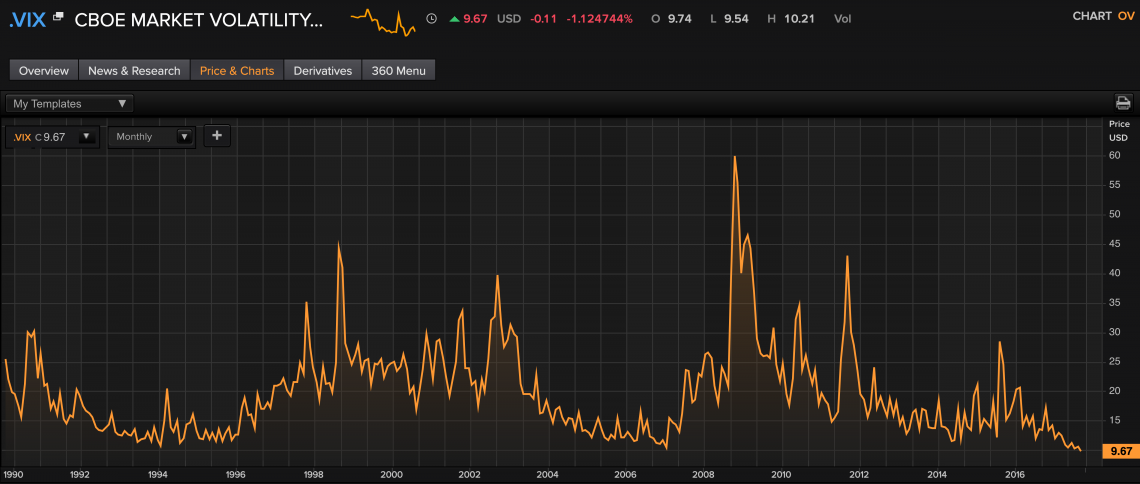
But if you go to Interactive Brokers and you want to sell this VIX contract short, you have to put up 300%–400% of the contract. Because they’ve looked at it and they’ve realized that if the S&P has a 10% down move, which isn’t out of the realm of possibility, that the VIX could spike up to 37 really easily. And people are going to be wiped out if that happens.


Should the VIX suddenly spike, the repercussions of such a move would be further complicated by the billions of dollars sitting in various VIX-linked ETFs. Because individuals sellers would probably disappear from the market in such a situation, the ETF market makers would find it nearly impossible to hedge their positions, potentially triggering the dissolution of the funds, or even the collapse of some of these firms.


There’s $1.2 billion of the XIV, which is the short ETF. There’s $1.3 billion of the SVXY, which is another short one. These are staggering numbers.


In my days, when I was on the institutional desk, we had this big – I did index arbitrage, and we used to go out and buy the baskets and sell the futures. One day the risk manager came to me and said, if you had to take this position off (because we had accumulated this big position) how long would it take you? And who would do it?


And I said, the reality is that there’s nobody. You know, we were the biggest player in the market and there was nobody that was going to take this off of us. The only way was to go all the way to expiry.


Well, the reality is that these numbers are way bigger than any market player can absorb. And, if we get a situation where – as Francesco says, all it’s going to take is a return of the VIX from its current level of 10 to its average level of 18 or 19 to wipe out these products.


I guess that’s the point that I want to make: If you’re actually owning these things, you should be aware that all it will take is a move of 80% and then they’re going to wind down these products. So the XIV, when it moves up, if all of a sudden VIX goes from 10 to 18 in a day, they’re going to wind down that product.


And what’s going to be really scary is the amount of VIX futures that is going to have to be bought, because they’re short all those VIX futures and they’re going to have to buy them back.


And I just don’t know who’s going to sell it to them. For the first time – for a long time, I didn’t view this VIX as that big a deal, and there were some smart guys like Jesse Felder that were going on about it – I just think that it has been taken to a level that is becoming increasingly worrisome. And it actually could create a market dislocation in itself.


And what is it Warren Buffett says? What the wise man does in the beginning the fool does in the end. Well, VIX, at this point, we’re hitting a point where if you’re actually continuing to bet on it you’re going to be in the fool category.


Because it’s not going to take much to have a big spike that wipes a lot of people out. And it’s actually very, very worrisome.


Of course, it would take a large intraday move to trigger a truly catastrophic spike in the VIX. But at least one analyst, Bank of America’s Michael Hartnett – whose work we have cited here – believes there could be a 1987-style crash in the early months of 2018. Hartnett’s reasoning? The bearish positioning seen at the beginning of 2017 has completely flipped. Investors’ long positions are larger than they’ve been in years.


And as we’ve repeatedly pointed out, with volatility and volume so subdued, hedge funds have remained overwhelmingly short vol, fearful of missing out on even one tick of the torrid rally for fear of pissing off their clients.


One things for certain: Given the market’s already dramatically overextended rally, the day of reckoning is coming. The only question is will it be a steady decline, or will it happen suddenly?


Given the incredibly stretched nature of positioning, the latter scenario, Muir and Co. believe, seems far more likely.


* * *


Muir"s discussion begins just after the hour mark:


Saturday, November 25, 2017

"This Is A Paralyzed Market": Hedge Fund Turnover Drops To All Time Low

Back in July, Canaccord analyst Brian Reynolds put out a contrarian piece which broke with numerous conventional wisdom norms about the state of the market, key among which was that traders are not complacent, but rather - in light of collapsing trading volumes, something which has plagued bank income statements in the past 2 quarters - simply paralyzed, as they no longer have a grasp of financial "logic" when it is all superceded by central bank liquidity injections, and as such most trades feel fake, forced and just part of the FOMO charade to avoid losing one"s job.


As Reynolds explained, "Investors are not complacent. Their stances range from extremely aggressive to bearish" and added that these "opposing forces have led to a compression of volatility. When stocks have rallied strongly, they have then been met with investor selling. When stocks sell off, the buybacks have picked up after the selling runs its course. That has been the case for more than eight years. Those forces have led to an equity bull market that moves higher in fits and starts, with some brief pullbacks from time to time. Given the positioning of equity investors and continued flows into credit, we do not see that pattern changing for some time." Meanwhile, sandwiched inbetween these two trends, investors - both retail and institutional - find themselves in trade limbo, and the outcome is a gradual decline in trading volumes "which is more reflective of paralysis than complacency among equity investors."


And while one can posit theories explaining this bizarre market until one is blue in the face, the most vivid confirmation of Reyonld"s "paralysis" thesis emerged in the latest batch of hedge fund 13Fs, which was analyzed by Goldman earlier this week, and noted here in "These Are The Top 50 Hedge Fund Long And Short Positions."


In the report, Goldman highlighted various notable outliers, such as the latest record high in hedge fund leverage...


... coupled with the recent plunge in short interest (which as a share of S&P 500 market cap sits just below 2.0%, matching January of this year as the lowest level since 2012)...


... even as hedge fund "crowding" in a handful of top names hits an all time high:


But the most interesting to us, and the hedge fund community, we believe is the following chart, which shows that hedge fund portfolio turnover continued its downward trend and reached a new record low in the third quarter Across all portfolio positions, turnover registered 26% in 3Q. Turnover of the largest quartile of positions, which make up the vast majority of fund portfolios, fell to just 13%.


This means that once hedge funds have established positions, they no longer trade in and out, but simply lean back and let it ride. And why not: with the most popular hedge fund positions this year being also the best performing ones, namely Facebook, Amazon, Alibaba, Alphabet and Microsoft, why ever both selling.  Indeed, as the next chart shows, the bulk of the collapsing turnover is largely due to tech stocks:


Of course, this strategy of loading up on winner and letting them ride is a two-edged sword. while it is the best strategy on the way up, it also becomes a quasi private equity strategy, in which the price formation is created on the margin with increasingly less volume. And, since such tech holdings are becoming ever more illiquid, the threat is what happens once the narrative shifts and instead of buying, hedge funds start to sell these most concentrated of growth names. One could say that a tech selloff is emerging as one of the more concerning black - or at least gray - swans in the market. In fact, we are did say just that...


Friday, November 17, 2017

As Oil Heads For Down-Week, Crude Stakes Are Huge

After five straight weeks higher - read by many as confirmation of how awesome the global coordinated recovery must be - WTI and Brent dropped this week as inventories rose, demand outlooks dimmed, and OPEC hope faded.


As Alhambra Investment Partners" Jeffrey Snider notes, there is a titanic struggle going on right now in the oil market.


On the one side of the futures market are the usual pace setters, the money managers. Last week, the latest COT data available, they went the most net long since March. If it continues, it will close in on the most positive futures position since the record long they established back in February.


Normally that would be insanely bullish for oil prices. But just as in February/March another part of the futures market has intervened on the other side. Back then it was the oil producers who rising inventory forced into a larger and larger offsetting net short (hedge).


This time, however, it is the swap dealers who are short for reasons that aren’t really clear. The weekly COT report for the last week in October showed a record net short for dealers, just beating their most extreme position from the middle of 2013 at -424k contracts. In the first week and November, they blew away that record at -470k.


It clearly matters because in 2017 the oil market has changed. It may be the inventory story, or it may be the exit of producers from hedging that inventory and other products. Whatever the case, money managers just aren’t setting the price like they used to. And it could be that managers have changed their market activities, too, where other parts of the futures market are now cueing off (shorting) this possible difference. I honestly don’t know what it is, but I can safely point out where it is.


Now with swap dealers apparently showing very, very strong conviction on the short side, oil prices can’t gain any traction beyond the $57 established by in all likelihood geopolitical risk.


The fundamentals of oil continue to favor the dealers over the managers, with oil inventories remaining at the same crisis “rising dollar” levels. Being slightly better than 2016 is not a real achievement toward clearing the leftover physical imbalance, not when oil inventories are instead still consistent with late 2014. With 2017 nearly over, there should have been much more progress toward 2013 levels of stock long before now if there was ever going to be a realistic chance to balance the oil market next year (at the most optimistic).


Instead, it indicates yet again a demand problem, as in lack of materializing upside demand due to, as always, economic constraints that in the mainstream aren’t ever considered real (like when the oil crash was called repeatedly a “supply glut”). Pushing the expected rebalancing date into 2019 or even (more realistically) 2020 creates greater downside not upside risks.


That may be why dealers have jumped all over the shorts; if it is geopolitical risks driving oil prices higher, and maybe what managers are betting on now, then if or when they fade the negative fundamentals of oil will be re-imposed on the price. That seems to be what the futures curve is saying, too.


Backwardation indicates expected balance, but at a very low price rather than a rebounding one. In the latest oil pullback since last week, the curve has moved lower in unison, with the same almost identical indicated backwardation rather than toward any serious rewind toward contango.


One additional factor to consider is those record and near-record opposite futures positions. What happens if the oil price starts to move in either direction? There may need to be a whole lot of covering by whichever side ends up on the losing end, perhaps turbocharging the price as it begins to move whatever way it decides to go.


There is right now a lot at stake in the crude market, and it’s not just about oil.


Wednesday, November 15, 2017

Massive Hedge Fund CEO "Ready To Add Bitcoin To Investment Universe"

Just yesterday we noted that billionaire hedge fund legend Mike Novogratz said "the institutionalization of [the crypto space] is coming... and it"s coming quick."


Novogratz said he expects major financial firms will soon start to offer bitcoin or similar products as an investment option, one that could be easily purchased over the phone.


“When it’s that easy, the price of bitcoin or ethereum is going to go much higher. And that is a lot closer than people think,”


How right he was as the CEO of massive hedge fund Man Group just confirmed they will "add bitcoin to its investment universe" once CME launches Bitcoin futures.


As BI reports, one of the largest hedge funds in the world might hop on the bitcoin trade.


Luke Ellis, the CEO of Man Group, the UK-based investor with $95 billion in funds under management, said the firm would include bitcoin in its "investment universe" if bitcoin futures successfully launch, according to a tweet by Reuters.


CME announced at the end of October that it would launch a bitcoin futures product by year-end.


On Monday, CME chairman and CEO Terry Duffy said such a product would likely be ready by the second-week of December.


Additionally, as CoinTelegraph reports, earlier today on Nov. 14, Multicoin Capital Managing Partner Kyle Samani revealed that he had met with an institutional investor with a $30 bln fund. The investor disclosed the fact that fund managers within the company are restricted to issuing checks with the minimum value or $300 mln.


“More. Just met with an institutional manager. $30 bln fund. Minimum check size $300 mln. Current crypto allocation: $0. We aren"t even close to the top,” said Samani.


Previously, even up until early 2017, it was not possible for institutional investors to allocate hundreds of millions of dollars in Bitcoin because the market was premature and the liquidity was limited.


In January of 2017, the market cap of Bitcoin was only $15 bln. The market was simply not deep and mature enough for institutional investors and large-scale hedge funds to commit.


In the past 10 months, the market valuation of Bitcoin has grown to $110 bln, with a daily trading volume of $4 bln. As such, Bitcoin has become more liquid than the most liquid stock on earth, Apple.


Finally, we note that Novogratz"s biggest regret this year has been not buying more cryptocurrencies when prices fell, because he knew that they would keep going up. He sees bitcoin, for instance, hitting $10,000 by March.


The basis of the price target of Novogratz was established by several indicators including the Metcalfe’s law, a widely acknowledged metric which has been utilized to measure the growth rate of communication networks like Facebook, and the likelihood of the entrance of institutional investors and retail traders into the cryptocurrency market.


Sunday, November 12, 2017

Deutsche: Every Time We Asked "How Much Lower Could Vol Go” Things Would Become Unpleasant

According to Deutsche Bank"s Aleksandar Kocic, we live in a reflexive world, one where "the Fed knows that the market knows and the market knows that the Fed knows that the market knows, so everyone knows, but pretends that nobody knows and the game goes on." That pretty much covers much of modern market analysis which, like some mutant version of the Heisenberg Uncertainty Principle, implies that it is impossible to know the value of assets without also taking into account what the Fed thinks about said value, and what it will do in response to the valuation manifesting itself in the form or asset prices.


There"s more to it.


Following up on last week"s note, in which the DB derivatives analyst looked at the market"s current "metastable" state from the perspective of Minsky dynamics - a series of constantly shifting disequilibria which vary in leverage and volatility (the lower the vol, the higher the leverage until the system tips over and is forced to reset)...


... to analyze what may be the exogenous "circuit breaker" that finally snaps the fake calm of the past 9 years of central planning, overnight Kocic put it all together in his latest report which converges on most of the tropes he has been discussing over the past year, including the build up of negative convexity by way of continued state of exception, misallocation of capital, buildup of tail risk, and metastablity, and explains why markets are caught in a "Sachzwang – a factual constraint residing in the nature of things that leaves no choice but to perpetuate the existing conditions."


For those unfamiliar with Kocic"s latest metaphysical allegory for capital markets - which would be everyone - this is how he explains it. As usual, a PhD in philosophy is recommended, and increasingly, required.


Continued pressure on vol is shaping to become the signature mode of this year. Its decline from its post-elections high at 95bp (in terms of 3M10Y) to its near all-time lows of 55bp in less than 12 months has been a function of general distribution of risks and persistent supply of convexity through complacency, transparency, liquidity, and predictable monetary policy. Politics no longer matters -- increasing negative newsflow has created political bottlenecks which have eroded the ability to produce consensus resulting in a noisy status quo. Yield enhancement strategies seems to be everywhere. Credit spreads have compressed to their post-2008 lows while risk premia and volatilities have collapsed across the board.


At the same time, this state of affairs is causing a buildup of negative convexity out-of-money by way of continued state of exception, misallocation of capital, buildup of tail risk, and metastablity. The market is vulnerable to bear steepening of the curve with Fed massively negatively convex to inflation risk. One would expect that vol would find support in the face of these risks. However, there does not seem to be any meaningful signs of resistance levels at this point. Investors are aware of the underlying risks, but are implicitly forced to ignore them in order to survive the short-term demand for return.


Unlike the chess "zugzwang", in which the player is forced to make a move, making their position significantly weaker, and would thus rather not move at all, in the Kocic world, the equilibrium market state is a suffocating paralysis under which the only option is making no move at all, thereby perpetuating the paralysis. The final outcome - as we are confident the metaphysical analyst will eventually unveil - is Cosmic Death... a state of 0 Kelvin in which central planning crushes one"s will to exist, let alone trade, or some other similarly dramatic philosophical narrative.


Markets are caught in a Sachzwang – a factual constraint residing in the nature of things that leaves no choice but to perpetuate the existing conditions.


Short-dated volatility continues to probe new lows in tune with other  measures of risk premia. There has been hardly any departure from the trend. As gamma collapsed, vol sellers have been moving along the surface and ironing out the calendars. This is causing collapse of horizons and general paralysis which further perpetuates status quo. Time is gradually coming to a stop – this is the real collateral damage of the existing dynamics.


Perhaps he is right: instead of a "VIX supernova", maybe the fate of the market is a singularity of ever-shrinking volatility and trading and infinite boredom, one in which everyone withers away as neither newsflow nor decisions matter. If so, it would certainly explain the next part: angry clients who know the final outcome, yet are reluctant to concede that they have become irrelevant pawns in a game which is no longer winnable.


These ominous vol lows are triggering unpleasant memories of the past episodes of complacency and their aftermaths. Every time we asked the question: “How much lower could vol go”, things would become unpleasant.


And yet, as the saying goes, maybe this time it is different, at least for rates traders. Here - according to Kocic - is why and how it is different.


To be blunt, when it comes to future rates volatility, there is very little to be learned from its history at this point. Most of the past market mechanisms, and by that we mean pre-2007, are no longer in place. Mortgage negative convexity is no longer transmitted from home owners to capital markets. Monetary policy shocks used to arrive from the front end of the curve, and active convexity hedging, and with it, bid for vol, went hand in hand with carry, steeper curve, and generally higher risk premia. In contrast, post-2008, the MBS convexity hedging has practically disappeared – while housing market continues to expand, hardly any of its negative convexity is being transmitted to the capital markets. Monetary policy seems to be largely administered through the back end of the curve – more stimulus during QE meantflatter curve, less carry, but also potentially higher volatility. Management of stimulus unwind has now become a major source of convexity supply -- Fed’s communication with the markets has been the key reason for compression of risk premia. On top of that, financial conditions have been as loose as ever. Tight fiscal policy, stricter regulations and positive supply oil shocks, together with global QE, have compressed long rates to the point that remaining playground for the Fed has been reduced to a mere 50-60bp range. On this restricted landscape, nothing is super exciting anymore. The Fed’s main concern is how to get unstuck without getting unglued.


To be sure that concern will become a trigger for wholesale market panic if the Fed raises rates by another 50-60bps while long rates fail to budge in parallel. In fact, it will be especially ironic if it is the Fed"s rate hikes that unleash the yield curve inversion and thus, the next recession, something another DB analyst - Dominic Konstam - suggested would happen two months ago. And speaking of vol regime variances, Kocic also explains what he perceives to be the biggest disconnect between past and present vol regimes.


Lots has changed relative to pre-2008. Vol is still a carry game, but the market is effectively less negatively convex then before. Monetary policy now dampens volatility instead of generating it, and economic volatility is lower. During the  period of active convexity hedging, carry was an opportunity to buy vol – existence of carry allowed mortgage hedgers to spend some of that carry to hedge their convexity exposure. That supported an extra    premium for rates volatility, on top of general uncertainty reflected by other markets. The Figure shows a history of 3M10Y rates gamma overlaid with the FX vol index (CVIX). We note the spread between the two in the first half of the first decade. With disappearance of convexity transmission mechanisms, carry is now seen as signal to sell vol.


Having establishing the disconnect between present and the past volatility regimes, how does Deutsche Bank see its future? Before answering that, Kocic revists the Minsky Dynamics aspect of historical crisis formation he discussed last week:


In our view, interplay between volatility and leverage is the framework that gives the most straightforward tool for understanding the future path of volatility. We have discussed this relationship in our recent publication. Here, we extend this interaction to a broader context of buildup of leverage and management of subsequent crises across multiple cycles. To recap, we argued that there is a logical relationship between leverage and volatility. Low uncertainty engenders higher leverage which in turn leads to additional compression of risk premia and a buildup of risks. Ultimately the system becomes unstable and results in a crisis, which in turn forces the system to deleverage in a highly volatile manner. In a way, continued prosperity and stability in itself is destabilizing leading to riskier lending as the asset prices of collateral decline. This is the essence of Minsky"s take on financial markets.


However, what is most interesting for Kocic, is the question of "what comes after each crisis, namely how is the recovery engineered and economy brought back on track." His answer:


To be specific, let’s choose as the starting oint 1999, the beginning of the internet bubble and follow (in the clockwise direction) the subsequent economic trajectory in the vol-leverage plane in the Figure. As the economy is heating up, volatility declines and leverage increases until the bubble bursts sometime in the late 2000. There is a volatile deleveraging for the next 2-3 years when low rates and expansion of the real estate market created conditions for the turnaround and beginning of another cycle. The only difference is that, this time around, the bubble was bigger and the limits were more extreme. Instead of being a periodic object (e.g. ellipse), the trajectory now becomes an outward spiral – in the second sweep, the leverage is higher and risk premia compression more extreme leading, naturally, to a deeper crisis and a need for an even more extreme measures of recovery.


Of course, one could (far simply) say that it takes more and more debt to kick the can, and keep the world"s biggest asset bubble ever created - the explicit backing of central banks - inflated. This is precisely what Bank of America"s Barnaby Martin did in far less words yesterday:


 "the irony in today"s world is that central banks are maintaining loose monetary policies to generate inflation…in order to ease the pain of a debt "supercycle"…that itself was partly a result of too easy (and predictable) monetary policies in prior times."


Alas, sounding philosophical has emerged as a calling card for quite a few financial pundits, as saying the same thing over and over (for 9 years) has lost much if not all impact and has to be spiced up in any possible way. Like, for example, using Finnegans" Wake or Ulysses as one"s stylesheet.  In any case, when charted, Kocic"s argument looks as follows:


Where Kocic is concise, and accurate, is in what he says next, namely that "spiraling leverage cannot continue indefinitely. At some point, the bubble becomes too big and cannot be subsumed by a bigger bubble – the damage of its burst would become irreparable. Therefore, when that moment comes -- and we believe that moment is now – the market is facing a following dilemma."


  • Permanent state of exception: We continue to operate in a regulated environment. Leverage is limited, but care is taken not to overconfine the system so we avoid the Japanese scenario. While this appears as a prudent approach to reality, it implies giving up all the ideas of unlimited growth, something that made US economy look better than the rest of the world. Compared to what we have seen before, this means settling for much less than this country is used to aspiring. Although a reasonable proposition, it is emotionally a difficult choice that is and will remain subject to substantial political manipulation. It is unlikely that populist narrative will not continue to challenge this choice [ZH: hey, one can just blame the Russians, right?]

  • Flirting with high tail risk : Deregulation and deficit spending could result exactly due to abandoning the first path, as its direct challenge, under political pressure that American economy can restore its old status and resume its pace of the previous decades. This is a serious tail risk as it is playing against the backdrop of considerable overhang of the post-2008 one-side positioning. Central banks are massively short convexity in this scenario. Any inflationary maneuver, or anything that would be a bear steepener of the curve, could force disorderly unwind of the bond trade and reinforce the trend thus creating another crisis from which there could be no way out.

  • Forced deleveraging: An overly hawkish Fed forces rates higher and triggers a disorderly unwind of the bond trade, thus forcing the system to deleverage. This is the policy mistake.

Deutsche Bank"s conclusion:


"The tension created by these three choices is in the center of both economic and political discourse. It will shape the market dynamics in the future, beyond the near term. Taper tantrum and the US presidential elections were the two most recent episodes that have highlighted the risk distribution opened by these choices. Policy mistake appears less likely at this point. The financial conditions are as loose as they have ever been. Fed hikes are only going to tone this down, but it is very difficult to see how they can create overly tight financial conditions and cause economic slowdown. Nevertheless, negative convexity of the central banks in the bear steepening or generally high rates scenarios are making risk of volatile deleveraging alive."


Ironically, it was yesterday"s sharp bear steepening that was largely cheered by markets:


If they only knew.


Monday, October 23, 2017

USDJPY Inches Higher As Japanese Stocks Set For Longest Winning Streak In History

Yen is weaker and Japanese equity futures notably higher following a landslide election victory for Japan Prime Minister Shinzo Abe which theoretically ushers in yet more easy monetary policy. USDJPY has jumped above 114.00 in early trading, sending NKY futures up almost 1% in the pre-market.


If this equity rise holds it will mark the 15th consecutive gain for the Japanese market - breaking the 1961 record of 14 straight days to become the longest winning streak in Japanese stock market history.


Nikkei 225 is at its highest since Dec 1996.


Meanwhile, much has been made recently of the decoupling between USDJPY and the Nikkei 225


However, this chart masks a closer relationship between USDJPY and the relative performance of Japanese and US equities.


So there really is no regime shift.


What are the drivers of this persistent negative correlation between the yen and Japanese equities and which flows supported this negative correlation this year?


On Friday, JPMorgan presented three fundamental explanations to justify the link between Japanese equities and the yen.


One typical explanation is that the yen, being a major funding currency for the world, should rise in a risk-off equity environment and vice versa. But this argument is not supported by the fact that there is much lower correlation between the yen and global equities. It is also not supported by the structural break in the correlation between Japanese equities and the yen shown in the chart above. The yen was the most prominent or sole funding currency before the financial crisisof 2007/08. After the financial crisis the yen was joined by the dollar and later by the euro as funding currencies. So if anything the negative correlation between equities and the yen should have been even more negative before the financial crisis. But the opposite happened. The negative correlation only intensified after the financial crisis.


A second explanation, with causality running from yen to Japanese equities, is that a weaker yen has a positive impact on corporate profits inducing equity investors to buyJapanese equities and vice versa.


A third explanation is that Abenomics was always thought of as a combined trade for overseas investors: buy Japanese equities and sell the yen. And reverse, i.e. sell Japanese equities and buythe yen, when Abenomics wanes.


But JPM notes both of these last two explanations have a problem: why does the yen not go up as foreign investors buyJapanese equities? In principle when foreign investors buy or sell Japanese equities currency-hedged there should be no currency impact. And when foreign investors buy or sell Japanese equities currency unhedged there should be in fact a positive correlation between the yen and Japanese equities. What are the circumstances then under which we have a negative correlation between Japanese equities and the yen?


We previously presented three flow circumstances:


1) If a foreign investor (buyer) purchases Japanese equities currency-hedged from another foreign investor (seller) who was long yen already (i.e. the seller owned these Japanese equities currency unhedged before), the net market impact would be an up movein Japanese equities and a down move in yen.


2) If a foreign investor (buyer) purchases Japanese equities currency-hedged from a Japanese investor (seller) and this Japanese investor uses the proceeds to purchase foreign equities currency-unhedged, the net impact would also be an up move in Japanese equities and a down move in yen. This flow appears to have taken place since mid-September. Foreign investors were buyers of Japanese equities, at the same time as Japanese investors sold domestic equities and as Japanese investors stepped up their purchases of foreign equities. But since September, the purchases of foreign equities by Japanese investors were smaller in magnitude relative to the purchases of Japanese equities by foreign investors. So the negative impact on theyen from the former flow was more muted relative to the positive impact on Japanese equities from the latter flow.


3) Another flow example is related to dynamic hedging by existing holders of Japanese equities, Existing foreign holders of Japanese equities could have unwound previous FX hedges in response to equity price declines in recent months, even if they did not sell any Japanese equities themselves. This is because equity investors tend to dynamically adjust their FX hedges to match the size of the hedges to the value of their equity holdings. So as the price of Japanese equities goes down in local currency terms, these foreign investors cut some of their previous FX hedges, pushing the yen up in the process. The opposite flow takes place in periods of Japanese equity appreciation: existing foreign holders of Japanese equities have to increase the size of their FX hedges to match the increased equity values, pushing the yen down in the process.


This dynamic hedging flow suggests that there should be an even stronger correlation between the performance of the yen and the absolute performance of Japanese equities in local currency terms, relative to the correlation between the yen and the relative performance of Japanese vs. US or global equities. But the two charts above show that the opposite happened this year. The correlation between the yen and the relative performance of Japanese vs. US equities has been stronger than the correlation between the performance of the yen and the absolute performance of Japanese equities. This suggests the above flow stemming from dynamic hedging by foreign investors of existing Japanese equity holdings, has likely weakened this year.


So from the above three flow circumstances, it is the second one that appears to offer the best explanation of what happened since September in the Japanese equity/yen space. 


So, following the recent buying, how overweight have foreign investors become in Japanese equities?


So in all, it appears that overweights in Japan have been focused mostly among leveraged overseas investors including CTAs, making Japanese equities vulnerable to an unwind of some of these positions in the near term. Non-leveraged institutional investors or retail investors are rather neutral.


To conclude, JPMorgan finds no reason to believe that the historical negative correlation between Japanese equities and the yen has broken down. The relationship between Japanese equities and the yen has been closely aligned this year if one looks at the relative rather than the absolute performance of Japanese equities.


More recently, since September, the purchases of foreign equities by Japanese investors were smaller in magnitude relative to the purchases of Japanese equities by foreign investors. So the negative impact on the yen from the former flow was more muted relative to the positive impact on Japanese equities from the latter flow. Going forward, overseas leveraged investors present the main vulnerability for Japanese equities, in our view.


Saturday, October 21, 2017

Kyle Bass: "Today"s Market Resembles The 1987 Debacle On Steroids"

The US stock market celebrated the 30th anniversary of Black Monday with the 2017 version of a rocky trading day: Stocks sold off early, with S&P 500 futures recording their steepest post-midnight drop of the year. But the dip was reflexively and aggressively bought, and stocks even poked back into the green seconds before the close as algos mistook a repetitive Politico headline about Jay Powell’s chances of becoming the next Fed chair for news - leaving us with yet another record close.


Of course, the historical juxtaposition of the 1987 crash with today’s unnaturally placid markets practically forced even the most bullish of traders to question how much longer the present market paradigm - where markets listlessly drift through a seemingly interminable series of record highs while trading volume and volatility remain suppressed - can possibly last.


With that question in mind, Real Vision released a video early today containing interviews with some of the biggest names in the hedge fund universe. Though the interview was shot a few weeks ago, remarks from Hayman Capital’s Kyle Bass resonated with market"s mood.


Bass discussed what he sees as the many short- and long-term risks to the US equity market, including the rise of algorithmic trading and passive investment, which have enabled investors to take risks without understanding what they’re doing, leaving the market vulnerable to an “air pocket."


And with  so many traders short vol, Bass said investors will know the correction has begun when a 4% or 5% drop in equities snowballs into a 10% to 15% decline at the drop of a hat.


“The shift from active to passive means that risk is in the hands of people who don’t know how to take risk. Therefore we’re likely to have a 1987 air pocket. This is like portfolio insurance on steroids, the way algorithmic trading is now running the market place.


Investors are moving from active to passive, meaning they’re taking the wheel themselves all at a time when CTAs are running their own algo strategies where they’re one and a half times long and half short and they all believe they can come out at the same time."


“If you see the equity market crack 4 or 5 points, buckle up, because I think we’re going to see a pretty interesting air-pocket, and I don’t think investors are ready for that,” Bass said.


When it comes to identifying potential catalysts, Bass said the US’s deteriorating relationships with both China and North Korea present significant long-term risks...


“Our trade relationship with China is worsening our relationship with north korea whatever it is continually worsens. We’ve got three people at the head of these countries that are trying ot maike their countries great again, I think that’s a real risk geopolitically."


...While the unwind of G-4 central bank stimulus could hammer equities and bonds in the short term.


"But when you think about it financially, which is actually easier to calculate, the financial reason is the G-4 central banks going from a period of accommodation to a period of tightening, and that’s net of bond issuance."


In summary, investors better snap up those out-of-the-money S&P 500 puts before it’s too late, because central banks - try as they might - can’t forestall the return of volatility forever.


Tuesday, October 3, 2017

Active Bond Traders Have Never Been More Short Treasurys: Is A Squeeze Imminent?

Yesterday, when discussing Crispin Odey"s letter to clients and what appears to be his "Hail Mary" trade, we pointed out that according to his latest client letter, the billionaire hedge fund manager has effectively bet everything on a plunge in bond prices, with a whopping 135% net short in gilts and JGBs.


We noted that, in light of recent shifts mostly among the CTA and hedge fund crowd, he is hardly alone in his mega bearish outlook on bonds.


Sure enough, according to the latest JPMorgan survey (for the week through Oct. 2) the bank"s clients as a whole have dramatically soured on Treasuries, with 44% holding a short position relative to their benchmark, the most since 2006, or before the financial crisis, and up from 30 percent in the prior period. Among those who actively place bets, such as speculative accounts, a record 70% were short, while an unprecedented (and impossible) 0% responded that they were long: in other words, everyone is on the same side of the boat.


As Bloomberg commented on the dramatic move, "the shift shows how a confluence of factors is weighing on the minds of bond traders as the fourth quarter begins. The Federal Reserve will start unwinding its balance sheet this month, and Chair Janet Yellen has signaled that stubbornly low inflation won’t deter policy makers from tightening. Meanwhile, in the betting markets, former Fed Governor Kevin Warsh, seen by some traders as having a more hawkish tilt, has the highest odds to succeed Yellen."


In the eyes of William O’Donnell at Citigroup Inc., the selling pressure may have only just begun.


“The crowd of longs between seven years and 30 years in U.S. rates is both heavy and also now slightly underwater,” with yields near or above their 2017 averages, O’Donnell, a strategist, wrote in a report Tuesday. “It leaves us thinking that any additional positioning stress via higher rates may one day turn a trickle of selling into a torrent of secondary market supply under the right conditions.”


Of course, with everyone "on the same side of the boat", a far likelier outcome is a massive squeeze as even the smallest deflationary event spark a scramble for the exits. One example, from the other side, can be seen in the week through Dec. 12, when 39% of clients were short, which at the time was the most since 2015. On Dec. 15, the benchmark 10-year yield reached 2.64%, the highest in more than two years. It hasn’t returned to that level. Subsequent record positions in early 2017 per CFTC Committment of Trader readings led to even bigger slides in Treasury yields, in turn leading to a near record long exposure just week later, only to lead to a move higher in yields.


Indeed as Bloomberg concedes, "at the moment, Treasuries don’t look like the screaming “sell” they did when 10-year yields approached 2% last month. Now at 2.34 percent, the yield is approaching the most oversold level in months, based on relative strength index analysis."


That leaves traders eyeing 2.42% , a high from May and also a key retracement level based on Fibonacci analysis.


“Short-term oversold conditions suggest that this support band should hold, at least initially,” O’Donnell said. But there’s “still more upside for yields and USD, which should keep bears’ hopes alive for a re-test of 2.60% before the end of the year.”


With few active traders left who can add to the short pile up, look for yields to glide lower once again as the next Tsy short squeeze materializes in the coming weeks.

Thursday, September 28, 2017

Warning: Danger Lurks Here

By Chris at www.CapitalistExploits.at


Take a look at the volume of stocks listed vs. indexes listed going all the way back to the days of bellbottoms, loud hair, and orange wallpaper.


Since 1995, the supply of stocks, particularly in the US, has been shrinking faster than Trump"s approval ratings. At the same time, the number of indexes have exploded like one of Kim"s shiny new missiles.


Why?


In a falling interest rate environment, the twin pressures of reduced returns and relative cost pressures have meant that investors, in order to make a buck, have flooded into the low fee structures offered by passive strategies. These include indexing, ETFs, and those truly insane creatures I"ve written about before: low volatility ETFs.


But what about those alpha generating hedge funds? Aren"t they meant to be smart and able to beat the market... any market?


Those alpha generating hedge funds have things called LPs. And though LPs may be smarter, and certainly wealthier than Joe Sixpack, they"re no less human. And human attention span and patience level has been in decline... correlated no doubt with the rise of social media and the Kardashian crowd. Like a virus, it infects everything.


As performance from hedge funds has been poor relative to the benchmarks, a self reinforcing situation where hedge funds, in order to ensure LPs don"t redeem, have landed up hugging the indexes.


This is the exact opposite of what hedge funds were meant to do, of course. In many cases, they themselves are simply buying the indexes, trying desperately to figure out how the hell they"re going to survive through the next quarter but determined simply NOT to underperform the index. It"s a losing strategy no matter how you slice and dice it.


For those hedge funds who refuse to chase the indexes... Well, they are now fighting the tidal wave of capital that has been shifting into passive investments, which forces those passive investments even higher.


This, in turn, leaves active hedge funds who refuse to get sucked in with increasingly substandard returns. They can explain until they"re blue in the face why certain indexes make no sense but when those indexes just keep rising day after day, month after month, it becomes a very tough stance to keep. Redemptions follow, and so by doing the right thing, they"re punished. And by doing the wrong thing (following the mob), they may get to stay alive just a little longer and this is what many have resorted to.


We all know that at some point there are no new buyers available to enter the market and hoo boy, do we then have a problem.


So... you either join the party or you leave the party.


The last to leave the party is Hugh Hendry and his baby Eclectica.


Hugh Hendry Murders His Hedge Fund


Og aye, tis tae tough


Hugh follows Eton Park and Perry Capital to name but a few more.


Paul Singer of Elliot Management fame put it well in his July investor letter to stakeholders.


"In a passive investing world, small shareholders have little-to-no voice and no realistic possibility of banding together, while the biggest shareholders have no (repeat, no) skin in the game so long as the money manager does not underperform the index."


Make no mistake, the rise of passive indexing is a bubble in dumb money.


We have a situation where the market is becoming completely lopsided and increasingly so at a blistering pace.


If it gets anymore lopsided, it"s going to be upside down. What"s more, the market participants have no interest or even determination of valuations.


An index doesn"t give an isht what the P/E ratio of any stock included in the index is, and the investors buying it have even less idea. It doesn"t care if the aggregate of stocks sitting inside its womb are over or indeed undervalued. It"s just a dumb bloody index, and you can"t blame it anymore than I can blame my dog for not understanding Shakespeare.


Those investing in passive have done so partly due to relative fee differentials, partly due to performance. But now also dangerously so... due to increasing inflows, which have continued to push values higher.


Now, having markets or sectors get silly is obviously as normal as a peanut butter sandwich, and provided you"re aware of it, we"ve little to worry about.


But what"s more frightening than the Kardashians in skinny pants is that as capital has fed into passive, the usual countering forces (active managers) of the market have been leaving the party, which has left the passive world to increasingly swell like a neglected infected wound.


What we need to think about is that increasingly there is no active market to stabilise this. It"s akin to having a 5-year-old"s party, inviting a troop of the critters, and then promptly sending all the parents down to the pub for a few hours.


Just as short sellers provide a balance to a market so, too, active management (who incidentally typically have skin in the game) have always provided a stabiliser to the overall market. What happens when the stabilisers all leave the room?


We can see this manifesting itself in the volatility index. As more capital enters at a steady pace so, too, the volatility falls.


And here"s the thing. The algos constantly feed back the daily data to recalculate their probabilities (read this article on VAR shocks). Risk? Nah!


At the extreme of the passive world sits volatility.


Selling volatility works really well. Just ask Neiderhoffer who has made godawful amounts doing it over the years.


Look closely, though, and you notice that even Neiderhoffer, who knows what game he"s playing, blows himself up spectacularly from time to time... and I mean complete armageddon wipeout stuff. Until that blow up comes, though, you just keep plugging away at it day after day and it just keeps paying you... day after day. You make money, make money... and then, well...


It all turns to isht and blows up in your face.


My friend Mark Yusko from Morgan Creek Capital places capital with the smartest strategies and hedge funds - active capital.


Who"s willing to bet with me that over the next decade being long smart active strategies and short passive (low volatility ETFs) will be a winning trade?


Wow Poll - 27 Sep


Cast your vote here and also see what others think


- Chris


“What could be more advantageous in an intellectual contest – whether it be bridge, chess, or stock selection than to have opponents who have been taught that thinking is a waste of energy?” – Warren Buffett, 1985 Berkshire Hathaway Letter to Shareholders


--------------------------------------


Liked this article? Then you"ll probably like my other missives on


this topic as well. Go here to access them (free, of course).


--------------------------------------

Monday, September 11, 2017

Is The Yuan About To Tumble After Friday's Shocking PBOC News? Here Is Goldman's Take

In a move that stunned China currency watchers, late on Friday (local time) Bloomberg reported that China’s central bank decided that it would remove a reserve requirement for financial institutions trading in FX forwards for clients by cutting it to zero from 20% currently. The change would take place on Monday, September 11 (it has yet to be confirmed). As a reminder, banks, funds and other financial institutions trading FX forwards for clients were required from October 2015 to set aside 20% of the past months’ sales as reserves in a move that was aimed at curbing currency speculation. Subsequently, the PBOC further punished traders, or rather shorts, by boosting short-term margin requirements on FX positions, making it virtually impossible to hold on to a short position for a long period of time.


All that changed at the end of last week, when the PBOC effectively "U-turned", and gave a green light to the same FX speculators whom it criticized (remember the Chinese anti-Soros media campaign), slammed, punished, and in some cases arrested, to now short the Yuan once more.


The reason behind the move was simple: in recent weeks the Yuan, both on and offshore, had soared far too high, to the point where Beijing was getting worried about its impact on exporters, as a separate Friday report from Reuters discussed.


On the surface, this was a brilliant solution to Beijing"s problems: it lowers the Yuan on one hand, and on the other, it is not the PBOC who is manipulating the currency, it"s the evil speculators who are "guilty", avoiding being blamed by the US for currency manipulation. Most importantly, the removal of this marginal capital control worked immediately, as the following intraday chart of Friday"s USDCNH clearly showed.  


So will this plan work, and is the Yuan set to plunge in Monday trading? We will find out soon enough, but until then, here is the explanation from Goldman"s MK Tang on what Friday"s move means, and its implications for Yuan policy, but first, here are several analyst opinions, as summarized courtesy of Bloomberg:


CIB Research (Guo Jiayi, Zhang Meng, analysts)


  • Scrapping the reserve requirement indicates the PBOC is confident of the yuan’s outlook

  • Given the weakening dollar and solid domestic economic environment, it’s unlikely the new rules will bring one-way expectations to exchange rates

  • Indicates the PBOC wants to slow yuan appreciation and prevent a herd effect, and it opens the window for further FX regime reforms

Commerzbank (Zhou Hao, emerging-markets economist)


  • Policy change underscores that depreciation pressure has largely diminished

  • PBOC signals it’s again sitting opposite the market as fresh long CNY positions triggered a rapid appreciation over the past week

  • Spread between CNY and CNH forwards to narrow significantly in coming months

Lianxun Securities (Li Qilin, macro researcher)


  • PBOC wants to ease strong appreciation trend, which could affect exports

  • Chance is limited for the yuan to continue the fast pace of strengthening of the past couple of weeks

  • PBOC is likely to show a stronger hand if markets don’t take note

Mizuho Bank (Ken Cheung, strategist)


  • Good time to spur hedging demand in both directions in the forwards market

  • Institutions which invest in onshore bonds via the Bond Connect can thus hedge FX risks onshore

  • Expects USD/CNH one-year forwards to drop, leading to narrower spread between onshore and offshore

ANZ (David Qu, markets economist)


  • Change won’t significantly cut corporate FX settlements, which are largely decided by spot prices

  • Demand from companies to buy dollar is rather tepid, so any future increase in forward positions should be limited

  • New rule will have limited impact on spot market, where central bank “guidance” will play a bigger role

  • It’s likely prohibition on net outflows in cross-border RMB pooling will be relaxed or canceled amid yuan strength

Finally, here is Goldman"s extended take:


Reported relaxation of FX hedging cost: backdrop and implications for CNY policy


Chinese media reported late last Friday (though not officially confirmed) that effective Sep 11, the PBOC would cut the reserve requirement on FX derivatives sales to 0% (from 20%), which would reduce the cost of FX hedging by importers.


We see three implications:


  1. the authorities may be less concerned about outflow pressures, which appear to have dissipated following earlier episodes of likely intervention-driven CNY strength to counteract bearish sentiment;

  2. it marks a possible meaningful step preparing for increased (two-way) CNY volatility in the medium term; and

  3. shows the continued importance of tracking signals of policy intention (including the fixing’s “countercyclical factor”) on the near-term CNY path, which seem to point to reduced comfort with the ongoing pace of appreciation.

Main points:


We provide an overview of the FX reserve requirement, and discuss the backdrop for the reported relaxation and the likely implications for the CNY policy.


1. What is the reserve requirement (RR) on FX derivative sales?


Introduced in Sep 2015, the RR sets the amount of FX that each bank has to deposit at the PBOC (with no interest remuneration) in connection with its sales of FX derivatives (including forwards, swaps, etc.) to non-bank customers. The RR has been set at 20% of the notional value of the derivatives.


This is effectively a tariff, increasing the cost for non-bank customers to buy FX via derivatives. Its introduction was in response to strong outflow pressures at that time, part of which was driven by a large amount of FX forwards bought by non-bank customers (worth close to $80bn in August ’15, c. 3x the previous usual amount). The authorities attributed the sizable demand for FX forwards to unhealthy speculation. FX forward purchases have sharply fallen since the RR measure, to less than $20bn in Sep ’15 and less than $10bn in recent months.


Late last Friday (Sep 8), Chinese media (e.g., 21st Century Business Herald) reported that the PBOC would lower the RR to 0% effective Sep 11, although at the time of writing this has not been officially confirmed.


2. What is the recent backdrop for the reported relaxation?


Outflow has significantly slowed since the turn of the year, likely reflecting tighter capital control as well as reduced devaluation concerns. That said, in the first several months of the year, market pressures were still skewed toward net CNY sales. In this context, in May the authorities added a "countercyclical factor" to the CNY fixing mechanism, initially intended to counteract the market’s "herding" behavior that had pressured the currency weaker.


Under the new fixing rule, when the market displayed a CNY-bearish tilt (CNY close weaker than fixing), the countercyclical factor the next day would tend to push CNY fixing stronger, as we have discussed here. But such fixing guidance alone did not seem to be effective. Instead, in late May through early August, we have observed three episodes of sharp appreciation, perhaps driven by policy intervention to entrench the countercyclical factor’s credibility and negate bearish CNY sentiment.


However, more recently since mid-August, the flow pressure seems to have reversed and the CNY strength more market-driven. The August reserve reading, which implies net FX purchase by the PBOC to lean against CNY appreciation, is the first official data suggesting this shift, although we await further flow data for confirmation. The reversal of market forces likely reflects the success of the earlier episodic policy support of the CNY in changing market psychology, as well as a weak USD and better China sentiment.


3. What are the implications for the CNY policy?


The reduction of the reserve requirement on FX forwards to zero would mechanically lower the cost of outflows via derivative transactions. In terms of policy, we see the following three implications:


  • The authorities have become a bit less concerned about outflow pressures. Therefore, the RR relaxation could be a precursor for incremental unwinding of other capital control measures, should the flow situation remain benign.

  • A meaningful possible step preparing for increased (two-way) volatility in the CNY in the medium term. Besides reflecting higher policy tolerance for outflows, the RR relaxation has the clear effect of lowering the cost for importers to hedge their FX liability exposures. Such hedging would in turn mitigate a main negative side-effect of having a more flexible FX regime, which has long been one of the authorities’ structural policy objectives.

  • As for the near-term CNY outlook, while assessing market pressures helps, interpreting policy intention is probably even more important. For instance, reserve data suggests the PBOC bought about $10bn in FX in August, only a moderate amount by China"s historical standards; it could conceivably have bought materially more to limit the CNY appreciation.[1] The fact that it didn"t seems to indicate that the authorities were comfortable with, or even desired, the strong CNY in August.

  • There could be “too much of a good thing” more recently, though. We maintain our view that risk of major depreciation is limited in the run-up to the Party Congress (to start on Oct 18). That said, we believe it is useful to continue tracking policy signals for the near-term CNY intention, including the countercyclical factor. Just when bullish changes in the countercyclical factor (i.e., $/CNY fixing below CFETS model-implied) preceded policy efforts to push the currency stronger in May-July, a bearish change in this factor currently could signal a decreased policy comfort with the continued CNY appreciation. On this score, we note that the countercyclical factor in the last few days has turned more reactive to the market appreciation pressures (Exhibit 1), potentially pointing to lower propensity to accommodate much further CNY strength.

Exhibit 1: Countercyclical factor has become more reactive to the previous day’s appreciation, hinting at decreased policy comfort with further CNY strength