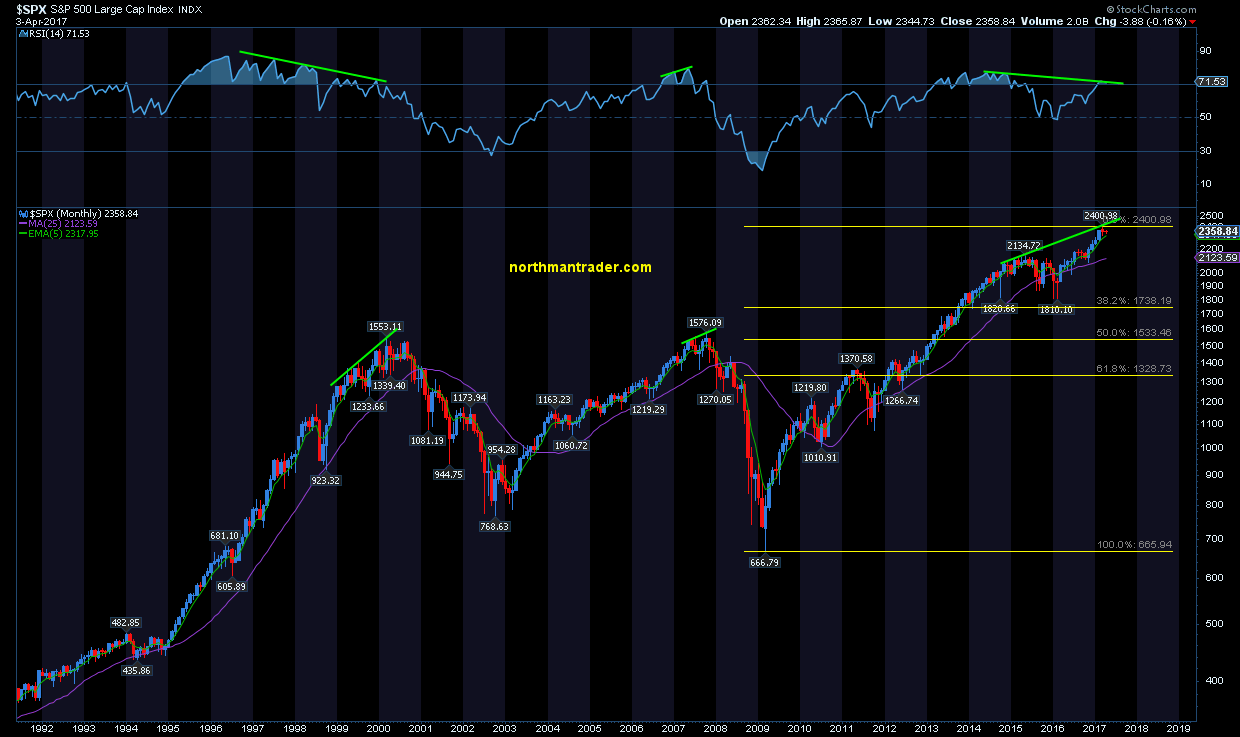
The trend in the S&P 500 remains up, as it is above long-term moving averages and is in a solid rising channel in the chart below. The little bit of softness that has taken place of late has done nothing to change that trend.
The Power of the Pattern wanted to share with you this morning a key test to the bull trend in the chart below-
CLICK ON CHART TO ENLARGE
The S&P has remained inside of quality rising channel (1) since the 2009 lows. The top of the channel was touched back in late 2014, where it then embarked on sideways to downtrend until it testing the bottom of the rising channel in 2016.
The strong rally since testing the bottom of the channel in 2016, now has it testing the top of the channel at (2).
This could be a dangerous channel resistance test for the bulls if selling would start, especially as the number of assets invested in the 2X long S&P ETF is near record highs!
Why you see chart pattern analysis with brief commentary:
There is a ton of news and opinions about markets and stocks that make the decision-making process more difficult than it needs to be.
I believe the Power of the chart Pattern provides all you need to see what is taking place in an asset and determine the action to take.
This approach has worked well for me and our clients and I encourage you to test it for yourself.
Send an email if you would like to see sample research and take me up on a trial of our Premiumor Weekly Researchwhere I provide actionable alerts on breakouts and reversals in broad market indices, sectors, commodities, the miners and select individual stocks
For What it is Worth: We are buying Gold in our small family fund. This is a trade, not an investment. Potentially a much longer term trade for us than normal, possibly a 12 month hold as opposed to our 3 day positions. We are buying physical in quantities that will not need to be sold if we are wrong, thus no leverage. We will also be swing trading gold with an upward bias as our indicators dictate below $1260 or above $1306.
Target picking is risky in an asset whose value is largely based on sentiment and prone to being "jawboned" into its proper place. But we believe for various reasons that if Gold does not pierce $1260 spot, its chances of a rally topping between $1450 and $1700 are strong over the next 12-18 months. The wide target range reflects the emotional factor in Gold"s behavior far outweighing supply, production costs, and its lack of fundamentals to measure using tools like EBITDA, PE, and cash flows. And our own analysis is corroborated from several different disciplines from whom we did not seek out to rationalize. It"s a trade, that"s all. But it"s a very good and very rare risk reward trade. it has set up right now. Further, it will either be violently and decisively confirmed (or negated) above $1306 or below $1260.
Why are we sharing this? That same question should be asked of Ray Dalio, Jeff Gundlach and others who announce they are bullish on Gold after they have bought. Our own position is not relevant to the market overall and we do not need to market our tiny positions to create an exit strategy a la George Soros. The premise for the trade happens so rarely its worth writing about, if for no other reason as an exercise in outsourcing our self-discipline on the trade.
When trading short term periods, intraday and intraweek, we use a volatility system for alerts to incipient movement. We risk 1 to make 2 and move on when wrong. It works about 50% of the time. it is net profitable. And best of all, positions that are in limbo are closed expeditiously. This is after all a volatility system. No vol, no position. It"s been cited here many times in the past. When it is right, it is very right. when it is wrong, you are out. Past posts and a 25 year track record of use bear this out from our active days. The bottom of this post goes into more detail on its use.
What we never did at Echobay or its predecessor fund CIS Energy, was use it on long term charts. We certainly looked at them, but only for bias in shorter term trades. Last month we took a serious look at our VBS algorithm on a monthly chart. Here is what we found:
Gold has a tremendous risk reward setting up above $1306 or below $1260..... which way from there is not known but can be handicapped once either number is breached
for a nexplanation of VBS see bottom Appendix
Step 2: How Equity Funds Play Gold
Portfolio managers at large equity funds who have contributed here anonymously use systems that advise them when being in cash as opposed to long stocks is prudent. What is also known is that funds like these punt gold positions with their discretionary in-house money for fun.
They use similar systems for entry and exit, and never risk much in their positions. Gold is a hobby to these guys. As a result, they like to buy and walk away with long term trade orientations and firm stops. This means using long term moving averages to avoid noise. We know this is true. And here is an example of how that type of positions is implemented:
In a recent interview a vocal critic of the Gold industry explained why he was buying Gold
…Gold is poised to close above its 12-month moving average for the second straight month. Going back to 1970, the average monthly return for gold following a close above the 12-month moving average is 1.47%. The average monthly return following a close below the 12-month moving average is -0.15%.
If you used the simplest of trend-following methods, investing in gold when it was above its 12-month moving average, and going to cash when it is below, the results would have been far better than just buying and holding gold. He continues:
The chart below shows when you would have been invested in gold and when you would have been out. Granted, prior to GLD, this could only have been done with futures contracts, or gold bullion, with the former adding a degree of leverage that I would not have been comfortable with, and the latter adding a degree of paranoia that also would have made me uncomfortable.
About Physical vs. ETF: While we agree with the rationale behind GLD vs futures if you are trading and not investing, we feel for multiple reasons the physical gold market is going to open up and become a serious competitor to ETF allocations within 12 months. Specifically, blockchain products are coming, and if properly implemented as a pipeline, owning physical gold not held in trust by a GLD custodian will be as easy as clicking a mouse. You will buy and sell physical Gold that will be yours and verified via the blockchain system.
So for us, physical gold now has the benefit of increased liquidity on the horizon, which means increased transactions and exposure. Which ultimately means decentralization of the Gold market from a few large firms to grass roots stackers, owners, and value preservers. We view emerging technologies as putting physical assets in a position to have their true value unlocked. Whether that be the tea farmer in India who can"t currently get a loan on his land due to government rules, to Silver whose value is somewhat disconnected from its price. The effect will not be unlike when a private company goes public. Accessibility and liquidity creates safety and increases demand. Owning physical metals is like owning a beneficiary of technology down the road.
Monthly Chart Through July 2017 using the 12 Month MA described above
Step 3: Optimizing the Simple 12 month MA Tool
by optimizing the MA with one factor we back tested greater successes when in trades. Conversely, we were also in less trades. On balance it was a wash. But right now the employed filter says the 12 Month MA has bigger upside than the average if profitable at all. A rare chance to buy close to the level the fund punters did with a statistical chance of greater profits than the 1.47% monthly average generated by the original backtest.
Updated and Optimized by the Author
The chart below shows the hypothetical results from each of the 30 exits following an entry (going back to 1970). Using these rules would have resulted in a loss two-thirds of the time. But as you can see, the losses have been relatively shallow, not exceeding 10%, while the gains have been good to extraordinary.
Step 4: Using VBS for Confirmation of Direction
Simply put: If we get a VBS signal trigger when $1306 trades, a decision must be made to add, sell, or hold based on the data that comes with the signal. If we get one on a $1260 print, the same must be assessed.
Step 5: Actions
We are buying Gold now based on the "Fund Finder" signal with a monthly stop out below the yellow line in that chart above.
$1306- we will consider adding a shorter term amount in a rally if the monthly VBS is triggered higher
$1260- we will consider either adding physical, or selling paper Gold for swing trading purposes if the VBS is triggered lower.
Per #1- we will close or hedge the first physical purchased on a monthly settlement below $1244 - the wide berth on monthly exits necessitates no leverage
Bonus: Moor Analytics comes to a similar conclusion from a different perspective.
Within the overall bearishness I noted that a possible area of exhaustion for this move down from 13624 comes in at 12732-644. We basically held this, but with a $1.6 violation, and rallied to 13084 before rolling over and rejecting from it again (although this time down the 12628 was simply support, not exhaustion)
And Michael"s most recent weekly report of Nov. 10th
I would note that we broke above a well-formed macro line in the week of 8/7 that came in at 12629. The
break above here projects this upward $183 minimum, $501 (+) maximum—the maximum to be attained likely within 9-12
months. This line comes in at 12357 today. I am late to the game on this, but we were only $18 from the original breakout
when I mentioned this, and have a lot of room to go in the projection.
Appendix
What is VBS?
Volatility Based Risk Reward Generator
+ Originally developed as an alert to when the risk of being short implied volatility is larger than being long it, and vice-versa
+ It is a probability model that handicaps risk reward
+ As a by-product of its original purpose, it gives risk/reward scenarios in market direction.
+ Due to its accuracy in predicting volatility expansion, directional applications are right or wrong quickly and is very useful in efficient use of capital
How VBS Works
Time is precious, Price is noisy, Volatility is less so.
+Volatility is less noisy than price, therefore more reliable as an indicator.
+Volatility cycles more cleanly and can be seen to "inhale and exhale" when viewed graphically with Bollinger Bands
+VBS is based on several relationships between historical and implied volatility across different time frames
+ It can be applied by traders on any time frame
VBS and Direction
It doesn"t predict price, only speed of movement
+It gives non-directional alerts and was initially developed for optimizing option portfolio risk.
+While not predictive directionally, VBS gives as a by-product excellent risk-reward setups for directional plays
VBS Process
Radar, Alert, Trigger, Entry, Exit
Radar- VBS generates 2 prices, one above and one below current prices for a "breakout" in market volatility
Alert- One of the prices is breached and closes its bar/ candle beyond that price level.
Trigger- Real volatility will expand
Market direction does not have to continue in the direction the price in #1 was broken
volatility based risk- reward prices are generated for directional use. I.E. Risk 1 to make 2
Entry- using the VBS risk/ reward generated levels, a decision is made to either go with the directional trend, against it, or do nothing
The trigger gives 2 bites at the apple if the trader so desires.
In "first way, wrong way" scenarios reversal levels are generated (N.B.- our preference is to not play the reversal and have left money on the table in favor of the trauma of being "chopped up". if compelling, we have used options to remain in the game on reversals)
Exit- is either from a stop-out, a profit capture, or a time limit
Stop-Loss- are generated by VBS and adhered to religiously. Profitable trades trail stops higher based on expanding volatility
Profits- exits can be subjective, we prefer taking 90% of position at target and leaving a tail if the VBS is not signalling Vol is overbought
Time Exit- trades that are neither profitable nor stopped out are exited in 3 bars/ candles. The signal is designed for quick confirmation / rejection of the trigger
Good Luck
About the Author: Vince Lanci has 27 years’ experience trading Commodity Derivatives. Retired from active trading in 2008, Vince now manages personal investments through his Echobay entity. He advises natural resource firms on market risk. He pioneered and executed the Nat Gas EOO arbitrage trade of 2006 to 2008, netting over $90MM for a NYC hedge fund before retiring. Over the years, his expertise and testimony have been requested in energy, precious metals, and derivative fraud cases. Lanci is known for his passion in identifying unfairness in market structure and uneven playing fields. He is a frequent contributor to Zerohedge and Marketslant on such topics. Vince contributes to Bloomberg and Reuters finance articles as well. He continues to lead the Soren K. Group of writers on Marketslant.
I feel compelled to keep documenting reality to raise awareness of the ever larger market dangers which keep lurking underneath the current bubble. Indeed I keep seeing a great void not only in awareness but also in price discovery that have propelled markets to current levels leaving investors and participants ever more lulled into a false sense of security by the current unprecedented phase of volatility compression.
Take these comments as part of an ongoing journey outlining building risk factors. You can read about additional updates/background in the Macro Corner, Market Analysis , NT Blog and the Market Analysis sections of the site..
Briefly to get everyone on the same page:
Two way price discovery, as a normal part of market functioning, has practically seized to exist. I’ve pointed out charts of this nature before, but I’ll use the quarterly $DJIA chart as an example to illustrate the point:
Several points to make here:
The $DJIA is on its 9th quarter of consecutive price appreciation. The last red candle was before the now almost $5 trillion in combined global central bank intervention since February 2016.
The $DJIA, as the $SPX, is now on its 4th consecutive quarter of not reconnecting with its quarterly 5 EMA. Such an extended disconnect has never occurred in the 100 year market history I reviewed. And believe me, I’ve looked:
The few examples of extended quarterly 5EMA disconnects I could find were associated with coming market pain.
Aside from global central bank intervention (also see Liquidity Wave) the other key contributing factor to the no 2 way price discovery equation is the unprecedented influx of passive ETF investing and plenty of data exists to illustrate this point:
What has happened? I consider it retail capitulation. For years hedge funds have underperformed central bank liquidity infested market waters yet retail investors keep seeing markets go up with no downside ever and no apparent associated risk with rising multiple expansion.
The end result: Investors are completely impervious to the building risk factors and the actual price/valuations of asset prices they indirectly own.
If there is no risk to holding stocks then who cares if the underlying asset will ever grow in its valuation? Who cares if the business models don’t match up the PEG ratios?
Price targets have now simply been rendered an exercise in FOMO expectations. Indeed Wells Fargo rightfully calls it another QE effect:
“It’s very similar to QE.” Harvey said Wednesday on CNBC’s “Trading Nation.” “With QE, you took a certain part of the Treasury market out of circulation. Now what you’re doing is you’re taking a good part of the equity market out of circulation, and you’re upsetting the supply and demand dynamics. There are fewer natural sellers.”
Wells Fargo’s new 2017 forecast calls for the S&P 500 to reach 2,636, which reflects about a 1.9 percent gain from current levels. The firm started the year with a 2,475 year-end target, which would have come in about 4 percent short if the year was to end now.
“We don’t see a lot of bad news in the short term, and so we feel it’s fairly justified,” said Harvey, who became in charge of the firm’s S&P 500 price target and earnings forecast in April. He acknowledges Wells Fargo’s initial forecast was “too conservative” and the year has been exceeding expectations.
According to Harvey, there’s still momentum in place for stocks to grind higher.
“No one wants to be the first one out of the pool. No one wants to de-risk at this point in time,” Harvey added. “You have this mindset of FOMO — fear of missing out.”
There. FOMO. I can’t disagree that this price extension or even further extension could happen. As long as there is no consequence to overpaying for assets and volatility remaining compressed with all corrective activity having been removed from markets what is to stop prices from advancing ever more?
The answer: The Great Void.
Let me explain.
Firstly let me go back to a chart I showed back in March when I discussed The Finale Wave:
Back then I said the following:
“This is actually a pretty good trend line for bulls as it keeps rising of course, hence the later price were to get to there the higher markets may extend. The bad news: If this trend line has market relevance (as it appears to looking at its history), then it suggests the following:
$SPX broke this trend line in 2008/2009. And despite vast global central bank intervention as well as building a global debt load to the tune of over $152 trillion, markets remain below this long term trend line. It’s still technically broken.”
This still applies to this day and here’s an updated view of the chart with the added context of the multi decade declining trend in the 10 year yield:
Why is this important: It could be argued that low yields remain the theory of everything over the past 30 years as we’ve moved from one bubble to next with central banks reacting each time by dropping interest rates to “save markets”.
Take the $DAX chart I showed the other day:
Same concept.
What’s the net effect of one way price discovery? Massive, historically unprecedented technical extensions that scream danger, incompatible with the complacent attitude of investors.
Let me show you some charts that need to be seen to believed. Frankly if ETF investors were to see these charts they may get a better sense as to where in historical context they are deciding to invest long in these markets.
Hence my quest to raise awareness and I use linear charts in some cases to really drive the point home. Linear charts make ZERO difference in regards to moving average disconnects or fibonacci retrace levels, but they can help illustrate the vastness of the void. Indeed log charts can breed a sense of complacency as often price does not appear anywhere near as extreme.
On this latter point let me give you 2 examples of two very successful companies using log charts:
$FB:
A very steady uptrend following trend lines very diligently with tags producing either rejections or bounces. The stock has had no real correction in almost 2 years. The fib levels outline the size of the corrective opportunity were markets to get shaken out of their current lull.
$GOOGL shows a similar picture:
An ever narrowing channel showing a void of any corrective activity of size.
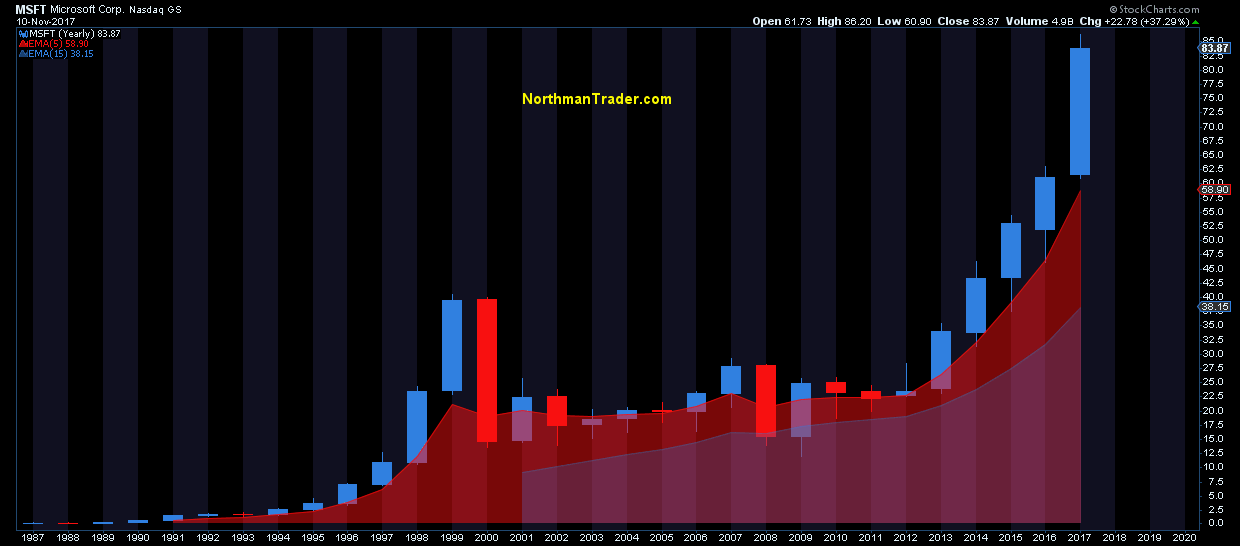
Now let’s get to the great awakening. I’m showing you a few examples of individual large cap stocks on yearly charts in relation to basic moving averages. Note the regular proximity to the annual 5 EMA in particular.
Now look at 2017. THIS is where investors are passively adding money to markets.
How do these things end? Can these things end? Look no further to $GE to give an imminent sense of risk:
Reconnects are coming. They always do and just because markets get stretched to extreme levels it does not mean reconnects are not coming.
These disconnects have been brought to you by one way price discovery. “No natural sellers” Wells Fargo calls it. That’s right. No sellers. Markets have buyers AND sellers. If there are no sellers you don’t have a market.
No sellers means no volatility. And the extremity of the volatility compression is highlighted in its inverted product the $XIV:
On the $VIX itself all regular spikes to the weekly 500MA have been eliminated 2017. For now.
History suggests that this state will not be able to sustain itself:
2017 has shown that extreme markets can become more extreme. There is nothing new about that. We’ve seen it famously in 2000.
Extreme markets do not imply future performance. But hey help inform risk/reward.
Whether we continue to extend price discovery in a one way fashion into year end I can’t say. What I can say with affirmation is that investors appear utter oblivious as to the historic and technical context in which they allocate cash to the long side.
One way price discovery, volatility compression and over 8 years of central bank intervention has paved the way to a general attitude that investors can’t lose money being long. Price will always come back. Not only in our life times, but these days every day as no downside ever last more than a few minutes. No natural sellers.
This will change.
And it’s critical for investors to keep an eye on possible signs of change, even subtle signs. I offered some not so subtle signs in Caution Slowdown. But macro signals can take a long time to play out in a market void of any apparent negative triggers.
Friday’s first $VIX close above 10 in 8 weeks may not amount to anything, but then it may also offer a subtle sign that change is perhaps closer than we think:
Yes the 200MA is now down to a pitiful 11.14, but the weekly close puts it above it. For the first time in a very long time.
Great Voids have a way of filling. Perhaps not in space, but here on earth they generally do. It’s just a matter of time. Remember: Tops are processes.
While we are disappointed to hear of Marc Faber"s recent comments and the fallout from them, Sprott Money is not affiliated with Sprott Inc. and have had no bearing in Mr. Faber"s resignation from the board. We are a private company held by Eric Sprott. Thanks.
The price of Comex Digital Gold continues to be held hostage by the major Bullion Banks which operate on the Comex in New York. Though some "improvement" in their collective position was noted in the latest bank Participation Report, it is very important to note that The Banks are still as heavily net short as they were at the price peak in the summer of 2016.
In the article, we wrote that the 24 Bank short position in Comex gold had nearly doubled in just two months from 104,788 contracts net short to 213,746 contracts net short. The significance and speed of this rise rivaled what was observed in the first half of 2016 and we all know what followed in the second half of 2016. Namely, a smash in price that flushed the Spec longs back out of the Comex paper gold market and allowed these Banks to buy back and cover many of their short positions.
Specifically, the 24 Bank position, as divulged through the CFTC-generated Bank Participation Report, rose from just 45,259 contracts net short on 1/5/16 to a high of 195,262 contracts net short on 5/3/16. After falling back in June of 2016, this position again hit 191,834 contracts net short on 7/5/16.
From there, as price fell from $1375 to $1175, the 24 Bank position contracted back to just 73,722 contracts net short on 1/3/17.
As price rose again in 2017, The Banks resumed their profitable game of initiating Comex contracts on the sell side and taking the opposite position of hedge and trading fund speculators on the buy side. As price rose once more from $1175 to the early September peak near $1360, the 24 Bank position rose again to the aforementioned 213,746 net short.
Our concern in September was that all of this Bank shorting would soon lead to another fall in price and, unfortunately, we were proven correct as price fell to $1275 by the time the latest survey was taken on October 3. However, even though price fell by nearly $75 between report surveys, the latest Bank Participation Report showed that the total Bank position had only declined by about 30,000 with a new net short position of 182,197 contracts.
Therefore, there are several important items to note at this point:
1. As of October 3, the 24 Bank net position was nearly as heavily net short was it was at the price peak in July of 2016.
2. While doubling the size of their net short position on the $150 price rally of July and August, The Banks were only able to trim their position by 15% on the $75 pullback in September.
3. The Speculators have obviously held firm despite the recent pullback in price. They have not been quick to turn tail and run from Comex gold, choosing instead to remain steadfastly long.
So now the battle begins for the fourth quarter. Will price rise as emboldened Specs demand even greater long positions from the market-making Banks, forcing The Banks to retreat? Or will The Banks once again seize control of price and send it plunging down through the 100-day and 200-day moving averages, which in turn would finally lead to the Spec liquidation The Banks seek?
Since January, we have forecasted at TF Metals Report to expect the highest prices for calendar year 2017 to be seen during this fourth quarter. The only "fly in the ointment" of this forecast is this current historically large, Bank position. Can price move higher again even though The Banks are already net short 182,917 contracts for about 570 metric tonnes of paper gold?
We"re likely not going to have to wait long to find out.
Questions or comments about this article? Leave your thoughts HERE.
This post is not meant to be a short-term timing tool (that discussion is there, but unimportant for most people), but a way to understand sentiment. The PMs are a very emotional market. It is very dangerous to get bullish with the crowd on the big rallies. The selloffs quickly ramp up the bearish sentiment. The post below was written a long time ago, and is re-posted into all of the big selling waves in gold. Sentiment shifts/crowd behavior never changes. Confidence rallies with price, and drops with price. On 9/11/17, I re-posted some wildly bullish articles around the internet about gold regarding the “bullish trendline breakouts, new highs, being above (useless) moving averages, and a potential pause in rate increases”. Now we’re starting to see the opposite – “failed breakouts, interest rate increases, monthly reversals,and being below (useless) moving averages”. There continues to be widespread ridiculous commentary about how interest rate increases and “real” interest rates are supposedly bearish for gold – here is a post debunking those views. Gold hit its secular bottom two days after the first Fed rate increase in nine years, and has rallied substantially along with the rates, yet people still don’t get it.
The original post is below. Keep in mind it was last updated on 7/9/17, so the dates are relative to then. But the general sentiment commentary can be for any time, any week, any month. Yes, gold is in a secular bull market, and the juniors are closing in on a true bull market:
———————————————————————————————————
Gold is in a bull market, but it’s still under the influence of an accumulation area, meaning more volatility – opportunity. The true uptrend "breakout" is coming this year. The secular bottom was in December 2015 , and I stuck my neck out and bought gold even with the worldwide ultra-bearish view of PMs then – and wrote a post on 12/9/15 discussing why it was finally time to buy gold, and especially the miners. We’re up substantially from those lows. But far too many people gain tremendous confidence, become complacent, and fear “missing the move” in an uptrend, right at the worst times to get confident, after/into a big rally, (around the highs). And far too many people lose confidence in an overall uptrend/bull market right at the worst times to lose their resolve, after/into a selling wave (around the lows) – opportunity. That confidence and fear of missing the move (at the worst time) just happened into the 6/6/17 highs, when there were numerous calls for a “trendline breakout”. My view was the opposite, and used the recent selling, and “bullish jobs number” to buy.
In a bull market the big scary reactions are the time to use our emotions in our favor, by using reverse psychology on ourselves. Is it easy? No it’s not. But if you’re feeling scared, gloomy, and can’t imagine there could be a bottom setting up, then so is everyone else. And these lows are also at the same time that most of the market shorts are getting super confident (weak hands). Which is just like how most of the market longs get super confident right into the highs (weak hands), as per the second week of February in the miners. So it’s in the big selloffs when we need to pretty much put the charts aside and step up to the plate. Because who cares what the charts look like if we allow our emotions to rule.
Complex methods are useless for almost everyone, especially myself. Because 75% (or whatever number, you get the point) of this business is about psychology – meaning our own psychology, and also being able to interpret, pretty well, everyone else’s (the crowd’s) psychology. This may sound weird, but instead of spending so much time learning a “method”, you may want to spend time truly understanding your own strengths and, especially, weaknesses. And also learn about the psychology of the crowd. Two outstanding books to help learn crowd psychology are “Nobody Knows Anything” by Bob Moriarty and “Extraordinary Popular Delusions and The Madness of Crowds” by Charles MacKay. In the bigger picture, understanding our psychological/emotional makeup, as well as that of the crowd, is much more beneficial than being tied to a method. But if we can mesh our newfound understanding of psychology with a solid method, then that is a pretty powerful approach. And actually, it’s the approach to markets which is the most important thing. Who cares what the method is if we can’t pull the trigger (unemotionally) at the “best” entry points?
It happens time and time again. People have all of their great looking charts with their fancy moving averages, support areas, and trendlines. These charts look great when prices are in a sustained move higher. The moving averages all “say” buy, buy, buy. The support areas are “holding”, and the trendlines are slanting up, up, up. People look at charts then and see things “are looking good”. Who wouldn’t be confident? And the only ones with pain at that point are the shorts, plus the people who were too afraid to buy into the previous fear-based selling, thus these folks are “missing the move”. Missing the move can be as painful for many as losing is for other people. Then the selloff starts, and the confident longs wish they’d sold. But they look around the internet for the GURUS (who were bearish at the bottom), to give them reassurance. And the selloff deepens, and the mood changes. and the charts look horrible – support areas get broken, trendlines get broken, and moving averages are all pointing down. In short, the charts look horrible, and the vast majority of people, who are tied to their charts, get as bearish as everyone else – so they freeze. And then, once again, they do nothing right at the potentially best entry points into markets.
Markets haven’t changed since the Tulip Mania. Meaning ninety percent of the people will never be able to pull the trigger at the best entry points, and are too confident to sell into the greed. Don’t be one of them.
Legendary investor Jim Rogers, who in 1973 founded the Quantum Funds, a prominent family of hedge funds, with then-unknown Hungarian-born financier named George Soros, joined RealVision’s Steve Diggle for a wide-ranging interview where the legendary financier, who moved to Singapore in 2007 with his family because he wanted his children to be immersed in Asian culture, discusses his views on gold, bitcoin, and what makes a good investor – along with his belief that a major correction in financial markets is about to begin.
The interview, which was filmed two weeks ago in Singapore, begins with a discussion of a theme in finance that’s been at the forefront of discussions about the market outlook. Many investors believe that, with volatility at record lows and valuations at record highs, a major shock is imminent. However, these same investors have been burned by uncooperative markets, as an expected selloff has yet to materialize.
Rogers said he stumbled into his first job on Wall Street, but ended up falling in love with it because it allowed him to “follow the world and know about things.”
He added that, over his investing career, Roger"s has learned that he has a tendency for his calls to be early. So now when he makes an investment decision, he waits six months before buying.
SD: How do you know the difference between being early and being wrong? Because -
JR: You teach me that, OK? I"d like to know. I"m still trying to learn.
SD: I really don"t know, either. I mean, one of the things that has confounded, I think, all of us in this most recent unprecedented rally - I mean, it"s not unprecedented in history, but the sort of things that have gone up and the level of volatility we"ve had that"s been unprecedented. The only period that I can compare it to are the late 90s, where just everything in a certain area went up. Now it was almost-- at least in the States, it"s almost everything across the board. And there have been plenty of people who"ve wanted to short the FANGs, to short some of the tech stocks, to short some of these very expensive blue chips. And they"ve been very badly punched.
And then even in the face of very good mutual fund investors, people with tremendous track records like Grantham Mayo, who have moved to a higher cash position - they"ve seen massive reductions, because their own investors don"t seem inclined to stick around and see how it plays out. So both on a personal and professional level, being early seems to be incredibly painful and destructive to your business.
JR: Sure can.
SD: So if you"ve got a conviction, do you wait for a change in momentum? Do you use moving averages, which is something that I know people have been used, and I"ve used something myself, which is to wait until the 5 and 20-day diverge, and that gives you a signal that momentum"s coming out of a trade? Or do you just need to size it to a degree which you can be persistent?
JR: Well, I usually - since I know I"m always early, I make a decision and then wait, and just make myself wait a month, six months, whatever it happens to be. And I"m still too early. I"m still too early nearly always, because I make the decision too soon, I realize. So maybe I better start making the decision later in life. Sometimes, you just have to throw in the towel. Especially on the short side, you have no choice. If they"re just racing against you all the time, you can sit there and meet the margin calls all day long, but one of the old adages is, never beat a margin call, which you may have heard from old-time traders. If you"ve got a margin call, just don"t meet it, because that means something is very seriously wrong.
SD: Right, that"s your stop loss.
JR: Yeah, well, stop losses are usually before a margin call comes. But I want to go back to something you said. You"re not as experienced as I am, obviously, because you"re not as old as I am, is what I"m saying. But I remember in the early 70s, there was something called the Nifty 50, and they were 50 stocks that everybody - the JP Morgan bought everyday. Didn"t matter. Avon, Xerox, IBM - they were stocks that always were eternal growth stocks.
And they just kept - we would short them, and they just kept going up. They never stopped. Polaroid-- that was another. And they just never stopped going up. Everything else stopped going up but those Nifty 50, which would be something like the FANGs today, or maybe in the late 90s, some of the other kinds of stocks. So this has happened before in market history. They eventually crack, there"s no question.
And to today, if you look at the S&P 500, for instance, in the US, I think there are only 40 or 45 stocks that are above their 50-day moving average, to use technician"s kind of talk. Everything else is in a downtrend. And yet the market is making all-time highs.
SD: And so there"s a lack of breadth in the market.
JR: Definitely that lack of breadth. What is that - over 90% of the stocks are in downtrends. 10% are in uptrends, but they"re big companies. And since the S&P is capitalization weighted, those 50 stocks, 40 stocks, whatever it is, dragged the average to all-time highs.
Diggles" questions soon veered toward the subject of what makes a good investor. Some believe, Diggle says, that to have conviction, you need to know more than 98% of people who follow a stock.
Rogers said he was never a very disciplined investor, so it’s difficult for him to say how one develops skills like timing and good judgment.
Knowing more than your rivals is a major advantage, he says. But there’s something to be said for judgment that just can’t be taught.
SD: So what was different about your analysis? Had you gone deeper into this company? Because one of the things that you"ve said on a number of occasions, and I think it"s very impactful, is if you want to have conviction, you have to know more than not just 90% of the people, but 98% of the people who follow the stock. Is it that you"ve gone deeper? You"ve read the annual report, you"ve looked at what would now be the 14k. Or was it that you"d seen something with a greater level of skepticism or objectivity which other people had missed?
JR: Well, it"s both. If read the annual report, you"ve done more than 90% of investors. If you read the notes to the annual report, you"ve done more than nearly everybody, including the CEO of the company. So it is certainly knowing more than other people. But then it takes more than that. You also have to know more, but then you have to figure out what does it mean? Just because you know more, you have to then analyze it.
If 100 people go into a room and hear a presentation, Steve, they"ll all come out - most of them will come out with the same view. Seven or eight of those people will come out and say, aha, what this really means is it"s going down the tubes, or whatever you come out with. Or seven or eight will come out and say, this is the best thing since sliced bread.
They will realize. They will analyze it and understand it better than the others. It"s judgment. I don"t know how to teach judgment. I wish I knew how to teach judgment. Facts are wonderful. Knowing more than everybody else is a big, big, big leg up. But then judgment - how you get judgment? And that"s certainly what I didn"t have. I certainly didn"t have timing. Not that I do now, but I have a little better judgment than I used to, and a little better timing than I used to, because I learned to wait.
SD: So your prescription to be an above average investor, to go back to my original question, is be independent-minded, do your work. Don"t try and perfect the timing, but if you develop a high enough level of conviction around it, see it through.
JR: Yeah, that"s what I always do. And sometimes, I get it right. But I"ve certainly made plenty of mistakes in my life.
With stock and bond valuations hopelessly inflated, Rogers says investors hoping to lock in the highest risk-adjusted returns should consider buying gold coins. Barring that, gold futures are the next best market. Rogers says trading gold futures is a great strategy for traders because it’s a market where speculators have easy access to leverage.
Furthermore, investors who have time to conduct the due diligence should consider investing in a gold mine – but it needs to be the right gold mine.
SD: Going back to gold, so gold coins -
JR: Gold coins are the best way. And you should have physical possession of some gold coins. After that, gold futures are the best way if you want to make money and you"re a good trader. Gold futures, that"s where you can get the most leverage of any, unless you can find the right gold mine. But there are hundreds of gold mines. If you"re smart enough and have the time to find the right two or three gold mines, then, yeah, then you"ll make huge amounts of money in the right to - but, you know, there are hundreds of gold mines.
The conversation soon turned to a discussion of the ETF space, a market about which Rogers has many reservations.
SD: And investors do seem to be becoming more short-term, despite the fact that everything we know tells us that finding good people and backing them for the long-term is the most successful thing you can do. Investors seem to be becoming more and more influenced by very short-term records. And that"s one of the things that"s savaging the mutual fund industry right now. One of the things that I wanted to touch on is this ETF phenomena. I mean, it"s probably the equivalent of the Nifty Fifty of the day, which is buy everything in its weight, don"t do any research. Don"t take any views. Don"t even take a view on a manager let alone a stock, but just own a basket. And a lot of people feel great disquiet about this. I think your commodity index has a few ETFs on it, does it? So perhaps you"re not the guy to ask if you"re in the ETF industry.
JR: No, no, no, I certainly see what"s happening in ETFs. I mean I pay enough attention to know what"s going on. First of all, ETFs are very efficient, very easy, very simple. There"s no question about that.
Therein lies part of the problem, of course, with ETFs is that they are easy, simple, et cetera and that makes it easy for somebody to say oh, I want to buy Germany, buy the German ETF, and don"t even look to see what"s in the German ETF or whether it"s a good ETF to own. And maybe it should be a terrible ETF, but nobody looks anymore.
So there are excesses developing in the ETF business.
There"s no question about that. But don"t worry Steve, we"re going to have a bear market. And when we have the bear market, a lot of people are going to find that, oh my God, I own an ETF and they collapsed. It went down more than anything else. And the reason it will go down more than anything else is because that"s what everybody owns.
And it is this bear market that looms over the market that Rogers is most fearful of as the level of debt that has built across the globe makes a disaster inevitable...
JR: Steve, in America as you know, we"ve had bear markets every few years.
SD: We used to.
JR: Well done. And Janet Yellen will tell you we"re never going to have a bear market again because she"s smarter than we are, she"s smarter than the markets, and the central bank has things under control now. She publicly stated this. Do not worry. We will not have financial calamities again. Head of the central bank in America has said that out loud officially, Mrs. Yellen-- yeah, Mrs. Yellen.
I happen to have a different view. Now if you believe the American central bank, you shouldn"t be talking to me at all. But we"ve had, we used to have bear markets every several years. We always, always since the beginning of the republic. In my view we will have them again.
And the next one is going to be horrendous, the worst-- you came in the business in "86. It will be the worst in your lifetime, in your financial experience.
And the reason, in 2008 we had a bear market because of too much debt, staggering amounts of debt. Steve, since 2008 the debt has gone through the roof. Every country in the world talks about austerity. Nobody has reduced their debt in the last few years.
Everybody has increased their debt in the last few years. And so the next time we have a bear market, it"s going to be horrendous because of this.
Even China-- in 2008, the Chinese had a lot of money saved for a rainy day. It started raining in Singapore. They had a lot of money saved for a rainy day. It started raining.
They started spending and helped save the world. But even China has a lot of debt now.
Like his fellow hedge-fund luminary Ray Dalio, Jim Rogers is a cryptocurrency skeptic. However, his outlook is somewhat more nuanced. While Rogers says he doesn’t know enough about the market to have a view on which coins might prosper and which might die on the vine, he suggested that people shouldn’t assume that bitcoin will dominate the market forever.
After all, Rogers says, most people have never heard of the company that invented the automobile – it disappeared long ago, he said. There once were hundreds of companies manufacturing cars around the world. Now, he says, there are only 25.
SD: Well, there"s been plenty of commentary on cryptocurrencies or cybercurrencies on RealVision and in the mainstream. We"re trading them. it"s an extraordinary financial experiment. If you"re a libertarian, I guess you mind find it inspiring that this has happened with absolutely no regulation. But where do we go with these things? Are you a true believer?
JR: Well, Steve--
SD: Are you an enormous skeptic?
JR: I don"t own one, nor am I short one. So I am neutral in that sense. I do know that there are over 2,000 now in just a few years. And anything that booms like that usually has a reason - there"s reason for skepticism. You do know that some of them are already zero.
I think the Wall Street Journal had an article yesterday maybe that 30% of the ones that have been launched in the last year or two are at zero because they have not traded. Now, there are some that have been skyrocketing. They"ve gone up 30 or 40, 100 times. So if you own the ones that have gone up 30 times, you think these are wonderful. If you own the ones that have gone to zero - or some have already gone bankrupt.
Somebody offered me a lot of them recently. And while I was doing my homework, it turned out to be a sham, a fraud. Fortunately, I was doing my homework so I never got around to taking them.
There"s no question that the world has money problems. There"s no question that all of our lives are being changed by the internet. My kids will never go to a bank when they"re adults. My kids will never go to a post office.
They may rarely go to a doctor when they"re adults. And so money"s going to change on the internet too.
Which one? I don"t know. You"ve heard of IBM in the computer business? IBM did not invent computers. The company that invented computers you never heard of, likewise with automobiles. I mean, there were hundreds of automobile companies 100 years ago. There are only 25 now.
Rogers, who chafes at being called a contrarian, says one sure-fire strategy for strong investing returns is investing in assets that are "hated" by the broader investing community, for example his Russian-stock investments are making all time highs, he said.
SD: I want to turn to a few specific sectors now rather than the general outlook of the world. It"s clear that you"re very concerned about that, though not so concerned that you want to actually be fighting it with aggressive shorts right now. One thing that you"ve spoken about in the past and one thing that we are exposed to is agriculture. It"s an area that"s generating quite a lot of comment. But from our experience, very few people have actually done anything about it. Very few pension funds, very few individuals have exposure to it. It"s hard to get through the stock market. There are very few agriculture companies, certainly on land-owning companies. You can get exposure through the food industry. But you became very positive about the agriculture a while ago. Where are you know on that?
JR: I"m extremely bullish on agriculture. That hasn"t made me any money yet. Well it has a little bit because one of my largest shareholdings - a large - well, it"s not one of my largest, but I am a director of a Russian fertilizer company which is making all-time highs or near all-time highs, which is pretty astonishing given that it"s Russia and everybody hates Russia, as you well know. In fact I"m startled that all of my Russian stocks making all-time highs.
And this is a hated market. So it"s something I have learned. If you buy something that"s hated, chances are you"re going to make a lot of money down the road.
In one of his last questions, Diggle pointed out that Rogers, who began working on Wall Street during the first half of the twentieth century, has often expressed a disdain for young people working in finance.
Diggle says he first noticed this about Rogers while reading a piece he wrote for Barron’s Magazine in the late 1980s.
Rogers says he doesn’t trust young people for one simple reason: They’re often cocky. But the Darwinian nature of Wall Street quickly separates the wheat from the chaff, making those who survive far more tolerable.
SD: I think you have something against guys in their 20s because the first time I became aware of you as an investor was a Barron"s article written in the summer of 1987, and it"s a very impressive article. I was very young on Wall Street. And there was this guy, Jim Rogers, and they said, what do are you bearish on, Jim? And you said, the world. There are all these 20-something guys that are thinking that they deserve six figures just because they work on Wall Street and they know how to buy stocks. And three, four months later, you turned out to be absolutely right.
But as a 20-something at the time, I thought you were being very unfair on 20-something guys. Now that I"m 53, I share your view of these 20-year-old guys. You"ve got to stay away from them.
JR: Well, but see, you made it. You survived. You"re a 26-year-old or 20-year-old who made it and survived, and so it"s OK. Many of them don"t and don"t know why. They make a lot of money. They don"t know why they made money.
So they don"t know why they lose money. They don"t know what happened.
You, at least, something happened. You"re still here. You still have a job. You"re still in the investment world.
"U.S. Virgin Islands Gov. Kenneth Mapp signed an emergency order allowing the seizure of private guns, ammunition, explosives and property the National Guard may need to respond to Hurricane Irma."
So, the goverment can seize such items in such an event. Imagine that...
This remains a market in which traders are, for lack of a better word, "confused" (another good word is "paralyzed" as we observed one month ago).
For the latest confirmation of this, look no further than Bloomberg"s macro commentator (and former hedge fund manager) Richard Breslow, who in his latest macro note admits that "truth be told, there are very few of us who know what’s going on with the equities markets." The other problem is that despite all the "fundamental analysis, valuations, metrics and the like" by financial professionals, the market appears to move in jagged discontinuities, with little logic or rationale, immune to the best financial "hot takes."
Inevitably, Breslow writes, "the market doesn’t carry through as promised and it’s inevitably made clear that it has nothing to do with that day’s investing thesis but some nefarious and exogenous influence."
Almost, as if, it"s all in the hands of central bankers... Or maybe not that nefarious, and risk prices simply act as they (illogically) would in a robot-eat-robot, or perhaps algo-eat-algo, world (a perverse cannibalization that has been puzzling the FT recently).
The good news, is that Breslow believes he may have stumbled on the solution to everyone"s problem: how to trade this painfully rangebound, seemingly irrational market:
So put all this aside and concern yourself with how each equity market is behaving around its 21- and 55-day moving averages. Almost every index respects these indicators and traders should love the opportunities presented when the two lines cross. All the words you hear mean little if you’ve not been given the sign.
The P&L punchline: "Risk off is when the 21-dma crosses lower versus the 55-dma. That’s when you know you should be scared. When the opposite occurs, feel free to go back to ignoring the front page news."
While Breslow highlights just how predictably responsive to this 21/55 narrative both the EURUSD and USDJPY have been the big test will be ES, which while stuck in a tight range, may be about to break out:
Two weeks of a lot of noise seemingly signifying nothing has caused the 21 to inch stealthily lower and it hovers, as we speak, 5 points above the 55. If, not when, they cross it’s likely that you’ll have a clearer sense of what to do. Nota bene, close but no cigar, doesn’t score points in this particular game.
Will investing, and trading, indeed be as simple as Breslow makes it appear? The answer should emerge in just a few days when the S&P"s 21- and 55-DMA cross. The result could be violent.
* * *
Richard Breslow"s full note below:
Truth be told, there are very few of us who know what’s going on with the equities markets. On any given day, they’re going to collapse, never go down again or must be sold or bought on any strength or weakness, as the case may be. And, like congress, many, if not most, people hate the group as a class (index) but love their personal representative (sure winner). The simple truth is that this asset class’s fate is being clouded by the fact that the question is being framed all wrong. And as scientists of the market we should know better than to forecast (kind choice of words) market direction while ignoring the maxim, “garbage in, garbage out.”
Day in and day out we’re inundated with analyses of valuations, metrics and the like. We get our regular instant armchair take on the latest geo-political outrage. After all, who understands this stuff better than foreign exchange salesmen? And a lot of time we’re just simply exhorted to love or hate a given bourse based on the perceived charisma or odiousness of the head of state.
Macron’s dreamy, so of course after he rewrites the utterly entrenched labor laws of France, overhauls the economy into a hotbed of innovation, he will turn his full attention to European-wide structural problems. Rumor has it, he can also make an incredible vegetarian foie gras. How can you not be optimistic about everything Europe? Other leaders must be given no quarter on any issue as a matter of principle. I mention this only because if you look at a chart of the euro versus the dollar, yesterday’s spike and subsequent failure above 1.20 looks distinctly like a middle-finger pattern.
Inevitably, the market doesn’t carry through as promised and it’s inevitably made clear that it has nothing to do with that day’s investing thesis but some nefarious and exogenous influence.
So put all this aside and concern yourself with how each equity market is behaving around its 21- and 55-day moving averages. Almost every index respects these indicators and traders should love the opportunities presented when the two lines cross. All the words you hear mean little if you’ve not been given the sign.
Risk off is when the 21-dma crosses lower versus the 55-dma. That’s when you know you should be scared. When the opposite occurs, feel free to go back to ignoring the front page news.
The euro has been on a tear since April. How do you know when it starts to be a relative performance issue for European stocks? The end of June, just as soon as the technical signal flashed.
Is USD/JPY weakness becoming a problem for Japan? Let’s see, but be aware the lines crossed yesterday.
Which sets up a really interesting question. The one you all actually care about. The S&P 500 looks like it’s stuck in a tight range. Where it goes nobody knows. Follow the lines. Two weeks of a lot of noise seemingly signifying nothing has caused the 21 to inch stealthily lower and it hovers, as we speak, 5 points above the 55.
If, not when, they cross it’s likely that you’ll have a clearer sense of what to do. Nota bene, close but no cigar, doesn’t score points in this particular game.
There"s not much to encourage Bulls in the daily chart of the USD.
The U.S. dollar"s relentless decline this year poses a question: is the USD setting up for a monster rally, or is it in a slow-motion crash? Opinions vary, of course, as to the possible reasons for the massive decline: European growth is better than expected, Trump"s presidency is going nowhere, the Federal Reserve won"t be raising rates, and so on.
The nice thing about charts is they summarize all these inputs into a snapshot. So let"s take a look at the daily and weekly charts of the USD.
Daily:
Weekly:
There"s nothing fancy here, just the basics of moving averages, RSI, stochastics and MACD. There"s not much to encourage Bulls in the daily chart: every attempt to regain the support of the 20-day moving average has failed, and triggered another leg down.
RSI and stochastics are oversold, but as this chart illustrates, oversold conditions can continue for quite some time. MACD may be setting up the beginnings of a divergence/reversal, but maybe not. At this point, betting on a reversal might be a case of catching the falling knife.
The weekly chart is even more dramatic. Judging by the steep decline this year, the world is ending--at least for the USD. RSI is oversold for the first time in 2+ years, stochastics have been deeply oversold for months, and MACD is in a cliff-dive that could end in a belly-flop.
The only shred of bullish hope is the decline has finally reached key support/resistance at the 200-week moving average (MA) around 92, a level that also happens to be support going back 2+ years.
A definitive plunge below this support would suggest the freefall has more to go, while a defense of this level would offer some initial stirrings of support for an eventual reversal.
A quick glance at the open options a couple months out on the USD ETF, UUP, finds significant volumes clustered around strike 24 puts--bets UUP will drop below its current level around 24-- and strike 25 calls--bets that the USD will recover in a sharp rally.
Punters seem well-positioned to hedge a big move up or down--just what we"d expect after months of steep decline to a key support zone.
Is the Eurozone economy and banking sector fixed, and all the EU political tensions resolved? Is the Eurozone doing much better than the U.S. on all fronts? The sharp gains in the euro seem to suggest so. Skeptics might want to keep an eye on the USD charts for a market-sentiment read of these political-social-financial trends.
The number of individual S&P 500 companies above their 200-day moving averages (200-DMA) has rolled over.
Put simply, the broader market is NOT confirming this move in stocks.
So overall the momentum is leaving the market... but still the stock market index is going higher...
Why is this?
Because the market is being propped up by just a handful of Tech Companies.
Those companies are: Apple, Amazon, Microsoft, and Alphabet.
These are the single most popular companies on the planet, with every fund manager, and even the Swiss National Bank loading up on them
Remove these companies from the market, and the markets are DOWN.
Why does this matter?
Because the fundamentals for these companies are rolling over. And the investment crowd will soon be running to the exits.
Take Apple.
Sales for Apple’s #1 product (the iPhone) began to decline a year ago. They’ve declined in THREE of the last four quarters on a Year Over Year basis.
Throughout this same time period, the company’s stock price has risen an astounding 75%.
So… Apple’s stock has risen 75%... during a time in which its #1 product is selling less... and its trailing twelve-month revenues are below its 2015 results.
And this company, (and a handful of others like it), is holding the entire market up!
We are literally back to how the market was in late 2007… or early 2000 depending on how you look at it.
We all remember how those situations ended.
We offer a FREE investment report outlining when the bubble will burst as well as what investments will pay out massive returns to investors when this happens. It"s called The Biggest Bubble of All Time (and three investment strategies to profit from it).
I had an opportunity to speak with the Fast Money crew on CNBC last night about the Nasdaq and following the interview I received a bunch of questions via twitter and email. There’s only so much you can pack into a 4-5 min segment so I wanted to briefly expand a bit on the reasoning behind my position.
In last night’s segment I called the Nasdaq a beast, but one we were interested in fading knowing we are within the confines of continued upside risk in markets as I outlined in the recent “Final Wave“. Seasonality is generally positive in April and markets tend to have a very solid month before turning more shaky into May.
So why the thought of fading “the beast”?
Firstly for reference here’s the full clip of last night’s show including the FM crew’s comments:
Firstly we talked about negative divergences. On the $NDX specifically we see recent new highs coming on lower relative strength, that’s a negative divergence:
I’ve drawn some basic fib retraces presuming current highs hold which we can’t be certain of, but it highlights the extent of the move since the November lows and how basically uncorrected it remains.
Why are negative divergences important? Because they signal underlying problems with a rally. In this case also note that new highs have continued to come with fewer and fewer of the $NDX components above their 50 day moving average:
As I also outlined previously tops are processes and take quite a while to play out whereas bottoms tend to be more likely to be events. Take a long term chart of the $SPX as an example:
I also mentioned negative divergences on the $NDX and its components on multiple time frames.
Here is a monthly chart for example and note the resistance against a multi year trend line:
Similar divergences can be noted in individual stocks:
In addition, I mentioned large scale disconnects from longer term moving averages that make a reconnect at some stage ever more likely.
Finally i mentioned the $VIX. The pattern I discussed recently on Trading Nation is still active and I highlighted the 2 recent tags of the 200MA and note the tag again yesterday:
Is it a reasonable expectation to presume that the $VIX will never close above its 200MA in 2017? Frankly no. We are already in the historically most compressed time period in recent history with valuations at the very high end and mega cap tech stocks technically vastly disconnected.
I’m not saying any of these companies mentioned are bad, or are doing badly. I’m not saying this at all. Nor am I saying a top is in. But what I am saying is that they are technically stretched, the index and many of these stocks are completely uncorrected and to a large degree probably over-owned. In short, they have been in beast mode and risk/reward is setting up for a sizable corrective move. Even a beast needs some rest at some point.
What happens after the first real $VIX spike, when we get it, will then determine whether this market can make new highs or not. If it can’t then we may embark on what I described the coming bear market.
Given how moderately many asset classes have performed since the highs almost 2 years ago in May of 2015 a rebalancing of pricing may pose a challenge for a wide array of narratives:
Banks and tech, for example, have done very well. Other sectors or indices are either kinda flat or very much challenged.
So far $SPX has made an all-time high at the beginning of March. Yesterday $NDX made a new high almost a month later. The last time we saw an $SPX peak followed by an $NDX peak almost a month later? 2007.
My take fwiw: Bulls need a new $SPX high in April or the beast may turn on them.