
1-year ago this month, the Transports/S&P 500 ratio peaked and has been heading lower, reflecting that Transports have been diverging against the broad market. Below looks at the performance of the S&P to Transportation ETF (IYT)-

CLICK ON CHART TO ENLARGE
The chart above highlights that IYT and underperformed the S&P 500 by nearly 10% in the past 12-months, with a good deal of underperformance taking place the past few weeks.
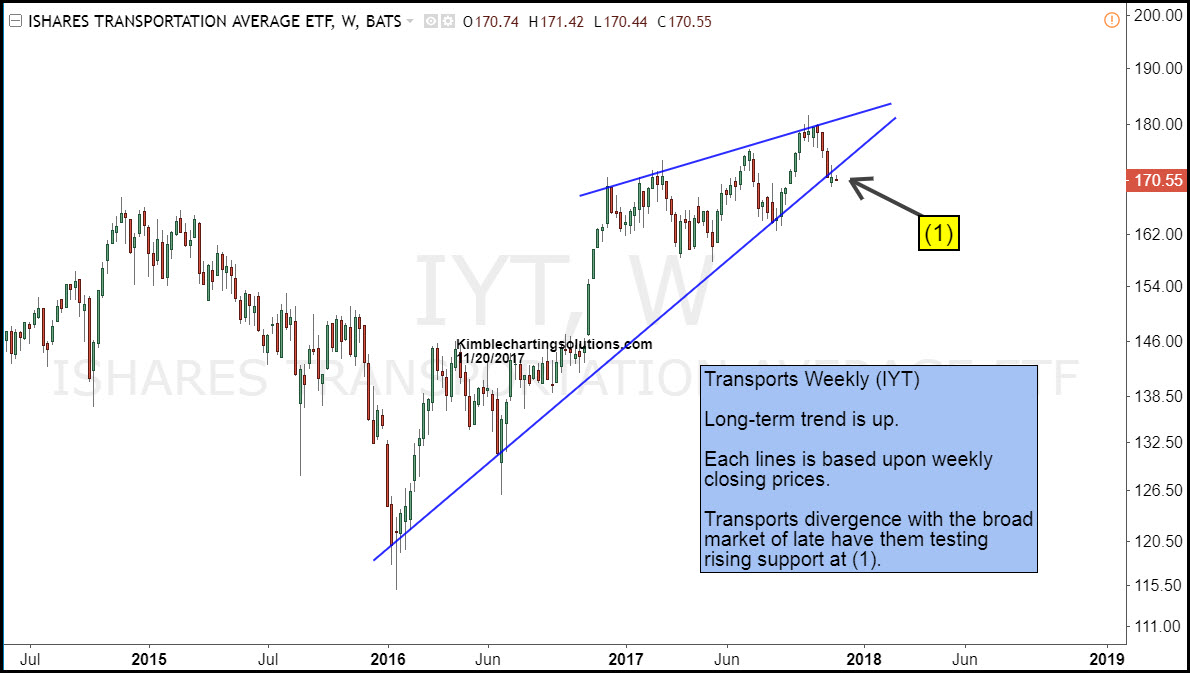
Below looks at the pattern of IYT over the past few years-
CLICK ON CHART TO ENLARGE
IYT is testing rising support, which could be a support test of a bearish rising wedge pattern. At this time the trend is up, despite the year-long divergence.
What IYT does at (1), could send an important ST message to the key sector. Sometimes in history, how this key sector does, can send an important message to the broad market.
We humbly feel what IYT does at (1), could end up sending an important intermediate message to the sector and the broad market.
Why you see chart pattern analysis with brief commentary:
There is a ton of news and opinions about markets and stocks that make
the decision-making process more difficult than it needs to be.
I believe the Power of the chart Pattern provides all you need to see what is taking place in an asset and
determine the action to take.
This approach
has worked well for me and our clients and I encourage you to test it for
yourself.
Send an email if you would like to see sample research and take me up on a trial of our Premium or Weekly Research where I provide actionable alerts on breakouts and reversals in broad market indices, sectors, commodities, the miners and select individual stocks
Email services@kimblechartingsolutions.com
Call us Toll free 877-721-7217 international 714-941-9381
Website: KIMBLECHARTINGSOLUTIONS.COM
Receive daily research I post on the blog each day


