Showing posts with label Investment management. Show all posts

Monday, November 6, 2017

Tech Stocks Accounted For 75% Of The Market"s October Return

For some context on the unprecedented dominance of the tech sector on the overall market, here is some perspective from BofA"s Savita Subramanian on October returns, when Tech continued to lead the other ten sectors, generating +7.8% on a total return basis. This translates into a whopping 75% of the S&P 500"s return last month!


Furthermore, with virtually every lagging hedge fund rushing to buy the tech sector, chasing such activist central banks as the SNB, the sector"s 24.5% weight in the S&P 500 is now the highest since October 2000.


That said, considering tech companies reported some of the strongest 3Q earnings results, the best revision trends, and rank at the top of BofA"s quant model, is there anything to be concerned about?


According to BofA, the biggest risk is the extreme crowding and positioning by fund managers. As Subramanian expains: "we hear frequently from clients, "you don"t want to sell Tech until year end." And funds certainly reflect this sentiment: Tech is the most overweighted sector by large cap active managers, displacing Discretionary whose relative weight dropped for the sixth consecutive month." As noted above, the recent Tech rally means the sector now represents 24% of the S&P 500 index - a post-tech bubble high - and a remarkable 30% of all active fund holdings today, the highest levels in BofA data history since 2008 (Chart 1).


What about other sectors: in addition to Tech, Utilities (+3.9%), Materials (+3.9%), and Financials (+2.9%) outperformed last month. Laggards were generally defensive: Telecom (-7.6%), Staples (-1.4%) and Health Care (-0.8%) underperformed the most, while Energy (-0.7%) was also in the red despite the rally in oil prices.


YTD, Tech maintains its dramatic lead (+37.2%), contributing just under half of the S&P 500"s 16.9% total return, followed by Materials (+20.3%) and Health Care (+19.4%). Telecom (-11.9%) and Energy (-7.2%) remain in the red.


To be sure, the impact of tech on underlying financial metrics is also staggering, as the following charts from Credit Suisse show: with tech, EBITDA margins are near all time high. Ex tech, they are roughly 3% lower and in secular decline, courtesy of high barriers to entry.


The next chart shows that while tech holds the highest share of S&P market cap, it is also the fastest growing sector.


And while the massive crowding in the tech sector is a red flag for Bank of America, for Credit Suisse this is perfectly normal, and in a report released today, its analyst Andrew Garthwaite writes that "many clients cite data indicating that just a handful of stocks (largely tech) account for almost half of returns. However, we don"t find such analysis to be particularly informative; such dynamics are far from unusual – in fact, it is often the case that a small number of stocks account for an outsized share of market gains, as shown in the chart below."


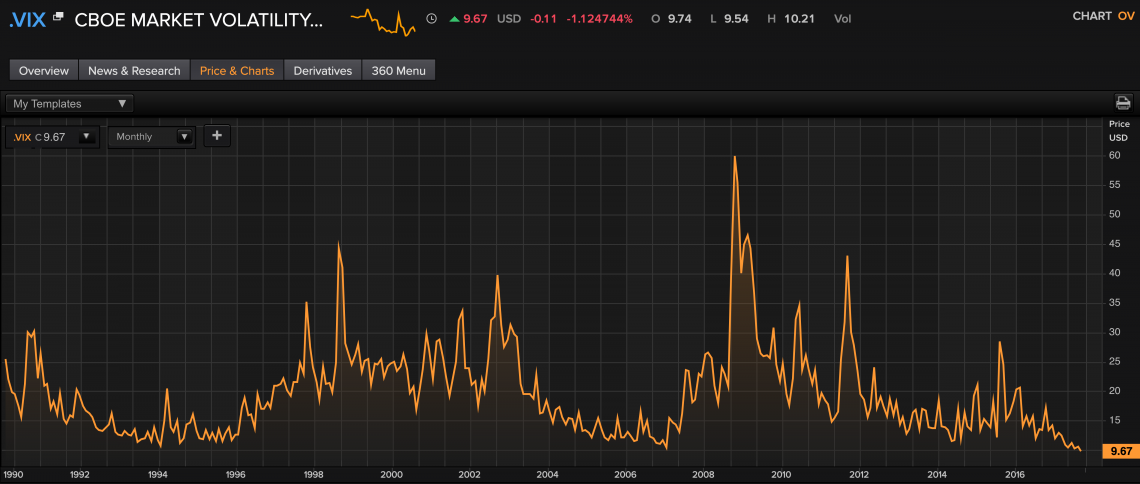
Of course, it is also that same small number of stocks that gets hammered once the tide reverses. For now, however, with vol at all time lows, traders have yet to express any concerns that the tremendous tech rally of 2017 is in dangers of ending. Ironically, the single biggest threat to the US tech sector may be the US government itself, which is starting to realize that it is leaving just a little too many pounds of flesh on the table...


Tuesday, October 10, 2017

Mapping The World's Trillion-Dollar Asset-Manager Club

In the late 1700s, it was the start of the battle of stock exchanges: in 1773, the London Stock Exchange was formed, and the New York Stock Exchange was formed just 19 years later.


And while London was a preferred destination for international finance at the time, Visual Capitalist"s Jeff Desjardins notes that England also had laws that restricted the formation of new joint-stock companies. The law was repealed in 1825, but by then it was already too late.


In the U.S., exchanges in New York City and Philadelphia took full advantage by dealing in stocks early on. Eventually, for this and a variety of other reasons, the NYSE emerged as the most dominant exchange in the world – helping propel New York and Wall Street to the center of finance.


THE CENTER OF FINANCE


Wall Street, and the U.S. in general, is now synonymous with finance – and most of the world’s largest banks, funds, and investors maintain a presence nearby. The biggest asset management companies, which pool investments into securities such as stocks and bonds on behalf of investors, are no exception to this.


Today’s chart shows all global companies with over $1 trillion in assets under management (AUM).


Not surprisingly, all but 17.1% of assets managed by this $1 Trillion Club are overseen by companies based in the United States.


Even further, outside of Northern Trust (Chicago), Pimco (Newport Beach), and Capital Group (Los Angeles), the remaining U.S. companies are based in the Northeast specifically – either on Wall Street, or just a short drive away.


THE NEWEST ENTRANT


The newest entrant to the $1 trillion club is Norway’s sovereign wealth fund, which is managed by Norges Bank Investment Management. It’s the world’s largest sovereign wealth fund, and it was “never forecast” to get so big.


The Norwegian fund recently joined France’s Amundi ($1.6 trillion), the UK’s Legal & General ($1.3 trillion), and Japan’s Goverment Pension Investment Fund ($1.2 trillion) as non-U.S. members of this exclusive club.

Tuesday, October 3, 2017

Hard Assets In An Age Of Negative Interest Rates

Time is the soul of money, the long-view - its immortality.


Hard assets are forever, even when destroyed by the cataclysms of history.


It is the outlook that perpetuated the most competent and powerful aristocracies in continental Europe, well up through World War I and, in certain prominent cases, beyond; it is the mindset that has sustained the most fiscally serious democratic republic in the Western world, that of Switzerland (as demonstrated in this article).


In this view, the stewardship of money, formerly known as “banking,” is a serious matter of serious wealth management and not a weird-science lab experiment of investment products ultimately designed for hedge fund managers’ tax arbitrage schemes.


More than ever the focus on hard assets is a dire call to arms given the deformed market culture of central banking monetary magic. Despite the early promise of the Trump presidency to reinvigorate the economy, the United States remains mired in economic stagnation built up over so many years of debt-driven policies, easy-money policies, and the ZIRP fiasco fostering a bizarre-world situation in which the actual economy is doing poorly while the market is soaring. In such an environment, the allure of the centuries’-old tried and true has never had more appeal.


In a word, the hard asset vision is about building wealth outside the stock market. It refers to three main strategies overall: 


1) land ownership and/or farmland, forestry and agriculture


2) gold, other precious metals, and certain base-metal commodities, and


3) The (Old Masters/Classic Modern) art market.


Where this last is concerned, we mean art as investment and not art-as-commerce, such as that which contaminates today’s insipid and overpriced world of ‘Balloon-Dog’ bad art. The auction world of Rembrandt and Picasso; of El Greco and Gerhardt Richter has been on a tear, is smashing records, and cannot be ignored as an excellent safe-haven vehicle, as outstanding works of art traditionally always have been.


To begin with, physical gold and precious metals remain an investment enigma despite being market-leading performers for the past seventeen years. Gold is a must-have portfolio asset amid the aggressive debt levels and monetary debasement that have so unhinged the market. Silver, for its part, in addition to its prestige status, also has innumerable industrial applications and throughout the precious-metal bull market since 2000.


Russia, in this context, is leading the charge in the long-view outlook. For the past three years, the Bank of Russia has been the world’s number one stacker of gold, and, thus far in 2017, has taken the lead position among international central banks in buying the commodity.


At its current pace, Moscow will unseat China for the number five spot of gold-holding nations by the first quarter of 2018.


Currently, the gold-to-GDP ratios of the world’s leading powers are: Russia 5.6%; the Euro Zone 3.6%; the U.S. 1.8% and China 1.5%.


Yet countries buying up gold versus investors who do so are two different worlds. Ninety-five percent of the world’s gold is held as a wealth store.


In other commodities, zinc and copper have been the big movers. Zinc, the key galvanizing agent, claimed the status of the best performing metal last year. Copper began its resurgence in 2017, and in late August of this year, a host of commodities broke out of multi-month consolidation patterns. Nickel and cobalt are also coming into the spotlight as metals essential to the rapidly growing lithium ion (Li-ion) battery sector.


The art world lags not too far behind that of precious metals in terms of history’s preferred storehouses of value as protection against uncertain times. Art as investment has long been a favored strategy of the European elite since, effectively, the High Middle Ages and has never gone out of style. In modern times, the phenomenon of an ever-growing collectors’ base and less supply of museum quality works has been accepted as a meaningful way to protect investors’ cash during economic difficulty. Though continually eclipsed in the media by the brasher contemporary art market, Old Masters (and Classic Modern—the great 20th century works) have shown stable, often spectacular, results over the past ten years with both categories reaching record-breaking highs.


Art, to be a safe haven, must be an investment and not a whim - just as it was for the Liechtenstein family who acquired Leonardo da Vinci’s Ginevra de Benci so many centuries ago. In the wake of the World War II near-bankruptcy of that eponymous principality (whose monarchs were not and are not supported by taxes), that painting was the first of the major, big-ticket art sales of the 20th century, when it was sold to Paul Mellon and The National Gallery of Art in Washington DC. Ginevra continues to hang there today (and to date, is the only Leonardo painting in possession of the United States).  While the average investor may not be in a position to store wealth in a Renaissance master or a Picasso, there are always the underrated gems or the new discoveries that can and will bring in the most unexpected of windfalls decades down the line.


Finally, farmland is seen by many as an excellent addition to a precious-metal portfolio. As Jim Rogers predicted in early September, fortunes will be made in agriculture “and when an industry breaks full faith, even mediocre people make a lot of money” in that sector. Hard asset investors continue to include farmland in their portfolios “for a combination of income generation, diversification and inflation-hedging”. Historically, farmland, like forestland in continental Europe or Latin America, has been a unique asset class demonstrating low-correlation to traditional asset classes, and which performs well as inflation rises.


Cash reserves, land as cash, the endless applications of Nature’s resources to industry; the prestige, privacy, and long-term value of beautiful art: such has been the outlook of the hard-asset philosophy.


Today, that cult of independently-minded investors will laugh all the way to the bank - precisely by avoiding the paths laid out, and so horribly deformed, by those very banks.

Thursday, September 28, 2017

Warning: Danger Lurks Here

By Chris at www.CapitalistExploits.at


Take a look at the volume of stocks listed vs. indexes listed going all the way back to the days of bellbottoms, loud hair, and orange wallpaper.


Since 1995, the supply of stocks, particularly in the US, has been shrinking faster than Trump"s approval ratings. At the same time, the number of indexes have exploded like one of Kim"s shiny new missiles.


Why?


In a falling interest rate environment, the twin pressures of reduced returns and relative cost pressures have meant that investors, in order to make a buck, have flooded into the low fee structures offered by passive strategies. These include indexing, ETFs, and those truly insane creatures I"ve written about before: low volatility ETFs.


But what about those alpha generating hedge funds? Aren"t they meant to be smart and able to beat the market... any market?


Those alpha generating hedge funds have things called LPs. And though LPs may be smarter, and certainly wealthier than Joe Sixpack, they"re no less human. And human attention span and patience level has been in decline... correlated no doubt with the rise of social media and the Kardashian crowd. Like a virus, it infects everything.


As performance from hedge funds has been poor relative to the benchmarks, a self reinforcing situation where hedge funds, in order to ensure LPs don"t redeem, have landed up hugging the indexes.


This is the exact opposite of what hedge funds were meant to do, of course. In many cases, they themselves are simply buying the indexes, trying desperately to figure out how the hell they"re going to survive through the next quarter but determined simply NOT to underperform the index. It"s a losing strategy no matter how you slice and dice it.


For those hedge funds who refuse to chase the indexes... Well, they are now fighting the tidal wave of capital that has been shifting into passive investments, which forces those passive investments even higher.


This, in turn, leaves active hedge funds who refuse to get sucked in with increasingly substandard returns. They can explain until they"re blue in the face why certain indexes make no sense but when those indexes just keep rising day after day, month after month, it becomes a very tough stance to keep. Redemptions follow, and so by doing the right thing, they"re punished. And by doing the wrong thing (following the mob), they may get to stay alive just a little longer and this is what many have resorted to.


We all know that at some point there are no new buyers available to enter the market and hoo boy, do we then have a problem.


So... you either join the party or you leave the party.


The last to leave the party is Hugh Hendry and his baby Eclectica.


Hugh Hendry Murders His Hedge Fund


Og aye, tis tae tough


Hugh follows Eton Park and Perry Capital to name but a few more.


Paul Singer of Elliot Management fame put it well in his July investor letter to stakeholders.


"In a passive investing world, small shareholders have little-to-no voice and no realistic possibility of banding together, while the biggest shareholders have no (repeat, no) skin in the game so long as the money manager does not underperform the index."


Make no mistake, the rise of passive indexing is a bubble in dumb money.


We have a situation where the market is becoming completely lopsided and increasingly so at a blistering pace.


If it gets anymore lopsided, it"s going to be upside down. What"s more, the market participants have no interest or even determination of valuations.


An index doesn"t give an isht what the P/E ratio of any stock included in the index is, and the investors buying it have even less idea. It doesn"t care if the aggregate of stocks sitting inside its womb are over or indeed undervalued. It"s just a dumb bloody index, and you can"t blame it anymore than I can blame my dog for not understanding Shakespeare.


Those investing in passive have done so partly due to relative fee differentials, partly due to performance. But now also dangerously so... due to increasing inflows, which have continued to push values higher.


Now, having markets or sectors get silly is obviously as normal as a peanut butter sandwich, and provided you"re aware of it, we"ve little to worry about.


But what"s more frightening than the Kardashians in skinny pants is that as capital has fed into passive, the usual countering forces (active managers) of the market have been leaving the party, which has left the passive world to increasingly swell like a neglected infected wound.


What we need to think about is that increasingly there is no active market to stabilise this. It"s akin to having a 5-year-old"s party, inviting a troop of the critters, and then promptly sending all the parents down to the pub for a few hours.


Just as short sellers provide a balance to a market so, too, active management (who incidentally typically have skin in the game) have always provided a stabiliser to the overall market. What happens when the stabilisers all leave the room?


We can see this manifesting itself in the volatility index. As more capital enters at a steady pace so, too, the volatility falls.


And here"s the thing. The algos constantly feed back the daily data to recalculate their probabilities (read this article on VAR shocks). Risk? Nah!


At the extreme of the passive world sits volatility.


Selling volatility works really well. Just ask Neiderhoffer who has made godawful amounts doing it over the years.


Look closely, though, and you notice that even Neiderhoffer, who knows what game he"s playing, blows himself up spectacularly from time to time... and I mean complete armageddon wipeout stuff. Until that blow up comes, though, you just keep plugging away at it day after day and it just keeps paying you... day after day. You make money, make money... and then, well...


It all turns to isht and blows up in your face.


My friend Mark Yusko from Morgan Creek Capital places capital with the smartest strategies and hedge funds - active capital.


Who"s willing to bet with me that over the next decade being long smart active strategies and short passive (low volatility ETFs) will be a winning trade?


Wow Poll - 27 Sep


Cast your vote here and also see what others think


- Chris


“What could be more advantageous in an intellectual contest – whether it be bridge, chess, or stock selection than to have opponents who have been taught that thinking is a waste of energy?” – Warren Buffett, 1985 Berkshire Hathaway Letter to Shareholders


--------------------------------------


Liked this article? Then you"ll probably like my other missives on


this topic as well. Go here to access them (free, of course).


--------------------------------------

Wednesday, September 20, 2017

Norway Wealth Fund Assets Surge To Over $1 Trillion On Massive 70% Allocation To Equities

Last December we joked that the Norwegian sovereign wealth fund had responded to sinking returns and withdrawals required to fund budget deficits by allocating another $130 billion in assets to what appeared to be an already massively overpriced equity bubble in return for an extra 40bps of "expected average annual real returns." (see: Norway Buying $130 Billion In Global Equities As Sovereign Wealth Fund Continues To Bleed Cash).  The extra equity purchases pushed the fund"s total equity allocation to a staggering 70% of their $860 billion in assets under management. 


After being forced to withdraw at least $15 billion to fund 2017 budget deficits, the $860 billion Norwegian sovereign wealth fund has announced that it will change it"s portfolio allocations to try to make up the difference.  The change will result in 75% of the fund"s capital being allocated to global equities, up from the current 60%.  Sure, because funneling another $130 billion to the global equity bubble is just the prudent thing to do for an extra 40bps of "expected average annual real returns."


The central bank’s board, which oversees the fund, on Thursday recommended an increase in the equity share to 70 percent from 60 percent. That will raise the expected average annual real return to 2.5 percent over 10 years and to 3.5 percent over 30 years, compared with 2.1 percent and 2.6 percent, respectively, under the current setup.


The world’s largest sovereign wealth fund said that it expects an annual return of only 0.25 percent on bonds over the next decade and that the expected “equity risk premium,” or return on stocks over government bonds, will be just 3 percentage points in a cautious estimate.


“In our analyses, this is clearly evident in global data: internationally, growth in firms’ cash flows and equity returns are correlated with growth in the global economy,” Deputy Governor Egil Matsen said in a speech Thursday in Oslo. “Global economic growth in the coming years is expected to be below its historical level. This ‘pessimism’ is partly related to the driving forces behind the low level of the real interest rate.”


Alas, with global equity bubbles becoming ever more bubblier with each passing day, the bet on equities has paid off "bigly" for Norway and pushed their AUM to over $1 trillion for the first time ever.  Per Bloomberg:


Norway’s sovereign wealth fund hit $1 trillion for the first time on Tuesday, driven higher by climbing stock markets and a weaker U.S. dollar.


The milestone valuation was reached for the first time on Sept. 19 at 2:01 a.m. in Oslo, Norges Bank Investment Management said in a statement on Tuesday.


“I don’t think anyone expected the fund to ever reach $1 trillion when the first transfer of oil revenue was made in May 1996,” Yngve Slyngstad, chief executive officer of the fund, said in the statement. “Reaching $1 trillion is a milestone, and the growth in the fund’s market value has been stunning.”


Meanwhile, the fund"s record AUM comes despite taking withdrawals for the first time ever in 2016 and expectations that another 70 billion kroner will be withdrawn this year to help offset budget deficits.


Norway’s government last year made direct withdrawals from the fund for the first time in its history and is expected to take out about 70 billion kroner this year. Meanwhile, Norway has lowered the fund’s expected return to 3 percent from 4 percent.


The fund has been given permission to raise its stock holdings to 70 percent from 60 percent, with an equivalent cut in bonds. That could help it eke out higher returns, or at least maintain the 8 percent annualized real return it’s had over the past five years.


But Slyngstad also recently said he sees fundamental issues with the global economic system and trade, which is being buffeted by increasing global political risk. And that’s not good for a fund that owns 1.3 percent of global stocks.


So, it appears that Norway"s reckless equity bet has paid off for now...but, what is the saying about "he who laughs last?"


Thursday, August 31, 2017

Mo' Momo, Mo' Worries - Quants Fear Hedge Funds' "Outsized Exposure" To Market Momentum

Better lucky that smart? Managers of active funds are now extremely concentrated in the strongest parts of the US equity market with "momentum" massively outperforming the market in August (and ramping higher off the North Korea missile launch lows).


Bloomberg"s Dani Burger notes that with more than half of their bets on high flyers like technology and online retailers, hedge funds have near-record exposure to momentum trades, a strategy that’s up 2.6 percent in August even as the S&P 500 heads for its worst month since the election. The resiliency of the bet was on display Tuesday, when Alphabet and Amazon opened nearly 1% lower before rebounding along with Apple to deliver the S&P 500’s biggest intraday reversal in 10 months.


“It’s like these things are like gold -- it’s almost like a safe haven,” said Mark Connors, the global head of risk advisory at Credit Suisse Group AG.


“This resilient price action in equities is commensurate with the constructive positioning we see across hedge fund strategies and speaks to the persistent positive sentiment in 2017.”


The much-followed FANG Stocks soared over 2.1% off the opening lows...


The 50 most popular hedge fund longs...


Bloomberg"s Burger asks, how long can it last?


That"s a question that’s becoming more urgent for hedge funds that have finally caught up to a market where gains are delivered by an ever-narrowing cohort of stocks. Volatility has been rising amid renewed geopolitical tensions, signs of uneven economic growth in the U.S. and the threat of further interest-rate hikes by the Federal Reserve.


What’s more, the very nature of following momentum poses its own pitfalls. The strategy is one of the more volatile factors, and when rotations occur, pain seeps through as leaders quickly move to the back of the pack.


All that points to a hedge fund love affair that’s headed for heartbreak, according to Joseph Mezrich, head of U.S. quantitative analysis at Nomura Instinet LLC.


“We are concerned about this outsized exposure,” Mezrich, wrote in a note to clients. “The last time momentum exposure was this high was in 2013-2014, which led to a sharp decline in fund performance when momentum collapsed. Fund managers may be setting themselves up for a repeat.”


So what happens next? We leave to CS" Mark Connors...


"You can’t manage your book for a big deleveraging... Momentum is an escalator up and an elevator shaft on the way down. But managing that is what active managers do for a living.”


Sunday, August 27, 2017

Matt King: Global QE And "ETFs Everywhere" Have Created An Unstable, One-Way Market

While the financial industry remains divided over what precisely is the cause of the malaise that affects modern markets, characterized by plunging volumes and trading activity, record low volatility and dispersion, a relentless ascent disconnected from fundamentals, and generally a sense of foreboding doom, manifested by an all time high OMT skew - or record high price for crash insurance - as discussed previously...


... it can agree on one thing: it has something to do with the interplay of QE, the artificial force that has disconnected market prices from values for the past 8 years, and ETFs, which as some prominent investors have said are "devouring capitalism." They also agree that the combination of QE and ETFs have made the market almost entirely "one-sided", and thus prone to collapse when conditions finally reverse.


Indeed, as Citi"s Matt King - our favorite sellside cross-asset strategist - writes in his latest report, a growing number of institutional managers, from Oaktree to Elliott to  Bridgewater, have recently been expressing concerns not only about elevated valuations and the potential for a correction, but in many cases also about the potential for herding and the risk that markets have grown one-sided."


King points out a trend observed among the financial literature over the past 2-3 years (starting with Howard Marks" March 2015 note in which he asked, rhetorically "What Would Happen If ETF Holders Sold All At Once? Howard Marks Explains"), "everyone’s number-one suspect in potentially creating such a tendency seems to be ETFs. In Paul Singer’s memorable words, passive investment through the likes of ETFs “is unsustainable and brittle” and “is in danger of devouring capitalism”.


But are ETFs really to blame, King wonders, or simply a symptom of some other underlying tendency? His answer is the latter, and begins with an explanation we have shown many times on this website: the relentless shift away from active to passive management:


It’s easy to see why active managers are complaining. Over the past ten years, the cumulative inflow to US HY mutual funds is precisely zero, while HY ETFs have netted $40bn. In US IG, where inflows have been stronger, more than a quarter of the money over the past decade has gone to ETFs; in EM FI in recent years, the proportion is more like one-third. For European credit, ETF outstandings may look far smaller, and yet these belie the true size of the threat since (unlike the US) most trading occurs OTC and hence goes unrecorded. All of these are nothing compared to the massive rotational shift being seen in equities, in which around $500bn has flowed away from active managers and into ETFs over the past 12 months alone, and where ETFs now account for over one-quarter of markets’ traded volume.


It"s not just investors who are worried about ETF flows: regulators are too, having become "alarmed at the dramatic growth in ETFs, focusing in particular on the potential for a sudden reversal, notwithstanding ETF managers’ robust defence that ETFs’ potential to trade at a discount to NAV gives them an additional escape valve relative to traditional open-ended mutual funds."


But, as King shows in the following chart, there is a puzzle here, or rather a pair of them. "Rather than being the fickle retail fad of the popular imagination, ETF flows have actually proved much more stable than mutual fund flows (Figure 1). Either the potential for a future reversal is far greater than anything seen in the historical data, or the problem is not unique to ETFs."


Furthermore, it is odd for fund managers - professional investors trained to capture market short and long-term  market inefficiencies - to be complaining about something which in principle should be creating additional opportunities for them.Here King makes an absolutely spot on point about inefficient markets, which however we have to note, is only relevant inasmuch as central banks don"t do everything in their power to perpetuate the inefficiencies, now in their 9th year:


Indiscriminate buying and selling by ETFs should add to the potential for active managers to spot mispriced securities. The greater the proportion of trading done by passive entities, the greater should be the opportunities.


So are fund managers simply suffering from a case of sour grapes, King asks, "or is there some other factor preventing these opportunities from occurring in the way theory says they should be?"


His answer for why the current market regime has made active investors a species facing extinction, is due to two things: record low volatility and record low dispersion:


The obvious culprit is the lack of volatility. Our Cross-Asset Volatility Indices show that realized volatility now stands at multi-decade lows in every major asset class bar FX (Figure 2). But even worse for active managers is the lack of dispersion. A manager can still make money when markets themselves are involatile provided there is sufficient variation in the performance of individual securities. Dispersion, or the cross-sectional standard deviation, effectively captures how much a manager with perfect  foresight could have made by overweighting the best performing securities or sectors and


underweighting the worst performers. Dispersion in both credit and equities is now at the lowest levels on record.


As Citi points out, this lack of potential for outperformance might seem surprising on the back of obvious single-name sell-offs like Teva or Provident Financial. However as he explains, "these names have been too small to offer much outperformance potential: even managers who had zero-weighted them prior to the sell-offs would only have increased total returns by 1.4bp with Teva in € and 1.3bp with Provident in £ respectively. To outperform, managers need there to be multiple names moving in opposite directions – to have, if you like, a genuine two-way market. The only market which has come close to this description in recent years is the only one where volatility is not making new record lows: FX. Is this a coincidence, or a feature?"


King then reverts back to this key point: the confluence of QE and ETFs have led to one-way markets, in which the main feature is investor clustering, and herding: "for us, the real damage in markets in recent years is an increase in herding. ETFs are contributing to this tendency but they are not its primary driver."


The result is an increasingly illiquid market: "What we think has been happening in recent years is that investors are displaying an increased tendency to position themselves the same way round. In the process we are therefore losing the heterogeneity which is the source of a liquid market. This tendency is likely to have been strongest in the markets where the price action has largely been one-way. With the notable exception of markets with currency pegs, FX has some built-in protection against this because its securities automatically have two sides. Thanks to the fragmented nature of trading and the large role carry plays in driving returns, credit is particularly vulnerable."


Of course, it"s not just the shift to passive investing that is forcing active investors to group together for their very survivla: other factors are also exacerbating this trend.


"The combination of global credit growth and QE has created such a sustained bull market in many asset classes that investors are inevitably concluding that their best trade is simply to close their eyes and go long the market in the cheapest way possible. ETFs in principle offer a panoply of potentially uncorrelated factors, but in practice trading volumes have been overwhelmingly concentrated on the major indices. The rise of algorithmic trading and regulators’ increased tendency to insist on marking to market likewise build in a short-termism which is likely to be self-reinforcing. Whatever factor or trade has been doing well is likely to receive inflows; whatever has been doing poorly will be shifted away from."


Which brings us to the conclusion: whether QE is the driving force behind ETF-mediate herding, or some different factor is responsible, the trouble with one-way markets is that they are not really one-way, and as Citi"s King warns "wooner or later the herd turns around. This creates a risk that current record lows in volatility are misleading."


Here King points out something we brought to readers" attention last week when we showed the record high cost of market crash insurance: "To some extent this is reflected in high levels of OTM skew, but conceivably not enough given the potential for asymmetry."


The problem, according to Citi - and certainly central bankers who however will never admit this in public - is that when the herd has been moving in one direction for long enough, it becomes hard to envisage what might turn it around. For credit  investors, the “buy on dips” mentality has become deeply entrenched – even if the justification for doing so is never valuations, and always “the strength of technicals".


Typically these are attributed to some sort of irresistible but poorly understood external force, such as mutual fund inflows (in IG, but interestingly not HY at present) or “the strength of the Asian bid”. Rather like the blurb from a London estate agent which recently landed in my letter box, investors are urged to buy precisely because prices have gone up so much: the idea that the demand which led to those price rises might one day reverse is unthinkable.


Still, despite the "fake markets" of the past 8 years, in which every dip has so far been bought - profitably - Citi says that investors should be thinking about such reversals, preferably before they actually occur.


Will mutual fund inflows always remain strong even as deposit rates rise? Will Japanese investors’ bid for US credit remain as intense even as reduced BoJ purchases mean private investors have to absorb more net supply in JGBs, or are there signs that is fading already. In particular, what is the potential for abrupt discontinuities on this front?


The answer, according to King, very high, but "to say that this or that threshold is automatically a danger" is not the point: Citi"s punchline is that increases in herding, or equivalently a reduction in the diversity of the investor ecosystem, create large asymmetries which are in themselves a threat to financial stability – whether or not they are accompanied by financial leverage, something which not even Fed presidents can grasp.


And yet, while King can warn until he is blue in the face, the reality for an entire generation of "investors" in artifical markets is that no matter what happened, risk assets would keep going up, as did mutual funds and ETFs. That may change soon: King looks at fund flows among equity and debt (IG and HY) fund flows, and calculates that the standard deviations and maximum moves, are much larger for outflows than for inflows – modestly so in some cases, shockingly so for equities.


Even if ETF flows have not shown this tendency to date, there is every reason to think that both ETF and mutual fund flows will exhibit these characteristics in future. One-way markets trend for extended periods with very little volatility, but are then vulnerable to abrupt turnarounds.


All of the above leads King to an ironic conclusion, one which we have discussed previously and which we will comment on more shortly, namely that in this fake market, the one thing that can potentially save the active management community, is a reversal, or as King puts it, "paradoxically, the very thing required to save active managers is a reversal of the conditions which gave rise to their tremendous growth in the first place."


Namely, a crash. Unfortunately, with central banks more concerned than ever that markets can simply no longer function on their own without daily central bank support, a crash, or even a correction, may not happen... or rather when it does, trading would simply shut down as this "one-way market" can no longer even discount such a simple alternative outcome as "selling."

Tuesday, August 22, 2017

Cryptocurrency Hedge Fund Returns 2,129% YTD

We"ll preface this post by saying we have never heard of the Alternative Money Fund - which "Specializes in Returning Freedom and Value" - and very well may never hear of it again, however it is notable for two things: i) it is a "hedge fund" invested entirely in cryptocurrencies and ii) it has allegedly generated a 2,129% return YTD, making it the best performer in hedgeco"s ranking of asset managers YTD.


The "fund"s" own description is similar to what one would find in any traditional asset manager, with one exception of course: it does not invest in traditional securities at all, only cryptos:


  • 30 or so names in the portfolio

  • discretionary, not systematic

  • technically driven bottom-up, primary.

  • fundamental research, secondary

  • performance not directly correlated to the price of bitcoin. Good addition for Bitcoin holders.

It also writes that it is "committed to provide exceptional returns through an actively managed portfolio of blockchain assets. With the emergence of Bitcoin, Altcoins and this exciting new technology has created a new asset class for investors." The fund also notes that its "trading strategy does NOT use leverage or margin. Returns are reported monthly and capital accounts may be increased or redeemed each month."


So far so good; when one reads further in, some "lingo" red flags start to emerge:


The volatility associated with the cryptographic verification and game theoretic equilibrium, these blockchain-based digital assets create valuable opportunities in an actively traded portfolio.


Hmm, "cryptographic verification and game theoretic equilibrium" may sound exciting but it"s what one would say when scrambling for sophisticated words to sound intelligent, in other words what Fed presidents do every single day.


Reading through the full presentation reveals much more such language (which probably would be a sufficient red flag) although the most remarkable feature of the fund, as noted, is its performance.


Through August, the fund claims to be up 2,129%. That puts it at the top of hedgeco.net"s 2017 league table.


Its holdings:


Back to the red flags: this is how the fund defines its marketing:


  • Marketing is done by word of mouth, internet, hedge fund databases, 3rd party marketers, and other sources. 

  • Distribution of the marketing material will be done by face-to-face meetings with potential investors and funds. Mail-outs, business cards and phone calls to friends and family and others will also be done.

  • We are not planning on getting too aggressive with this plan, more organic growth is desired.

  • The managing member very active on: Facebook, Angellist, Instagram, Medium, Twitter, and more

  • Customized email from altmoneyfund.com, business cards, etc.

  • Returns will be posted on the Hedgefund Indices

Red flags aside, we wonder how long before many more such "hedge funds" crop up, all having generated returns (whether real or fabricated) that traditional hedge funds can only dreams of, and how long before the more naive elements in the investing community rush to flood them with capital in hopes of "getting rich quick" with 4 digit annual returns, creating yet another ponzi active asset manager bubble even as traditional long/short and numerous other legacy investors, struggling to outperform the S&P, slowly disappear?


The fund"s "presentation materials" for those curious are below, and the good news for the overly gullible: as the fund notes, "currently there are no fees for the first
$500k under management"

Tuesday, August 15, 2017

This Is The Most Equity-Bullish Chart We've Seen Yet

How expensive are US equities versus their peers around the world? Compared to bonds? Commodities? Are there fundamental risks we can identify?


In the following presentation, Cantillon Consulting"s Sean Corrigan answers all of the above and details what opportunities for better asset allocation might lie ahead...


Howver, deep in the presentation is an intriguing little chart.


As Sean Corrigan explains, if we superimpose the pattern of US Stock-to-Corporate Bond relative value from World War I to the end of World War II on the post-Berlin Wall data, we get a near-perfect overlap with the Crash of "29 corresponding to the Tech bust and the "37 slump to the Great Financial Crisis.


Were the somewhat spooky parallels to continue, 2020 would usher in a two-decade, 13% CAR stock outperformance over corporate bonds as enjoyed during the 50s and 60s.


Which, as Corrigan concludes, would be something to behold... and is probably the most bullish equity market analog we have seen yet.

Wednesday, August 2, 2017

How Passive Investing Distorts Earnings Season

In a spirited defense of today"s inefficient market, one which is allegedly unimpaired by the relentless metastasis of passive investing, Bloomberg wrote an article using Macro Risk Advisors data, in which it said that "for all the handwringing about how the growth of passive investing strategies is distorting the stock market" it concluded that "there’s virtually no market impact from it. Correlations remain at all-time lows and the amount of shares that are passively managed isn’t affecting single-stock."


Conventional wisdom has held that as passive investment strategies accumulate larger piles of assets under management -- the 14 percent represents an all-time high -- it would lead to lockstep moves in stocks, making life harder for traders seeking informational edges by offering fewer opportunities to capitalize on insights into earnings and other signals. Instead, the MRA data show, that any reaction in the market has been muted -- if there’s even been one at all.


Bloomberg was referring to these three familiar charts, showing the acute fund flow from passive to active strategies in recent years.


Unfortunately for defenders of the ETF boom, Bloomberg"s assessment is also wrong, because in a separate analysis released concurrently by Bank of America, Savita Subramanian reached just the opposite coinclusion.


BofA looked at the response of stocks which missed EPS estimates, and found two dramatically different outcomes for stocks with high vs low passive ownership. This is how she describes her findings:


Not only can crowding by active managers suggest risk to stocks, but high-passive ownership can matter, particularly during earnings season. Over the past seven quarters (including the 2Q earnings season so far), stocks with high passive ownership that missed on EPS and sales have underperformed those with low passive ownership by 1.5ppt on average during the following day, and the spread has widened significantly during recent quarters. This increased performance spread may be attributable, in part, to lower "true float" in these stocks, which appears to have driven increased volatility.


The increasingly disproportionate adverse reaction of high passive ownership stocks is shown in the chart below: it is most evident in Q2 2017 earnings.


The recent trend of stocks to have a materially more pronounced negative response to earnings misses has been discussed previously, however until now there was no quantifiable explanation.


BofA"s take, which can easily be tested for validation purposes, presents various arbitrage opportunities chief among which is creating a basket of high passive ownership stocks, and betting on sharp declines either through single-name short positions or puts while avoiding low passive ownership names, with expectations of this skewed return profile. One potential hurdle is that this earnings season - which is as of now 66% complete - companies that miss have been relatively few, although if this pattern persists, it should provide significant alpha opportunities during the Q3 earnings season, when the overall quality of earnings is expected to decline substantially as the base effect of last year worst quarter will be in the rearview mirror, while the much anticipated surge in energy earnings will have trouble materializing if oil fails to trade solidly in the mid-$50 range, not to mention the risk of either inflation finally creeping higher or the Fed following through with its balance sheet unwind promise.

Tuesday, July 4, 2017

The "Big Lie" Of Market Indexes

Authored by Lance Roberts via RealInvestmentAdvice.com,


Last week, I received the following email from a reader which I thought was worth further discussion.


“In a recent article “Signs of Excess – Crowding and Innovation” Lance stated ‘Note the chart above is what has happened to a $100,000 investment in the S&P Index. While the S&P index has soared past previous highs, a $100,000 dollar investment has just recently gotten back to even. This demonstrates the important difference about the impact of losses on a dollar-based portfolio on investments versus a market-cap weighted phantom index.” – M. Fitzpatrick


It’s a great question.


Almost daily there is an article touting the soaring “bull market” which is currently hovering near its highest levels in history. The chart below is based on quarterly data back to 1990 and is nominal (not adjusted for inflation) which is how it is normally presented to investors.


The Big Lie


The “Big Lie” is that you can “beat an index” over an extended period of time.


You can’t, ever.


Let me explain.


While individuals are inundated with a plethora of opinions on why the index is moving up or down from one day to the next, a portfolio of dollars invested in the market is vastly different than the index itself. I have pointed out the problems of benchmarking previously stating:


  1. The index contains no cash

  2. It has no life expectancy requirements – but you do.

  3. It does not have to compensate for distributions to meet living requirements – but you do.

  4. It requires you to take on excess risk (potential for loss) in order to obtain equivalent performance – this is fine on the way up, but not on the way down.

  5. It has no taxes, costs or other expenses associated with it – but you do.

  6. It has the ability to substitute at no penalty – but you don’t.

  7. It benefits from share buybacks – but you don’t.

Furthermore, it is also not representative what happens to real dollars invested in the financial markets which are impacted by changes in inflation. The chart below compares the break even times for the nominal index versus an inflation-adjusted index and $100,000 investment into the index.


You will notice in the $100,000 portfolio that investors, once the impact of inflation is added, just got back to even after 16-years of their investment time horizon was lost. The problem with that, as I noted in “The World’s Second Most Deceptive Chart” is the impact of life expectancy on reaching investment goals. To wit:


“For consistency from last week’s article, we will assume the average starting investment age is 35. We will also assume the holding period for stocks is equal to the life expectancy less the starting age. The chart below shows the calculation of total life expectancy (based on the average of males and females) from 1900-present, the average starting age of 35, and the resulting years until death. I have also overlaid the rolling average of the 20-year total, real returns and valuations.”


Here is what you should take away from the two graphs above. Assuming that an individual was 35 at the peak of “Dot.com” bubble, they are now 51 years of age and are no closer to their goals than they were 16 years ago. Assuming they will retire at 65, this leaves precious little time to reach their retirement goals. 


Of course, this is repeatedly proved out in survey after survey which shows a majority of Americans are woefully behind in their savings goals for retirement.


Of course, this is due to one of the most egregious investing “myths” in the financial world today:


The power of compounding is the most powerful force in investing.” 


Markets Don’t Compound 


There is a massive difference between AVERAGE and ACTUAL returns on invested capital. The impact of losses, in any given year, destroys the annualized “compounding” effect of money.


The chart below shows the impact of losses on a portfolio as compared to the commonly perceived myth that investors “average 8%” annually in the stock market.


As you can see, while investors did finally get back to even by just “buying and holding” their investments, they are far short of the goals they needed to achieve financial security. The problem is due to the fact we “anchor” to our original “peak investment valuation” rather than our ultimate goal.


However, let’s take this one step further and look at a $1000 investment for each peak and trough valuation period with the assumption of a real, total return holding period until death based on life expectancy tables. No withdrawals were ever made. (Note: the periods from 1983 forward are still running as the investable life expectancy span is 40-plus years.)


The gold sloping line is the “promise” of 6% annualized compound returns. The blue line is what actually happened with invested capital from 35 years of age until death, with the bar chart at the bottom of each period showing the surplus or shortfall of the goal of 6% annualized returns.


Again, in every single case, at the point of death, the invested capital is short of the promised goal.


The difference between “close” to goal, and not, was the starting valuation level when investments were made.


This is why, as I discussed in “The Fatal Flaws In Your Retirement Plan,” that you must compensate for both starting period valuations and variability in returns when making future return assumptions. If you calculate your retirement plan using a 6% compounded growth rates (much less 8% or 10%) you WILL fall short of your goals. 


Hang On…That’s Not The End Of Story


There is one more calculation that needs to be accounted for that is too often left out of the “just buy an index because you can’t beat the index” meme.


Let me just state again, as noted above, NO ONE can beat an arbitrary, hypothetical, index. PERIOD.


Why?


Because of inflation, taxes, and expenses.


The chart below once again returns us to our $100,000 invested into the nominal index versus a $100,000 portfolio adjusted for “reality.”


$100,000 invested in 1998 has had a compounded annual growth rate of 6.72% on a nominal basis as compared to just a 4.39% rate when adjusted for reality. The numbers are far worse if you started in 2000 or 2008.


Furthermore, both numbers also fall far short of the promised 8% annualized rates of return often promised by the mainstream analysts promising riches if you just buy their investment product or service and hang on long enough.


The reality is, as proven repeatedly over time, such an outcome will likely prove to be extremely disappointing.


In order to win the long-term investing game, your portfolio should be built around the things that matter most to you.


– Capital preservation


– A rate of return sufficient to keep pace with the rate of inflation.


– Expectations based on realistic objectives.  (The market does not compound at 8%, 6% or 4%)


– Higher rates of return require an exponential increase in the underlying risk profile.  This tends to not work out well.


– You can replace lost capital – but you can’t replace lost time.  Time is a precious commodity that you cannot afford to waste.


– Portfolios are time-frame specific.  If you have a 5-years to retirement but build a portfolio with a 20-year time horizon (taking on more risk) the results will likely be disastrous.


As I wrote previously:


The index is a mythical creature, like the Unicorn, and chasing it takes your focus off of what is most important – your money and your specific goals. Investing is not a competition and, as history shows, there are horrid consequences for treating it as such.”


So, do yourself a favor and forget about what the benchmark index does from one day to the next. Focus instead on matching your portfolio to your own personal goals, objectives, and time frames. In the long run, you may not beat the index but you are likely to achieve your own personal goals.


But isn’t that why you invested in the first place?

Monday, April 17, 2017

Dear Hedge Funds: This Is Who Is Responsible For Your Deplorable Returns

Over the past several years we have repeatedly stated that despite protests to the contrary, the single biggest factor explaining the underperformance of the active community in general, and hedge funds in particular, has been the ubiquitous influence of the Fed and other central banks over the capital markets. 


Specifically, back in October 2015, we wrote that "as central planning has dominated every piece of fundamental news, and as capital flows trump actual underlying data (usually in an inverse way, with negative economic news leading to surging markets), the conventional asset management game has been turned on its head. We have said this every single year for the past 7, and we are confident that as long as the Fed and central banks double as Chief Risk Officers for the market, "hedge" funds will be on an accelerated path to extinction, quite simply because in a world where a central banker"s money printer is the best and only "hedge" (for now), there is no reason to fear capital loss - after all the bigger the drop, the greater the expected central bank response according to classical Pavlovian conditioning."


Several years later, Goldman Sachs confirms that we were correct.


In a note released overnight by Goldman"s Robert Boroujerdi titled "An Rx for Active Management" and which seeks to explain the now chronic underperformance of the "smart money", the Goldman analyst says he has identified two key considerations impacting the performance of actively managed equity funds including 1) the nature of market regimes and 2) behavioral tendencies of portfolio managers.


Among the various considerations described by Goldman, both market and behavioral, chief among which the observation that alpha is cyclical and that "there have been 4 distinct alpha cycles since 1990, with prior periods of persistent alpha (1990-94; 2000-09) each followed by a respective period of underperformance (1995-99; 2010-2016)"...


... the smoking gun in the report was the admission that "QE has been a headwind… Low Rates, Low Vol, Low Dispersion -> Low Alpha."


And the punchline: in a slide titled "A word on QE: Does Active Have A QE Hangover", the simple answer is: yes.


He makes three main points:  


1. The current run of active manager underperformance began shortly after the onset of QE (see top-left exhibit).


2. QE drove real interest rates lower (measured by the yield on 10yr TIPS). This trend towards 0%, and even negative, real rates coincided with the shift from active outperformance to underperformance (see bottom-left exhibit).


3. Equity market dispersion and volatility, both key drivers of manager tracking error and excess returns, have remained stubbornly low throughout QE and served as headwinds for manager performance (see bottom-right exhibit).


The slide in full:


Ironically, it has been the hedge fund community which during the current decade has been among the most vocal supporters of first Bernanke and then Yellen, and QE in general. Meanwhile, as central banks "saved" markets, they unleashed the passive, ETF revolution which is the real "great rotation", as every weeks sees tens of billions in funds shifted from hedge funds and other active managers to low-cost passive alternatives.


What can fix this abnormal market state? Here the answer is also straightforward: a market crash.


As Goldman shows, active investing lags in up markets and outperforms but only in down markets:


  • Market upside vs. downside capture for actively managed mutual funds is not symmetric.

  • In “up markets” (SPX 1-month return +2% or more), the median active manager underperforms the market by approximately 20bps, on average.

  • However, in “down markets” (SPX -2% or more), actively managed funds have outperformed their benchmark by nearly 40bps, on average.

  • In the two most significant drawdowns since 1990 (Sept. 2000 – Sept. 2002) and (Nov 2007 – Feb 2009), the median long-only active manager was able to cushion downside and outperform the market.


Which brings us to a conclusion we have stated repeatedly on many previous occasions: while hedge funds, especially established ones with significant AUM, find the current status quo relatively comfortable - after all they get to clip their management fees year after year (forget the "performance" upside), extrapolating current trends in central-bank dominated markets would eventually lead to "active" extinction, and the complete domination of ETF-based and other low-cost passive strategies. Furthermore, taken to its thought experiment extreme, a situation in which there is only passive management would guarantee that the next market crash would be truly unprecedented with few hedge funds there to hunt for bargains.


Ironically, the only event that can break this sequence of events would be a market crash, one which finally ends the current pernicious equilibrium and resets the capital markets. For that to happen however, both the Yellen and now Trump put would have to be eliminated. And that, as the past 8 years have shown, is easier said than done. For the sake of hedge funds and their dwindling assets under management, however, they better fund a way and soon.


Saturday, April 1, 2017

Prepare For "Manias, Panics And Crashes": An Ominous Warning From Bank Of America

Bank of America"s Michael Hartnett is back with another controversial note overnight, reminding readers that "it ain"t a normal cycle" for one overarching reason: central banks.


As Hartnett explains, the catalyst for bull in equity and credit markets since 2009 was the "revolutionary monetary policy of central banks" who, since Lehman, "have cut rates 679 times and bought $14.2tn of financial assets." And, once again, he warns that this central bank “liquidity supernova” is coming to an end, as is "the period of excess returns in equities and corporate bonds, as is the period of suppressed volatility."


With an entire generation of traders having grown up "trading" in centrally-planned markets, few can make sense of the fundamentals that accompany the market. As a result, Harnett writes that "risk markets continue to climb a wall of worry, defying bearish structural trends in the financial industry, taunting skittish skeptics by paraphrasing Margaret Thatcher…”You turn if you want to. The market’s not for turning.”


Demonstrating how insane just the past year has been in markets, Hartnett reminds us that just eight months ago belief in debt deflation & secular stagnation induced lowest interest rates in 5000 years.


  • On July 11th 2016 Swiss government could have issued 50- year debt out to 2076 at a negative yield (of -0.035%)…

  • …and in 1989 the Imperial Palace in Tokyo worth more than all real estate in California…

  • …and in March’2000 the market cap of Yahoo was 25X greater than market cap of Chinese equity market (MSCI)…

  • …and in 2008 the combined assets of Iceland’s three biggest banks were 14 times the size of the nation’s GDP…

  • …all manias, all over now.


While the current mania almost ended in early 2016, it was once again China that was responsible for the latest leg higher:


  • The current rally was kick-started by China, commodities and credit (the “3C’s”) in February 2016: since then stocks are up 31%, commodities 27% and HY bonds 23%.

  • Watch the 3C’s…China, commodities, credit.

  • We believe commodity prices must rise to maintain equity outperformance versus bonds; BofAML forecast oil at $57/b in Q2. Note commodity/claims driver hooked lower last month or two.


And yet, this period of great confusion is slowly coming to an end: what happens next is split into two phases - the famous "Icarus Trade" popularized by Hartnett several months ago, which the BOFA strategist believes will send the S&P above 2,500 and the yield on the 30Y to 3.5%, before the next "Great Fall" trade emerges.


First, a look at the near-term forecast:


We believe we are closer to the highs than lows in risk markets. But tops are a process; lows are a moment. The hubris, monetary tightening and macro peak that normally ends a strong bull trend feels H2 not Q2. So our base case unchanged heading into spring:


  • Long stocks, commodities, US dollar; short bonds; we see double digit returns for Japan, Europe, UK stocks, oil in 2017, single digit returns for US stocks, commodities, US$ and EM, and low/negative returns for bonds

  • Q2 combo of bullish but light Positioning, fiscal Policy expectations, “hard” Profit data keeps our Icarus Trade targets alive…SPX 2500, GT30 3.5%, DXY 110


For those who wish to trade this last, marketwide blow-off top, Hartnett has several "favorite Q2 trades": the US$, sterling, oil and banks.


We think Q2 driver will be stronger growth expectations; tactical contrarians would play via long US dollar, long sterling-short EM FX, long oil, long EAFE banks-short US tech.


The risk to our bullish Q2 call is the price action of 3C’s (China, commodities, credit) deteriorates and signals synchronized global Profit top, on back of PBoC tightening. Commodity prices must rise to maintain equity outperformance versus bonds: BofAML forecast oil @ $57/b in Q2. EPS resilience required for stocks to continue to outperform bonds.


Hartnett also presents "a nice Icarus stat": "should the S&P500 exceed 2540 in conjunction with a 3% yield on the 10-year Treasury bond then US stocks will reach an all-time high versus US bonds, exceeding the prior tech bubble peak reached in March 2000"


Still, all great - if abnormal and fake - bull markets and manias come to an end eventually, and Hartnett warns that what follows the final, Q2 "Icarus" rally will be far less enjoyable, because that"s when the infamous "great fall" is set to take place.


Great Fall” potentially comes in H2 as hubris, synchronized monetary tightening, EPS peak coincide; buy long-dated puts in anticipation; we believe best time to sell would likely be after a pop induced by a US tax reform bill (March Fund Managers Survey showed only 10% of institutions expect US tax reform passed before summer recess).


And yes, the Fed will likely try to step in again with more rate cuts to prevent a crash, although this time it won"t work at least according to Hartnett, because after the "Great Fall" comes the Long View, which Bank of America describes simply as: Manias, Panics, Crashes


Longer-term, we continue to remind ourselves it’s not a normal cycle. “Normalization” from 5,000-year low in rates, 70-year low in G7 fiscal stimulus, 35-year high in US-German rate differential, all-time high US stocks vs. EAFE, 75-year low in bank stocks is unlikely to be peaceful.


  • Humiliation remains one of the best assets to buy.

  • In Feb 2009 the 10-year rolling return from US large-cap stocks humiliatingly dropped to -3.4%, lowest since 1930s.

  • Since then S&P 500 up from 676 to 2368; now second longest bull ever (longest ever if runs past August 22nd 2018), and becomes 3rd largest ever at 2467.


His conclusion is two fold.


On one hand, "our Longest Pictures argue for a treacherous period of potential manias, panics or crashes as policy makers try to normalize policy."


On the other, the response will be the same one we have said since day one will ultimately take place: runaway inflation as central banks literally throw everything at the next mega crash, or as Hartnett calls it, "further outperformance of inflation assets versus deflation assets."


And this is how to trade it:


  • The beneficiaries of rising inflation and rates are many.
    • The long-run price relative of real assets (real estate, commodities, and collectibles) to financial assets (stocks and bonds) is at its lowest level since 1926.

    • Bull markets in real assets have coincided with war and fiscal stimulus programs in 1940s, rise of inflation in 1960s and 1970s, and 9/11 & China accession to WTO in the early years of this century.

    • Higher inflation and interest rates are consistent with real assets outperforming financial assets: since 1970, relative performance of real assets 83% correlated with inflation.


His best trade recommendation?


"Buy gold."