Showing posts with label Backwardation. Show all posts

Wednesday, November 22, 2017

WTI/RBOB Slide After Smaller Than Expected Crude Draw, New Record High Production

With WTI at its highest since July 2015, vol at 8mo lows, and the front-end flipped into backwardation for the first time since Nov 2014, it appears a lot of hope is priced into continued equlilibration (and OPEC). Last night"s API (crude draw) provided some more confirmation but this morning"s DOE data disappointed with a smaller than expected crude draw, and production rose once again to a new record high.


“Domestic production is going to be the big nugget that everybody will be racing to see, in terms of whether those levels continue to rise or not,” John Kilduff, a partner at Again Capital, says.


“They likely will, so that can be a counter-balance to the drawdown”


API


  • Crude -6.356mm (-2.2mm exp) - biggest draw since August

  • Cushing -1.8mm

  • Gasoline +869k - surprise build

  • Distillates-1.67mm

DOE


  • Crude -1.86mm (-2.2mm exp)

  • Cushing -1.827mm

  • Gasoline +44k (+1mm exp)

  • Distillates +269k

DOE disappointed expectations with a considerably smaller than expected crude draw (and well below API) and modest product builds...


As a reminder, last week saw the first rise in total inventories in 8 weeks and that held this week.


US crude production rose 13k b/d to a new record high...


Price-wise, WTI went into the DoE report at its highest since July 2015 (both WTI/RBOB higher after API) thanks also to the shutdown of the Keystone pipeline which tightened the market, but both WTI and RBOB slipped after the print...


The front-end of the WTI curve is in backwardation for the first time since Nov 2014. The move briefly put all of WTI curve through 2021 into backwardation


However, BofAML analysts including Francisco Blanch said in report, that "bloated crude oil inventories in North America likely will remain the Achilles’ heel of the oil market, negatively impacting WTI."


Friday, November 17, 2017

As Oil Heads For Down-Week, Crude Stakes Are Huge

After five straight weeks higher - read by many as confirmation of how awesome the global coordinated recovery must be - WTI and Brent dropped this week as inventories rose, demand outlooks dimmed, and OPEC hope faded.


As Alhambra Investment Partners" Jeffrey Snider notes, there is a titanic struggle going on right now in the oil market.


On the one side of the futures market are the usual pace setters, the money managers. Last week, the latest COT data available, they went the most net long since March. If it continues, it will close in on the most positive futures position since the record long they established back in February.


Normally that would be insanely bullish for oil prices. But just as in February/March another part of the futures market has intervened on the other side. Back then it was the oil producers who rising inventory forced into a larger and larger offsetting net short (hedge).


This time, however, it is the swap dealers who are short for reasons that aren’t really clear. The weekly COT report for the last week in October showed a record net short for dealers, just beating their most extreme position from the middle of 2013 at -424k contracts. In the first week and November, they blew away that record at -470k.


It clearly matters because in 2017 the oil market has changed. It may be the inventory story, or it may be the exit of producers from hedging that inventory and other products. Whatever the case, money managers just aren’t setting the price like they used to. And it could be that managers have changed their market activities, too, where other parts of the futures market are now cueing off (shorting) this possible difference. I honestly don’t know what it is, but I can safely point out where it is.


Now with swap dealers apparently showing very, very strong conviction on the short side, oil prices can’t gain any traction beyond the $57 established by in all likelihood geopolitical risk.


The fundamentals of oil continue to favor the dealers over the managers, with oil inventories remaining at the same crisis “rising dollar” levels. Being slightly better than 2016 is not a real achievement toward clearing the leftover physical imbalance, not when oil inventories are instead still consistent with late 2014. With 2017 nearly over, there should have been much more progress toward 2013 levels of stock long before now if there was ever going to be a realistic chance to balance the oil market next year (at the most optimistic).


Instead, it indicates yet again a demand problem, as in lack of materializing upside demand due to, as always, economic constraints that in the mainstream aren’t ever considered real (like when the oil crash was called repeatedly a “supply glut”). Pushing the expected rebalancing date into 2019 or even (more realistically) 2020 creates greater downside not upside risks.


That may be why dealers have jumped all over the shorts; if it is geopolitical risks driving oil prices higher, and maybe what managers are betting on now, then if or when they fade the negative fundamentals of oil will be re-imposed on the price. That seems to be what the futures curve is saying, too.


Backwardation indicates expected balance, but at a very low price rather than a rebounding one. In the latest oil pullback since last week, the curve has moved lower in unison, with the same almost identical indicated backwardation rather than toward any serious rewind toward contango.


One additional factor to consider is those record and near-record opposite futures positions. What happens if the oil price starts to move in either direction? There may need to be a whole lot of covering by whichever side ends up on the losing end, perhaps turbocharging the price as it begins to move whatever way it decides to go.


There is right now a lot at stake in the crude market, and it’s not just about oil.


Monday, September 25, 2017

Brent Crude Spikes To Highest Since July 2015

North Korean war-talk has extended early gains for Brent Crude (driven by anxiety over the post-Kurd-referendum fallout), pushing prices to their highest since July 2015.


To the highest since July 2015...


As Bloomberg reports, Kurdish oil supplies may be in jeopardy as Turkey, Iran and the Iraqi central government in Baghdad sought to isolate the semi-autonomous Kurds as balloting began on Monday. Meanwhile, OPEC and its partners implemented more than 100 percent of their agreed cuts last month, OPEC Secretary-General Mohammad Barkindo said Friday in Vienna, providing more fuel to the oil rally.


“It’s pretty clear the Kurds are going to vote for independence and we will have yet another geopolitical hot spot in the Middle East that threatens a significant amount of oil supply,” John Kilduff, a partner at Again Capital LLC, a New York-based hedge fund, said by telephone.


At the same time, “the cooperation and the strong effort by OPEC is registering with the market.”


Brent crude oil futures curve has moved into backwardation in recent weeks, indicator of supply tightness...


And the Brent-WTI spread reaches its highest since August 2015...


Thursday, August 17, 2017

The Single Biggest Bullish Catalyst For Oil

Authored by Nick Cunningham via OilPrice.com,


One of the key objectives for OPEC is to bring down inventories, a goal that has been elusive this year. But if the oil futures curve is anything to go by, the oil market is showing signs of tightening.


Brent futures have recently begun to exhibit a state of backwardation, which is when near-term oil futures trade at a premium to contracts dated further off into the future. This is the first time in years that backwardation has occurred, and most analysts are taking it as a sign that the oil market finally could be getting closer to rebalancing. In the past, backwardations have accompanied a rebound in the oil market after a bust, while a contango (the opposite of backwardation) tends to occur when the market crashes because of a supply glut.


There are several reasons why backwardation is bullish, which has been discussed in previous articles. A declining futures curve makes it uneconomical to store oil, so backwardation could accelerate the drawdown in inventories. It also complicates the hedging strategies of shale producers, which could hold back expansion plans. It also is a symptom of tightening near-term supplies, although, to be sure, the flip side of that argument is that it could merely be a reflection of expectations that the supply glut will reemerge at some point in the future.    


Still, backwardation is occurring at a time when there are other bullish indicators starting to crop up. The U.S. has seen a sharp drawdown in inventories in recent months, down more than 60 million barrels since March. The IEA and OPEC both recently upgraded their oil demand estimates. "World economic growth has gained momentum," OPEC said. "With the ongoing growth momentum and an expected continued dynamic in second-half 2017, there is still some room to the upside."


The view of Wall Street is also becoming more bullish. Hedge funds and other money managers have amassed a large number of long positions on recent weeks. For the week ending on August 8, investors stepped up their bullish bets on Brent by the equivalent of 58 million barrels, according to the FT, which was the largest weekly increase towards net length since December.


“It’s hard to be aggressively negative if every week you’re getting stronger numbers,” Paul Horsnell, global head of commodities research at Standard Chartered, told the FT, although he added that “there is still resistance. The market is not willing to push prices too far up.”


Indeed, there is little prospect of oil prices moving much beyond $50 per barrel. Not everyone is even sold on the notion that the market is tightening. OPEC production is at its highest point so far in 2017, U.S. shale continues to rise, and some long-planned projects are coming online later this year in Canada and Brazil, for example. “There is no way this oil can be accommodated into the market so prices are going to have to give at some point,” Mr Dei-Michei of JBC Energy told the FT. “This bullish sentiment cannot last.”


In fact, swings in sentiment, like a pendulum, are typical. More than once this year, the bullish positions have built up too far, only to be undone when sentiment shifted, causing a steep selloff in oil prices. Following the price crash in June, the profoundly bearish positioning amongst hedge funds and other money managers also went too far, causing shorts to be liquidated and bullish bets to remerge – which, again, accompanied a rebound in prices.


All of that is to say that the most recent shift towards long bets on oil futures probably can’t carry oil prices all that far. The underlying fundamentals simply don’t justify significant price gains…at least for now. “They’re going to have to dig in for the long haul,” Neil Atkinson, head of the IEA’s oil markets and industry division, said on Bloomberg TV, referring to the OPEC cuts. “Re-balancing is a stubborn process.”


In short, the shift into backwardation in the futures market suggests that the supply balance is heading in the right direction, and it probably puts a floor beneath prices for the time being. But it doesn’t necessarily mean that oil be heading much higher than $50 per barrel anytime soon.

Saturday, August 5, 2017

Anticipating "VIX Shock", Interactive Brokers Raises Volatility Margins

Even as the VIX has continued to plumb new all time lows, unable to rebound from the realm of single-digits where it has spent a record amount of time in 2017, warnings about a potential surge in the volatility index have been growing in recent weeks.


Last week, in a note looking at what may happen "if the VIX goes bananas", Morgan Stanley"s Chris Metli cautioned that it’s easy to become numb to the low volatility environment and the risks it presents.  While trying to pick a trough in vol has been a fool’s errand, Metli said that focusing on the risks resulting from vol being so low is not, and warned that low vol has produced a regime where the risks are asymmetric and negatively convex, so being prepared for an unwind is critical.  "This is not a call that vol is about to spike, but you need a plan if it does", he echoed many other similar warning issued in recent months.


Of course, while nobody can know when a VIX explosion could occur, Morgan Stanley explained what could catalyze such a violent rise in volatility, showing that "just" a 3% to 4% one-day S&P 500 selloff could result in a 12 point VIX surge, a relationship MS showed through the gamma in vol related products, where demand for VIX futures from three main sources could result in 100,000 contracts ($100mm vega) to buy in a down 3.5% SPX move.  For context VIX futures ADV over the last year is 230,000 (although has risen to as high as 700,000 in big selloffs).


For those who missed it, below we recap some of the salient points of what would happens if the S&P 500 were to fall 3.5% today, based on Morgan Stanley calculations:


  • First, the VIX could rise as much as 12 points.  When volatility is low it tends to move a lot for a given change in the S&P 500.  That effect is likely to be exacerbated now because a) skew is steep (and VIX rolls up the skew in a selloff) and b) many players in the VIX market are short.  Taking these dynamics into account QDS estimates VIX could rise ~12 points for a 3.5% 1-day decline in SPX. Of course, a far smaller move in the VIX would be sufficient to result in massive losses among the vol-selling community according to previous calculations by JPM"s Marko Kolanovic.

  • Just as concerning, if VIX futures approach +100% in a single day, there is a risk that the providers of inverse VIX ETPs cover the VIX futures that they sold to hedge the products.  This is because there is a mismatch in the hedge if VIX futures rise more than 100% – the inverse ETPs can’t go below zero (-100%) but the loss on a short VIX futures position can be more than -100%.

  • For XIV (holding ~73,000 contracts short) the prospectus indicates that it will unwind if the NAV falls more than 80% intraday, with investors receiving the end of day value.  Given this is a known threshold, anything close to a +80% move in VIX futures would likely trigger buying (by the ETN provider and/or market participants) in anticipation of the unwind.  Note that because XIV is an ETN, investors receive the theoretical value of the index based on its rules, not what the provider actually trades.

  • SVXY (holding ~37,000 contracts short) does not have a set threshold to unwind according to its prospectus.  That said VIX futures currently have a margin requirement of ~45% of notional for the average of the front two contracts, and any decline in value of the inverse ETPs to those levels could trigger a rapid forced unwind.   Note that SVXY is an ETF, so the NAV is based on the actual holdings of the fund at the end of the day.


  • Adding to the pain – on days after the initial shock – would be the flow from annuity and risk parity deleveraging.  Both of those investors are slow by comparison to the VIX market – annuities will sell over several days, starting the day after a selloff.  Risk parity funds are more discretionary, and the supply could come over a matter of weeks.  But given high leverage resulting from the low vol environment, their potential supply is large and could prolong any downturn. Between all three vol players, a 3% drop in the S&P would result in forced selling of roughly $60 billion in one day, growing to $140 billion should the plunge accelerate to -5% intraday.


* * *


In a separate report also discussed here previously, Fasanara Capital"s Francesco Filia revealed what the "wipeout scenario" - one in which the VIX were to double from its current level in the 9/10 range to 18/20 - would look like for vol sellers. In a word, it would be an unmitigated disaster.


Our analysis shows that if VIX goes from 9.60 to 18/20 in absolute values (it was approx. 40 as recently as Aug2015), and stays there for 8 / 10 days in backwardation, VIX-based ETFs may stand to lose up to 55%. Short positions on long-vol ETFs can then lose up to 250% of capital with VIX at 20. Losses are higher in case of wider backwardation of the term structure of the VIX (i.e. front contracts trading higher than back contracts), or the longer VIX stays elevated while in backwardation, or clearly the higher it goes. For example, if VIX quadruples from here to 40, losses on a UVXY position would amount to a staggering 656%!


* * *


We bring up all of the above, because as Morgan Stanley said, "This is not a call that vol is about to spike, but you need a plan if it does" and at least one exchange is doing just that.


In a notice to clients sent out late on Friday, Interactive Brokers admits it is starting to get a worried about the recent VIX record lows and as a result after expiration processing on August 19, "Interactive Brokers will put into place greater margin requirements for Volatility Products."


While the IB notice had it usual dose of fluff and generic admonitions...


VIX has established new all-time lows over the course of the past month. The price dynamics of that product are such that it can have very large relative price increases over a very short period of time base on news and other market factors. In recognition of the special risk of sudden, large increases in market volatility, that is inherent in Volatility Products such as VIX, Interactive Brokers will put into place greater margin requirements for Volatility Products after expiration processing on Saturday, 19 August. 


... It was surprisingly clear in what the specific parameters of the anticipated move are, to wit:


IB"s margin policy will be to consider market outcome scenarios under which VIX might rise to a price of 18 (even when it is currently priced much lower) and under which the other Volatility Products could rise to proportionately similar degrees.


In other words, IB is starting to prepare for the day that the VIX doubles from current levels, which as Fasanara showed above, is sufficient to wipe out most vol sellers, and in the case of those with levered, naked volatility shorts, results in losses greater than 600%.


Who will be impacted:


If you have positions in Volatility Products that have risk in large upward moves of market volatility, then your margin may increase significantly.


Of course, since volatility is the "fulcrum security" of today"s reflexive market nature - does a surge in the VIX send stocks lower, or does a market crash lead to a VIX surge? - the very fact that vol-linked leverage is about to be aggressively cut first by one, then by many more if not all exchanges, as we head into the critical for volatility fall period, these warnings could create a self-fulfilling prophecy whereby the margin increases are the very catalyst that leads to a surge in volatility.


Whether that is what happens over the next two weeks remains to be seen. In the interim, IB said that "it will with immediate effect increase its Initial Margin requirements on Volatility Products to a degree consistent with the upcoming 19 August increases in Maintenance Margin."


What this means is that vol sellers will now have to pay up substantial additional margin (i.e. cash) for new short-vol positions, and that in two weeks, maintenance margins for legacy positions will be likewise affected. It also means that unless the short-vol traders have a generous amount of cash lying around, they will have no choice but to close out of existing positions, in the process sending vol, and VIX, higher if purely mechanistically.


IB also specifically cautions inverse vol sellers:


Some Volatility Products have "ultra" and "inverse" characteristics. Ultra products are expected to have greater daily returns than normal products while inverse products are expected to have returns that are of the opposite sign to normal products. It is therefore expected that an increase in market volatility will result in a decrease in the price of an inverse volatility product. As a consequence, for example, under the new policy the margin on a naked short call will increase for a normal product while the margin for a naked short put will increase for an inverse product.


This unexpected margin hike across the vol universe by Interactive Brokers (to be followed by its competition) is especially notable because one month ago Bank of America warned that the most dangerous moment for markets "will come in 3-4 months", or 2-3 months as of today, when the confluence of the adverse debt-ceiling negotiation, disappointing Q3 earnings, and the Fed"s balance sheet unwind all converge into one broad risk-off shock.


It is precisely this "event" that Interactive Brokers is the first to admit may have drastic consequences on the market.


IB"s full notice is below.


Friday, July 28, 2017

Rig Count Rises By Just 2 As Goldman Expects Oil Market To Rebalance By Early 2018

With WTI heading for its best week since 2016, demand and inventory data is trumping production for now and today"s Baker Hughes rig count data did nothing to change that as, following last week"s 1 rig drop, producers only added 2 oil rigs in the last week to 766.


  • *U.S. GAS RIG COUNT UP 6 TO 192 , BAKER HUGHES SAYS :BHGE US

  • *U.S. OIL RIG COUNT UP 2 TO 766 , BAKER HUGHES SAYS :BHGE US

Judging by the lagged correlation to WTI, rig counts are stalling as expected...


US (Lower 48) crude production continues to rise with lagged rig count data...topping 9mm barrels last week for the first time since July 2015...


WTI, Brent poised for largest weekly gains in 7 months amid indications that market is rebalancing...


“There’s less crude oil,” Bob Yawger, director of the futures division at Mizuho Securities USA, says. “That’s all there is to it”


And as OilPrice.com"s Tsvetana Paraskova notes, Goldman Sachs said on Thursday that it was “cautiously optimistic” on oil prices as recent data show that the rebalancing of the oil market is speeding up and if the drawdown trends are sustained, stockpiles will normalize by early 2018.


“While OPEC’s production path remains uncertain, recent fundamental oil data have come in even better than we had expected,” Goldman said in a note, as quoted by CNBC.


“If sustained, these trends would help achieve the normalization in inventories by early next year,” the investment bank added.


Over the past month, oil prices have rebounded thanks to robust demand, strong draws in U.S. inventories, and drops in U.S. rig counts, Goldman said. Oil prices have risen above the investment bank’s price projection for September 2017 of US$50 per barrel of Brent, Goldman Sachs said.


The EIA reported this week another hefty decline in U.S. commercial crude oil inventories for the week ending July 21. The EIA said crude oil inventories diminished by 7.2 million barrels, to 483.4 million barrels. The EIA had reported strong inventory draws in the last three weeks as well. Meanwhile, the number of active oil rigs in the United States fell last week by 1 rig —its second loss in four weeks.


According to Goldman estimates, data from the U.S., Europe, Japan, and Singapore point to a total inventory drop of 83 million barrels since March. In addition, demand in the U.S., India, and China is strong, and Goldman expects it to stay strong through the end of this year, leading to sustained draws in the third quarter.


According to Goldman, this would tighten the physical oil market and flip the market structure to backwardation this year.


However, the bank is still “cautious” on prices because the inventory decline needs to show it will be sustained.


As a reminder, earlier this month, Goldman Sachs said that oil prices could soon fall below US$40 if there wasn’t a sustained drawdown in U.S. crude inventories and rig counts, or without any bold “shock and awe” action from OPEC. The oil market is searching for a new equilibrium, Goldman said back then, adding that it was still too early to tell whether the most recent inventory reductions in the U.S. are an anomaly or if they signal the start of something more durable.

Monday, July 17, 2017

Stockholm Syndrome Gold Report, 16 July 2017

Stockholm Syndrome is defined as “…a condition that causes hostages to develop a psychological alliance with their captors as a survival strategy during captivity.” While observers would expect kidnapping victims to fear and loathe the gang who imprison and threaten them, the reality is that some don’t.


There is a loose analogy between being held hostage and being an investor in a regime of irredeemable paper currency and zero interest rates. In both cases, the victim has little hope of escape and must seek to somehow survive under malevolent conditions.


Key behaviors in Stockholm Syndrome are positive feelings for their captors, a refusal to work with law enforcement afterwards, and even a belief in the terrorist’s humanity.


Key behaviors of investors today show eerie parallels: a desire to bid on dollars with their assets, a refusal to support the gold standard, and even a belief that the dollar is money. This last always shows when someone—even a gold bug—says gold is going up, or gold is the best performing currency, or gold has good returns.


These words up, performance, and returns indicate that the victim accepts the dollar as money, the dollar as the measure of value, the dollar as the unit of account. The victim seeks to view gold in terms of his captor’s paradigm. Much the way the kidnapping victim seeks to understand his capture and even geopolitics in terms of his captor’s world view.


Many victims are so thoroughly in thrall, that they scoff at the very idea of earning interest from a productive enterprise. They seek only the latest bubble, wherein they can make a profit: more dollars. Or, if not more dollars, at least more purchasing power. For years, they sought to do this in the gold and especially silver markets. Some gold bugs go even farther, and opposed a gold standard. Perhaps they don’t want sound money, they want gold to go up which means something external that gold can go up against.


We watched bemused, as a speaker at the Metal Writers Conference in Vancouver on May 29 told a standing-room-only crowd that bitcoin would hit $1 million (it went up after that, but is now down about 15% from that day). A 436X return would be nice, but of course the profits can only come from later speculators. There is an ugly little word for schemes in which profits come from those who buy in later. It is named for a gentleman who came from Italy, promoting his scheme in Boston.


We blame the game, not the player. It is important to emphasize this—don’t blame the players, blame the game—and we probably don’t do it enough. The fault lies not with those who bet on gold or bitcoin or anything else, nor even with those who regard betting as investing. The fault lies with the Fed and the other central banks who have the hubris to think they can centrally plan their way to prosperity. And the gun to force it on us, whether we agree or not. And the madness to cause the interest rate to fall for 36 years and counting (the Fed is not going to push the interest up much farther in this cycle, if they even dare one more hike). When freedom seems so remote as to be hopeless, it may be natural (we leave this to psychologists to say) to find a way to compromise, to get along to go along.


As to us, we will go on working towards that day of freedom, a big part of which is helping people see the monetary system for what it is: the current implementation of the fifth plank proposed by Karl Marx. Another part is to pay interest on gold…


Last week, we said:


“Peak hype, peak desperation, all selling in the streets with little buying… we are not technicians and do not focus on sentiment… but this description sounds like the definition of capitulation.


Also, we would add something important. Even if this is a capitulation low, that does not necessarily a mean a moonshot to $5,000 or even $2,000. We don’t expect that, and won’t expect it without evidence of a much more serious shift in the fundamentals. We would expect a normal trading bounce within the range and perhaps a few bucks over $1,300.”


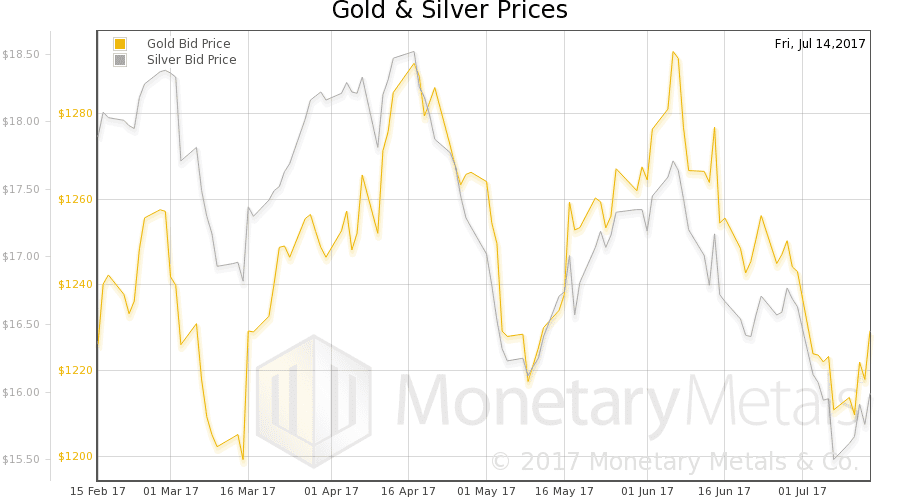
This week, the prices of the metals bounced somewhat, within the trading range. Gold closed last week at $1212, and this week at $1229. In silver, last week’s close was $15.56, and this’s week was $15.96.


Will the bounce continue? Have the fundamentals firmed up?


We will show graphs of the true measure of the fundamentals. But first charts of their prices and the gold-silver ratio.


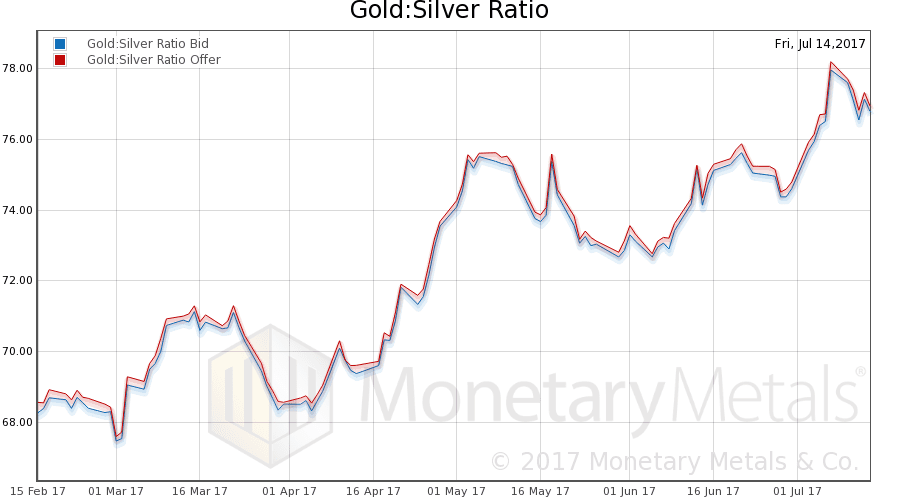
Next, this is a graph of the gold price measured in silver, otherwise known as the gold to silver ratio. The ratio moved down this week.


In this graph, we show both bid and offer prices for the gold-silver ratio. If you were to sell gold on the bid and buy silver at the ask, that is the lower bid price. Conversely, if you sold silver on the bid and bought gold at the offer, that is the higher offer price.


For each metal, we will look at a graph of the basis and cobasis overlaid with the price of the dollar in terms of the respective metal. It will make it easier to provide brief commentary. The dollar will be represented in green, the basis in blue and cobasis in red.


Here is the gold graph.


The dollar fell a bit this week (the mirror image of the rising price of gold). Now it is the dollar hostages who use gold as their preferred hostage-bargaining chip to feel a bit better. One ounce of this commodity now fetches 17 more of the kidnapper’s paper scrip than it did a week ago.


As the dollar fell, the cobasis fell (especially in farther-out contracts). The August cobasis is still above zero (i.e. temporary backwardation).


Our calculated gold fundamental price is not much changed, still above the market price by a goodly margin (chart here).


Now let’s look at silver.


As the dollar has dropped (i.e. silver trades for more gang-scrip than last week), the cobasis has come down. But it’s still higher than gold’s cobasis, and this is the September contract, a month further from expiry than the August gold contract.


Our calculated silver fundamental is rising again, also a healthy margin above the market price.


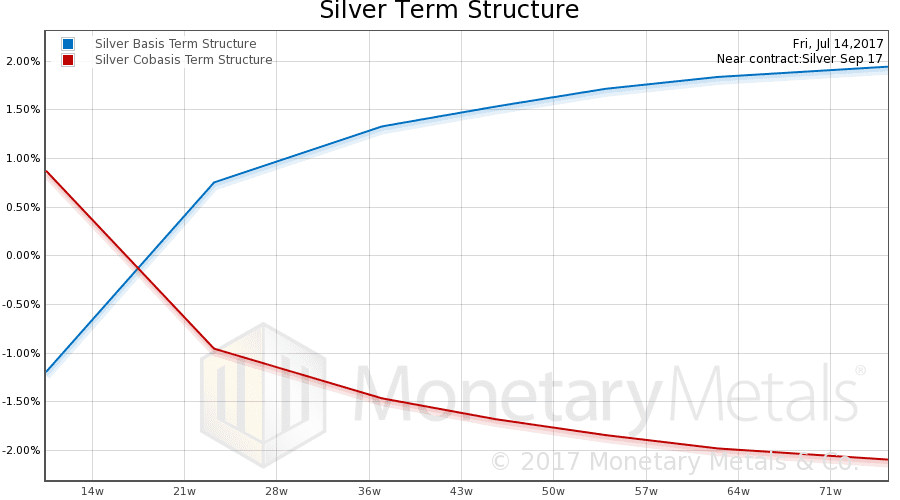
We thought it would be worth addressing the question: “is there a shortage in silver?” Let’s do it with a device that’s famously worth 1,000 words. This picture shows the term structure of the silver futures market.


What we see is what Sherlock Holmes observed that people heard in the night in the story Silver Blaze. There are no interesting features. Other than the temporary backwardation in the September contract, we see a rising basis and falling cobasis as we look out to December 2018. The rising basis looks a lot like the yield curve in the dollar, though slightly lower (6-month LIBOR is 1.5%).


If a real shortage developed in silver, the above curve would look quite different. And we would be publishing pictures of it.


Monetary Metals will be exhibiting at FreedomFest in Las Vegas in July. If you are an investor and would like a meeting there, please click here. Keith will be speaking, on the topic of what will the coming gold standard look like.


© 2017 Monetary Metals

Tuesday, July 11, 2017

Spoofing Lessons From Andy Hall - The Oil AND Silver King

A Silver Legend Throws in the Towel on Oil


By Vince Lanci for Soren K. Group


BACKGROUND


In 2010 I wrote an anonymous article for Zerohedge on Silver manipulation. Anonymous because the article was in part an indictment of the market structure on COMEX at the time. I was afraid of backlash against me and my nascent family, having already having seen the underside  of a bus in 2003 via my own actions and the need for a conflicted, and unqualified compliance officer / bureaucrat Tom LaSala in danger of losing his job after a horrendous failure to protect the NYMEX electricity contract. This, according to NYMEX / CFTC sources then. But I digress. 


About the  author: Vince Lanci has 27 years’ experience trading Commodity Derivatives. Retired from active trading in 2008, Vince now manages personal investments through his Echobay entity. He advises natural resource firms on market risk. Over the years, his expertise and testimony have been requested in energy, precious metals, and derivative fraud cases. Lanci is known for his passion in identifying unfairness in market structure and uneven playing fields. He is a frequent contributor to Zerohedge and Marketslant on such topics. Vince contributes to Bloomberg and Reuters finance articles as well. He continues to lead the Soren K. Group of writers on Marketslant.


Hall WasThe Uncrowned King of Silver


For me, PhiBro was a mentor in how to not be a victim and to try to divine my opponents" intentions just by watching their trades. An exercise in applied empathy if you will. To study PhiBro is to study Andy Hall.


Andrew Hall is a legend in the trading community. He was instrumental in execution of the 1994 Silver squeeze and the 1997 Buffet Silver buy.  He was a manipulator of Silver to the upside. But metals were just his HOBBY. And when Hall had orderflow, he maximized returns for clients and the prop desk at PhiBro. The man knew how to front run! But without order flow..


Astenbeck"s  Returns.


https://www.marketslant.com/core/assets/vendor/ckeditor/plugins/widget/i...);">?


Maybe the seat makes the money, not the man in it? But we aren"t here to kick him. Rather to describe what the man is good at. and to describe what we observed from  him.


Andy Hall, Oil  Perma-Bull


His baby was oil. We remember being on the wrong end of many mini oil plays by his desk at PhiBro right before a refinery fire became public. Here is one play his desk loved to do at least once a month :


  • Hall Gets Long Oil > Broker buys Calls for PhiBro hard and sloppily  > Oil rallies > Refinery fire news hits > Oil rallies more > Hall gets out of longs > Cue the crying options traders.

This was brilliant because he played the most liquid market against news in a much less liquid one. And a refinery fire is not necessarily bullish oil. It destroys oil demand as the refinery shuts down.


But when the option broker telegraphs who is buying, and the PhiBro reputation precedes him, and the option marketmakers  rush like lemmings to buy futures to hedge their short deltas.... you get long!.


Hall Was Immune to Buffet"s House Cleaning


We also knew traders on his desk that got fired by Solly, PhiBro"s parent,  after Buffet came in 1994 to rescue them. Hall did not. Because Hall was in energy, and while he had his own position in Silver on both occasions, he was not the poor sole who took the fall in 1994. 


Why Hall Was Great


The reality is, it is not so  easy to be right without client flow behind you. Hall"s early success in oil on his own may have been in part a function of a secular bull market in commodities to begin with. Personally, our experience  has been that Hall was not a directional expert, but he knew when a market was lopsided and knew how to catalyze the exit problem for everyone else. He also was expert at creating exit strategies for his own massive positions. 


Once  I saw a broker in Silver futures laughing (in relief) and shaking his head after executing and seemingly butchering a 5,000 sell order. I knew this broker well and asked him: "Was the client upset?" His answer was " NO, He was laughing!" To which i prodded him: "Was this the big player you have?". His  response was: NO, THIS WAS THE CLIENTS ENERGY DESK TRADER. And HE WAS LAUGHING AS I FILLED HIM 20 cents LOWER THAN I SHOULD HAVE.


Apparently this was Hall. And he had been long from $3.00 lower in Silver. To top that, a silver options broker had bought 1,000 calls loudly 30 minutes prior, driving uo the futures price about 20 cents. This was the same energy tactic Hall used so often. And a lesson was learned.


Taking on the Banks


Possibly least understood was his acumen in playing the oil futures term structure. We saw and were informed of his massive plays where calendar relationships were out of whack and he stepped in to fix them. He would be the buyer of 2 year December futures after  a bank was done laying off producer hedges  for his "back-to-back" vig. Then he"d sell another month in which he thought the price was out of whack on the high side. He exploited distortions created by organic order flow. Then he waited to be right. And sometimes, he nudged himself in being right as these were illiquid contracts. He would test the resilience of the sell side (maybe the bank actually held onto some of the hedge given them by the client?) by buying in thin hours to see if they pushed back. This is spoofing by the way. But he wasn"t necessarily fishing for stops like a slow motion algo. He was looking for sellers as he bought. And if they didn"t buy, he"d keep pushing. 


I labelled this to all who would listen as an inverted  pyramid style. It was the antithesis of investing.  It went something like this:


  1. Already be long  (when wasn"t he?)

  2. Buy 1 contract

  3. Buy 2 contracts if the fill on the first one was poor

  4. Buy 10 contracts even worse

  5. Buy 100 contracts even worse, then bid for 1000 at that price

  6. Buy some calls which will create option related futures buying

  7. Sit back and see what happens.

  8. If the market takes off, sell as many futures as you were long 

  9. Use the calls as either a tail or convert them to synthetic puts


Bidding to Sell


I knew a  precious metals floor broker who actually lost his business because of executing for PhiBro in this fashion. The broker was bidding and showing  some ridiculous volume for one part of the PhiBro desk. And in between his announcing his bid he was selling to locals 10 cents under his bid.  He could not cross the trades as they were for the same firm, but from different desks / clients. The broker was accused of facilitating market manipulation.


Crime scene depicted, but pales by comparison to HFT/ Algo crimes which are floor tactics on streroids with no counterparty transparency.


What really happened was he was selling for a Phibro trader or client long, while simultaneously bidding for another Phibro person.  That broker was handing money to locals who ran from him, scared it was a trick. I saw this happen. And it was hilariously scary.  I"m sure some of the details are not right here, and I have an alternate explanation of what may have been going on at the PhiBro  desk, but it changes nothing. Phibro was bidding above where they were selling and neither side could get filled.


A Product of PhiBro Culture


To begin to try to understand Hall a bit one must understand the culture of PhiBro. That firm started in the least liquid products  imaginable: iridium and such. To be a marketmaker in assets like these, one must have a brilliant tactical mind for creating your exit liquidity. Hall has that skill. One must also recognize the right time to corner a market. Hall did this. And one must know how to disguise one"s intentions in a small market where participants are easily identified. The PhiBro trained Hall did this.


These survival skills lent themselves greatly to manipulations of Silver on more than one occasion (crushing overhedged producers), front running refinery fires on many occasions, and in recognizing distorted futures curves from undigested order flow (and subsequently taking the banks who were order-flow monkeys on)


Read on and keep the above in  mind when reading Hall"s letter. 


- VLanci@echobay.com


Andy Hall"s Letter to Investors 


as published in ZH


[emphasis by Tyler Durden]


July 3, 2017


Dear Investor,


The oil rout continued in June with prices entering bear market territory. Not only did sentiment plumb new depths but fundamentals appear to have materially worsened. Demand growth seems to be somewhat less than anticipated while supply keeps surprising to the upside. The expected acceleration in inventory drawdowns has not materialized – at least as evidenced by available high frequency data. Several weeks of lackluster inventory data from the EIA, along with reports of increasing amounts of oil in transit and in floating storage, disappointed expectations for accelerating stock draws following the arrival of peak seasonal demand.


Meanwhile, U.S. shale operators have continued to add rigs at a surprisingly fast rate thus raising the odds for significant oversupply in 2018, even if OPEC maintains its production cuts beyond Q1. Over the past month, the market has in effect priced in two negatives, one long-term, the other short-term.


The longer-term negative is that it is becoming increasingly evident that, under most reasonable scenarios, U.S. shale oil will be the marginal source of supply, at least until 2020. There are enough non+OPEC, non-shale production projects already in the pipeline (and which were sanctioned when prices were much higher than today) that incremental U.S. shale oil production alone can balance the market for the next two or three years. Moreover, and more importantly, it is now becoming apparent that the cost of this oil is significantly lower than was believed to be the case even a few months ago. That means the long-term price anchor for oil has moved lower. At the start of the year, the anchor was thought to be about $60 (Brent) and rising over time. Today, it appears to be closer to $50 (and possibly still falling). Prices for long-dated futures have therefore moved down to reflect this new perception.


The short-term negative is an apparent deterioration in the supply and demand balances for 2017. Until recently it looked like demand would exceed supply by as much as 1.5 million bpd if OPEC maintained its production cuts through 2017. This would have eliminated the global inventory surplus sometime in Q3 and resulted in a backwardated market. It now seems, however, that the supply deficit will be considerably smaller than originally expected – probably only around 0.5 million bpd. There will therefore still be sizeable excess stocks at the end of the year. This realization has resulted in the market moving into a steeper and uninterrupted contango with spot prices falling relative to deferred prices which, as just noted, have themselves ratcheted lower.


We discuss both these developments in more detail below. However, absent some geopolitically induced supply curtailment or a further cut by OPEC, oil prices are likely to be range bound around a level that limits the growth in shale oil production. That would mean the forward WTI strip ought to be somewhere below $50.


Shale is now the marginal barrel


Technological advances have continued to drive down well breakevens as well as expand the shale oil resource base in the U.S. In a recent report, PIRA estimated that there are now 80 billion barrels, or half of the recoverable U.S. shale oil resource base, that is economic at $50 Brent (say $48 WTI) or less. This represents some 215,000 well locations. Each of these on average can produce around 300 bpd in its first year on stream. The current horizontal oil rig count is 650 and has been growing at a rate that would bring the count to close to 800 by the end of the year. 800 rigs can drill about 15,000 wells per annum which means potentially 4.5 million bpd of gross new production. After deducting legacy decline this would translate into net production growth of more than a million bpd per annum, which exceeds the expected “call on shale” (demand growth less non-shale crude supply growth from non-OPEC, OPEC crude and other non-crude liquids). Today’s rig count or lower would be necessary to constrain shale oil growth to the 0.7- 0.8 million bpd of year/year growth in shale oil production that is probably required to balance supply and demand.


The market is therefore trying to find a price level that curtails rig additions (and/or well completion activity) to a level commensurate with the call on shale. Exactly what that price is can be debated and the truth is no one really knows. It depends on current and future rig productivity, how drilling and completion costs respond to rising oil field activity levels, the willingness of shale operators to outspend their cash flows and the availability and cost of capital to the industry.


Notwithstanding uncertainties surrounding all these variables, it does seem that the price needed for a given rate of growth in shale oil production has been falling over time. Well breakevens have dropped because of steep rig productivity gains and cyclical cost declines. They could fall further if continued secular gains in rig productivity outstrip the cyclical cost increases now resulting from higher oil field activity.


Over the past two years, average rig productivity in the U.S. Lower 48 states has grown by more than 20 percent per annum. In the Permian basin productivity grew by around 30 percent last year. These gains have been achieved through reduced drilling times from the use of pad drilling and increased well productivity from longer laterals, more intense fracking and higher proppant loadings.


Whilst the rate of rig productivity growth appears to now be moderating, it is unlikely to stop altogether. A recent Goldman Sachs analysis posits continued productivity growth for years ahead. This will be driven by higher rates of recovery of initial oil in place through the application of artificial intelligence and big data analytics. Goldman argues that this could eventually reduce breakevens to $45 and below. The best operators in the Permian like EOG already have well breakevens at, or even below, $40 WTI. As the rest of the pack catches up with the leaders, average breakevens are likely to fall further if Goldman is correct.


If the marginal cost of oil for the next 3 or 4 years really is headed to the mid-$40 range then OPEC’s attempts to push prices to $60 seem futile. It is unlikely that OPEC will find the cohesion necessary to keep prices at an artificially elevated level if all it does is accommodate rampant growth in shale oil production.


That line of thinking raises the possibility of yet another reversal in OPEC policy – abandoning supply management and letting market forces balance supply and demand. This would obviously result in significantly lower prices, at least in the short term. On the other hand, with many OPEC countries needing much higher prices for fiscal sustainability (for Saudi Arabia the level is over $80), there is an inherent instability which adds to the geopolitical risks to supply. But for now, it seems likely that OPEC, led by Saudi Arabia, will stay the course with its current policy of production restraint. Oil at $45-50 is preferable to it being at $40 or below, even if the loftier target of $60 has proven elusive.


With hindsight, OPEC’s attempts to manage supply were poorly conceived. Given the short response time of shale oil to changing prices, OPEC should have acted more quickly and more decisively. The production cuts should have been deeper and implemented immediately. As it was, OPEC talked up the market ahead of the actual production cuts thus helping to unleash a fresh wave of future shale oil production as emboldened operators upped their capex budgets and raised capital on the back of the higher prices. Additionally, OPEC ramped up production in Q4 2016 ahead of its mandated cuts, thus adding to the very stock excess they were hoping to eliminate. OPEC members also then inexplicably offset the impact of their cuts by drawing down their own inventories to maintain exports during Q1 2017. This made no sense given OPEC’s stated goal of reducing OECD inventories to their five-year average.


Fundamentals have deteriorated significantly


In implementing its production cuts at the start of the year, OPEC and its allies were aiming to eliminate the inventory excess. This would have allowed spot prices to rise relative to deferred ones, pushing the market into backwardation. A backwardated market would eliminate the “subsidy” shale operators have been realizing by selling forward to hedge production. This would therefore help curtail shale oil supply growth by removing this windfall hedging profit. But it clearly hasn’t happened. The spread between Dec 2017 and Dec 2018 futures contracts moved $3, from a $1 backwardation to a $2 contango, over the past month as it became increasingly likely that there would still be substantial excess inventories at the end of the year.


There are several explanations for why the expected supply deficit has not materialized.


  • Firstly, demand growth has been somewhat disappointing. Based on indicators of economic activity, demand in 2017 should be growing by around 1.7 million bpd, if not more. Actual growth, however, seems to be closer to 1.4 to 1.5 million bpd for reasons that are not yet clear.

  • Secondly, non-OPEC supply growth has been exceeding initial expectations – largely because of faster shale growth in the U.S. Forecast growth in non-OPEC supply for 2017 has been revised progressively higher by 0.3 million bpd. OPEC production is also now expected to be greater than seemed the case just a month ago because of the earlier than anticipated return of shut-in production in Libya and Nigeria. This will add around 0.2 million bpd of additional supply on average in 2017.

  • Finally, revisions to data for 2016 now show a small flow surplus of 0.1 million bpd whereas previously there had been a small flow deficit.

Together these changes amount to a 0.9 million bpd deterioration in the supply and demand balance for 2017 and an initially expected supply shortfall for the year of 1.4 million bpd now looks like it will be closer to 0.5 million bpd. Because of lower SPR purchases in India and China, as well as stock reductions in the OPEC countries, the drop in observed commercial inventories will be even lower – perhaps as little as 0.3 million bpd. This is much less than the rate needed to mop up the stock surplus – some 450 million bbls at the start of 2017 - and the market will almost certainly enter 2018 with a still substantial inventory overhang.


Moreover, at the rate at which oil drilling rigs have been added in the U.S., non-OPEC production has been on a path to grow by as much as 2 million bpd in 2018. With demand growth of, say, 1.5 million bpd and a 2017 flow deficit of only 0.5 million bpd, and with higher year/year production from Libya and Nigeria, that would imply an annual average stock build next year, even if the current OPEC production cuts remained unchanged for the whole of 2018, something which is by no means a given. It is this specter of renewed stock builds in 2018 adding to still inflated inventories that has panicked the market and caused the forward curve to move into contango. This reversal of the time spreads, combined with the drop in deferred prices to match a lower perceived marginal cost, has resulted in nearby prices collapsing, even though seasonal factors are becoming their most favorable.


In short, OPEC, the market and oil bulls have run out of runway. There are just 10 weeks before fall turnarounds kick in and crude stocks in the U.S. start to build again. Excess crude inventories in the U.S. are around 80 million barrels, up sharply since the beginning of June, reversing the trajectory seen in April and May when sequential crude oil draws were rapidly eliminating excess crude oil inventories.


In the past month, however, excess crude stocks in the U.S. are back to the levels seen this time last year and there now appears to be little chance that they can be eliminated before the fall – especially if the rate of inventory change seen in the data for the past three weeks is maintained. Moreover, Q4 2017 will see an acceleration in U.S. oil production as the impact of higher rig counts is increasingly reflected in higher production.


The main culprit for the disappointing stock draws in the U.S. is a stubbornly elevated level of net imports. While imports from Saudi Arabia have finally turned lower, those from other OPEC producers (notably Iraq) have risen. Crude exports have also fallen in recent weeks, at least if the preliminary data are to be believed.


Backwardation was meant to take care of excessive shale production in 2018 and beyond by driving deferred prices to levels that would constrain its growth. But stocks have not fallen fast enough to sustain backwardation so the whole futures curve has downshifted instead.


When the facts change…


For all the above reasons, it looks increasingly like oil prices will be rangebound for some time to come. Hitherto, it had been our view that oil would trend higher as prices would need to rise to a level that would justify investment in more costly sources of supply than just the core areas of U.S. shale. However, not only has the core shale oil resource grown significantly – above all in the prolific Permian basin – but breakevens have dropped because of secular productivity gains outpacing cyclical cost increases, at least for now. Furthermore, there has been no shortage of capital to fuel the growth in shale oil production and this has allowed operators to significantly outspend their cash flows. The marginal economics of the typical shale oil producer have proven to be no impediment to the industry’s resilience. The breakevens referred to earlier are based on half-cycle economics. Full-cycle costs that cover land acquisition, infrastructure and overhead are probably almost $10 higher. But companies base their drilling decisions on half-cycle costs even if this leads them on the path to eventual bankruptcy (to which the shale oil industry is no stranger) so long as they have access to capital. It’s quite possible that shale oil production growth can only be reined in by the capital markets rationing the supply of funds as industry management seems to be more focused on growth than generating free cash flow or even paper profits [ZH: this is something we have been pounding the table on since 2014, most recently in mid-June].


It also appears that the cost of developing other supply sources, such as deep water offshore, has been falling dramatically making them competitive with shale in many cases. Because of these developments, the cost curve for oil has become much flatter. There is now an abundance of potential supply at around $50 Brent. Prices will tend to oscillate around this long-term price anchor in response to changing inventory levels as the market tries to determine the right price to satisfy the call on shale. With the current inventory surplus and what looks to be its slow dissipation, markets are also likely to stay in contango, barring some sort of supply shock.


These developments call for a more opportunistic approach to the oil market than hitherto. Whereas it once seemed positions could be held with an eye to a longer-term secular appreciation, that is no longer the case. Indeed, the evidence is now in plain sight. Over the past year, the front month WTI futures contract has moved by double digits in percentage terms 10 times within a $40 - $55 band. This volatility has been accentuated by large financial flows into and out of the market by non-traditional investors and algorithmic trading systems. Attempting to capture just a percentage of those moves makes more sense than trying to ride what has turned out to be a non-existent trend, especially when contango inflicts a negative roll return on investors. The extreme volatility within a rangebound environment also argues for a more tactical and conservative approach to portfolio management.


For now, the market is heavily oversold with a record speculative short position. Q3 should still see decent stock draws even if they are insufficient to eliminate excess stocks. Also, increases in the rig count appear to be ending and could decline in the coming weeks and months. It also remains to be seen how quickly the increased drilling activity will translate into a commensurate increase in the number of completed wells and whether cyclical cost pressures will accelerate or bottlenecks develop. Already, the number of drilled uncompleted wells (DUCs) has been rising quite rapidly. There is also a non-zero chance that OPEC might surprise the market with a further “shock and awe” production cut. Taken together these considerations mean there is a good chance for a price recovery from current levels. However, this recovery will be limited for the reasons set out earlier and because of the overhang of potential selling from oil producers who are significantly underhedged for 2018.


Best regards


Andrew J. Hall


Chairman and CEO


Read more by Soren K.Group

Sunday, July 9, 2017

"When The Facts Change"- Oil's Biggest Cheerleader Capitulates: Andy Hall's Full Bearish Letter

After years of being oil"s biggest cheerleader, "oil god" Andy Hall, who starting with the OPEC Thanksgiving massacre in 2014 has had several abysmal years, in the process losing the bulk of his AUM, finally threw in the towel last week when in a July 3 letter to investors, he admitted that "the facts have changed" and that "fundamentals have deteriorated significantly" adding that "demand growth seems to be somewhat less than anticipated while supply keeps surprising to the upside... the expected acceleration in inventory drawdowns has not materialized... disappointed expectations for accelerating stock draws following the arrival of peak seasonal demand. Meanwhile, U.S. shale operators have continued to add rigs at a surprisingly fast rate thus raising the odds for significant oversupply in 2018, even if OPEC maintains its production cuts beyond Q1. Over the past month, the market has in effect priced in two negatives, one long-term, the other short-term."


More importantly, Hall confirms what we have said for the past two years and what most so-called experts have missed: namely that "shale is now the marginal barrel" and adds that "if the marginal cost of oil for the next 3 or 4 years really is headed to the mid-$40 range then OPEC’s attempts to push prices to $60 seem futile" adding that "It is unlikely that OPEC will find the cohesion necessary to keep prices at an artificially elevated level if all it does is accommodate rampant growth in shale oil production."


That line of thinking raises the possibility of yet another reversal in OPEC policy – abandoning supply management and letting market forces balance supply and demand. This would obviously result in significantly lower prices, at least in the short term. On the other hand, with many OPEC countries needing much higher prices for fiscal sustainability (for Saudi Arabia the level is over $80), there is an inherent instability which adds to the geopolitical risks to supply. But for now, it seems likely that OPEC, led by Saudi Arabia, will stay the course with its current policy of production restraint. Oil at $45-50 is preferable to it being at $40 or below, even if the loftier target of $60 has proven elusive.


As a result, the swashbuckling, permabullish Andy Hall we have all grown to love and mock for the past 3 years is dead and buried, replaced with the latest reformed oil skeptic.


These developments call for a more opportunistic approach to the oil market than hitherto. Whereas it once seemed positions could be held with an eye to a longer-term secular appreciation, that is no longer the case. Indeed, the evidence is now in plain sight. Over the past year, the front month WTI futures contract has moved by double digits in percentage terms 10 times within a $40 - $55 band. This volatility has been accentuated by large financial flows into and out of the market by non-traditional investors and algorithmic trading systems. Attempting to capture just a percentage of those moves makes more sense than trying to ride what has turned out to be a non-existent trend, especially when contango inflicts a negative roll return on investors. The extreme volatility within a rangebound environment also argues for a more tactical and conservative approach to portfolio management.


Still, for oil bulls who despair that their god has abandoned them there is some hope. As Hall concludes, "for now, the market is heavily oversold with a record speculative short position. Q3 should still see decent stock draws even if they are insufficient to eliminate excess stocks. Also, increases in the rig count appear to be ending and could decline in the coming weeks and months. It also remains to be seen how quickly the increased drilling activity will translate into a commensurate increase in the number of completed wells and whether cyclical cost pressures will accelerate or bottlenecks develop. Already, the number of drilled uncompleted wells (DUCs) has been rising quite rapidly. There is also a non-zero chance that OPEC might surprise the market with a further “shock and awe” production cut. Taken together these considerations mean there is a good chance for a price recovery from current levels."


But before you bet the ranch (on margin) read this, "this recovery will be limited for the reasons set out earlier and because of the overhang of potential selling from oil producers who are significantly underhedged for 2018."


Finally, for all those contrarian oil bears who were patiently waiting for that immaculate sign when both Gartman and Hall turn bearish, now is the time to buy.


* * *


Below is Hall"s latest letter to investors:


July 3, 2017


Dear Investor,


The oil rout continued in June with prices entering bear market territory. Not only did sentiment plumb new depths but fundamentals appear to have materially worsened. Demand growth seems to be somewhat less than anticipated while supply keeps surprising to the upside. The expected acceleration in inventory drawdowns has not materialized – at least as evidenced by available high frequency data. Several weeks of lackluster inventory data from the EIA, along with reports of increasing amounts of oil in transit and in floating storage, disappointed expectations for accelerating stock draws following the arrival of peak seasonal demand.


Meanwhile, U.S. shale operators have continued to add rigs at a surprisingly fast rate thus raising the odds for significant oversupply in 2018, even if OPEC maintains its production cuts beyond Q1. Over the past month, the market has in effect priced in two negatives, one long-term, the other short-term.


The longer-term negative is that it is becoming increasingly evident that, under most reasonable scenarios, U.S. shale oil will be the marginal source of supply, at least until 2020. There are enough non+OPEC, non-shale production projects already in the pipeline (and which were sanctioned when prices were much higher than today) that incremental U.S. shale oil production alone can balance the market for the next two or three years. Moreover, and more importantly, it is now becoming apparent that the cost of this oil is significantly lower than was believed to be the case even a few months ago. That means the long-term price anchor for oil has moved lower. At the start of the year, the anchor was thought to be about $60 (Brent) and rising over time. Today, it appears to be closer to $50 (and possibly still falling). Prices for long-dated futures have therefore moved down to reflect this new perception.


The short-term negative is an apparent deterioration in the supply and demand balances for 2017. Until recently it looked like demand would exceed supply by as much as 1.5 million bpd if OPEC maintained its production cuts through 2017. This would have eliminated the global inventory surplus sometime in Q3 and resulted in a backwardated market. It now seems, however, that the supply deficit will be considerably smaller than originally expected – probably only around 0.5 million bpd. There will therefore still be sizeable excess stocks at the end of the year. This realization has resulted in the market moving into a steeper and uninterrupted contango with spot prices falling relative to deferred prices which, as just noted, have themselves ratcheted lower.


We discuss both these developments in more detail below. However, absent some geopolitically induced supply curtailment or a further cut by OPEC, oil prices are likely to be range bound around a level that limits the growth in shale oil production. That would mean the forward WTI strip ought to be somewhere below $50.


Shale is now the marginal barrel


Technological advances have continued to drive down well breakevens as well as expand the shale oil resource base in the U.S. In a recent report, PIRA estimated that there are now 80 billion barrels, or half of the recoverable U.S. shale oil resource base, that is economic at $50 Brent (say $48 WTI) or less. This represents some 215,000 well locations. Each of these on average can produce around 300 bpd in its first year on stream. The current horizontal oil rig count is 650 and has been growing at a rate that would bring the count to close to 800 by the end of the year. 800 rigs can drill about 15,000 wells per annum which means potentially 4.5 million bpd of gross new production. After deducting legacy decline this would translate into net production growth of more than a million bpd per annum, which exceeds the expected “call on shale” (demand growth less non-shale crude supply growth from non-OPEC, OPEC crude and other non-crude liquids). Today’s rig count or lower would be necessary to constrain shale oil growth to the 0.7- 0.8 million bpd of year/year growth in shale oil production that is probably required to balance supply and demand.


The market is therefore trying to find a price level that curtails rig additions (and/or well completion activity) to a level commensurate with the call on shale. Exactly what that price is can be debated and the truth is no one really knows. It depends on current and future rig productivity, how drilling and completion costs respond to rising oil field activity levels, the willingness of shale operators to outspend their cash flows and the availability and cost of capital to the industry.


Notwithstanding uncertainties surrounding all these variables, it does seem that the price needed for a given rate of growth in shale oil production has been falling over time. Well breakevens have dropped because of steep rig productivity gains and cyclical cost declines. They could fall further if continued secular gains in rig productivity outstrip the cyclical cost increases now resulting from higher oil field activity.


Over the past two years, average rig productivity in the U.S. Lower 48 states has grown by more than 20 percent per annum. In the Permian basin productivity grew by around 30 percent last year. These gains have been achieved through reduced drilling times from the use of pad drilling and increased well productivity from longer laterals, more intense fracking and higher proppant loadings.


Whilst the rate of rig productivity growth appears to now be moderating, it is unlikely to stop altogether. A recent Goldman Sachs analysis posits continued productivity growth for years ahead. This will be driven by higher rates of recovery of initial oil in place through the application of artificial intelligence and big data analytics. Goldman argues that this could eventually reduce breakevens to $45 and below. The best operators in the Permian like EOG already have well breakevens at, or even below, $40 WTI. As the rest of the pack catches up with the leaders, average breakevens are likely to fall further if Goldman is correct.


If the marginal cost of oil for the next 3 or 4 years really is headed to the mid-$40 range then OPEC’s attempts to push prices to $60 seem futile. It is unlikely that OPEC will find the cohesion necessary to keep prices at an artificially elevated level if all it does is accommodate rampant growth in shale oil production.


That line of thinking raises the possibility of yet another reversal in OPEC policy – abandoning supply management and letting market forces balance supply and demand. This would obviously result in significantly lower prices, at least in the short term. On the other hand, with many OPEC countries needing much higher prices for fiscal sustainability (for Saudi Arabia the level is over $80), there is an inherent instability which adds to the geopolitical risks to supply. But for now, it seems likely that OPEC, led by Saudi Arabia, will stay the course with its current policy of production restraint. Oil at $45-50 is preferable to it being at $40 or below, even if the loftier target of $60 has proven elusive.


With hindsight, OPEC’s attempts to manage supply were poorly conceived. Given the short response time of shale oil to changing prices, OPEC should have acted more quickly and more decisively. The production cuts should have been deeper and implemented immediately. As it was, OPEC talked up the market ahead of the actual production cuts thus helping to unleash a fresh wave of future shale oil production as emboldened operators upped their capex budgets and raised capital on the back of the higher prices. Additionally, OPEC ramped up production in Q4 2016 ahead of its mandated cuts, thus adding to the very stock excess they were hoping to eliminate. OPEC members also then inexplicably offset the impact of their cuts by drawing down their own inventories to maintain exports during Q1 2017. This made no sense given OPEC’s stated goal of reducing OECD inventories to their five-year average.


Fundamentals have deteriorated significantly


In implementing its production cuts at the start of the year, OPEC and its allies were aiming to eliminate the inventory excess. This would have allowed spot prices to rise relative to deferred ones, pushing the market into backwardation. A backwardated market would eliminate the “subsidy” shale operators have been realizing by selling forward to hedge production. This would therefore help curtail shale oil supply growth by removing this windfall hedging profit. But it clearly hasn’t happened. The spread between Dec 2017 and Dec 2018 futures contracts moved $3, from a $1 backwardation to a $2 contango, over the past month as it became increasingly likely that there would still be substantial excess inventories at the end of the year.


There are several explanations for why the expected supply deficit has not materialized.


  • Firstly, demand growth has been somewhat disappointing. Based on indicators of economic activity, demand in 2017 should be growing by around 1.7 million bpd, if not more. Actual growth, however, seems to be closer to 1.4 to 1.5 million bpd for reasons that are not yet clear.

  • Secondly, non-OPEC supply growth has been exceeding initial expectations – largely because of faster shale growth in the U.S. Forecast growth in non-OPEC supply for 2017 has been revised progressively higher by 0.3 million bpd. OPEC production is also now expected to be greater than seemed the case just a month ago because of the earlier than anticipated return of shut-in production in Libya and Nigeria. This will add around 0.2 million bpd of additional supply on average in 2017.

  • Finally, revisions to data for 2016 now show a small flow surplus of 0.1 million bpd whereas previously there had been a small flow deficit.

Together these changes amount to a 0.9 million bpd deterioration in the supply and demand balance for 2017 and an initially expected supply shortfall for the year of 1.4 million bpd now looks like it will be closer to 0.5 million bpd. Because of lower SPR purchases in India and China, as well as stock reductions in the OPEC countries, the drop in observed commercial inventories will be even lower – perhaps as little as 0.3 million bpd. This is much less than the rate needed to mop up the stock surplus – some 450 million bbls at the start of 2017 - and the market will almost certainly enter 2018 with a still substantial inventory overhang.


Moreover, at the rate at which oil drilling rigs have been added in the U.S., non-OPEC production has been on a path to grow by as much as 2 million bpd in 2018. With demand growth of, say, 1.5 million bpd and a 2017 flow deficit of only 0.5 million bpd, and with higher year/year production from Libya and Nigeria, that would imply an annual average stock build next year, even if the current OPEC production cuts remained unchanged for the whole of 2018, something which is by no means a given. It is this specter of renewed stock builds in 2018 adding to still inflated inventories that has panicked the market and caused the forward curve to move into contango. This reversal of the time spreads, combined with the drop in deferred prices to match a lower perceived marginal cost, has resulted in nearby prices collapsing, even though seasonal factors are becoming their most favorable.


In short, OPEC, the market and oil bulls have run out of runway. There are just 10 weeks before fall turnarounds kick in and crude stocks in the U.S. start to build again. Excess crude inventories in the U.S. are around 80 million barrels, up sharply since the beginning of June, reversing the trajectory seen in April and May when sequential crude oil draws were rapidly eliminating excess crude oil inventories.


In the past month, however, excess crude stocks in the U.S. are back to the levels seen this time last year and there now appears to be little chance that they can be eliminated before the fall – especially if the rate of inventory change seen in the data for the past three weeks is maintained. Moreover, Q4 2017 will see an acceleration in U.S. oil production as the impact of higher rig counts is increasingly reflected in higher production.


The main culprit for the disappointing stock draws in the U.S. is a stubbornly elevated level of net imports. While imports from Saudi Arabia have finally turned lower, those from other OPEC producers (notably Iraq) have risen. Crude exports have also fallen in recent weeks, at least if the preliminary data are to be believed.


Backwardation was meant to take care of excessive shale production in 2018 and beyond by driving deferred prices to levels that would constrain its growth. But stocks have not fallen fast enough to sustain backwardation so the whole futures curve has downshifted instead.


When the facts change…


For all the above reasons, it looks increasingly like oil prices will be rangebound for some time to come. Hitherto, it had been our view that oil would trend higher as prices would need to rise to a level that would justify investment in more costly sources of supply than just the core areas of U.S. shale. However, not only has the core shale oil resource grown significantly – above all in the prolific Permian basin – but breakevens have dropped because of secular productivity gains outpacing cyclical cost increases, at least for now. Furthermore, there has been no shortage of capital to fuel the growth in shale oil production and this has allowed operators to significantly outspend their cash flows. The marginal economics of the typical shale oil producer have proven to be no impediment to the industry’s resilience. The breakevens referred to earlier are based on half-cycle economics. Full-cycle costs that cover land acquisition, infrastructure and overhead are probably almost $10 higher. But companies base their drilling decisions on half-cycle costs even if this leads them on the path to eventual bankruptcy (to which the shale oil industry is no stranger) so long as they have access to capital. It’s quite possible that shale oil production growth can only be reined in by the capital markets rationing the supply of funds as industry management seems to be more focused on growth than generating free cash flow or even paper profits [ZH: this is something we have been pounding the table on since 2014, most recently in mid-June].


It also appears that the cost of developing other supply sources, such as deep water offshore, has been falling dramatically making them competitive with shale in many cases. Because of these developments, the cost curve for oil has become much flatter. There is now an abundance of potential supply at around $50 Brent. Prices will tend to oscillate around this long-term price anchor in response to changing inventory levels as the market tries to determine the right price to satisfy the call on shale. With the current inventory surplus and what looks to be its slow dissipation, markets are also likely to stay in contango, barring some sort of supply shock.


These developments call for a more opportunistic approach to the oil market than hitherto. Whereas it once seemed positions could be held with an eye to a longer-term secular appreciation, that is no longer the case. Indeed, the evidence is now in plain sight. Over the past year, the front month WTI futures contract has moved by double digits in percentage terms 10 times within a $40 - $55 band. This volatility has been accentuated by large financial flows into and out of the market by non-traditional investors and algorithmic trading systems. Attempting to capture just a percentage of those moves makes more sense than trying to ride what has turned out to be a non-existent trend, especially when contango inflicts a negative roll return on investors. The extreme volatility within a rangebound environment also argues for a more tactical and conservative approach to portfolio management.


For now, the market is heavily oversold with a record speculative short position. Q3 should still see decent stock draws even if they are insufficient to eliminate excess stocks. Also, increases in the rig count appear to be ending and could decline in the coming weeks and months. It also remains to be seen how quickly the increased drilling activity will translate into a commensurate increase in the number of completed wells and whether cyclical cost pressures will accelerate or bottlenecks develop. Already, the number of drilled uncompleted wells (DUCs) has been rising quite rapidly. There is also a non-zero chance that OPEC might surprise the market with a further “shock and awe” production cut. Taken together these considerations mean there is a good chance for a price recovery from current levels. However, this recovery will be limited for the reasons set out earlier and because of the overhang of potential selling from oil producers who are significantly underhedged for 2018.


Best regards


Andrew J. Hall


Chairman and CEO

Tuesday, July 4, 2017

Gold and Silver Price Drop of 3 July, 2017

The price of gold dropped from $1,241 as of Friday’s close to $1,219 on the close Monday, or -1.8%. The price of silver fell from $16.58 to $16.11, or -2.9%. It is being called a gold and silver “smash” (implication being that one party or a conspiracy is doing the smashing).


Our goal is to help you develop a clear understanding. The move today is no mystery. Monetary Metals makes an intensive study of the spread between the spot market—where metal is bought and sold—and the futures market.


Much analysis treats these market moves as mysterious, literally inexplicable except by reference to nefarious actors who are variously trying to make illicit profits or who act not-for-profit to somehow protect the dollar. Which they do by somehow pushing down “paper” gold. Which they do by sheer size, size being the critical characteristic to manipulate markets. However, ask anyone who has ever run a multibillion dollar fund and you will get the opposite picture. Size is a disadvantage, because when you buy, you end up with a higher price and when you sell you get a lower. At least if you are trying to make money.


In this conspiracy view, people who hold gold are long suffering, waiting for the “signal failure” when the banks can no longer hold the price down. And then it will be a moonshot to $13,000 gold (or whatever the magic number is supposed to be).


This same story has been used to explain market moves when the price was $250 and when it was almost $2,000 and today at $1,220. Don’t hold your breath. Instead, use your faculties of critical thinking. Does this make sense? And which is it, anyways? Are these conspirators supposed to be a for-profit racket? Manipulating gold and silver for their gain (in dollars) and your loss?


Or are they not-for-profit, acting without regard to their own balance sheets simply to protect the dollar… protect it from what? What bad, exactly, was supposed to happen when gold reached $1,000? That was the topic of conversation in the late 1990’s, $1,000 was a line in the sand and far away. What happened when gold hit nearly $2,000?


And what is the mechanism of this manipulation? Do they sell metal or futures? If futures, then what happens at contract expiry? If they were truly naked short, they would have to buy back the expiring contract and sell the next one. That would have a distinct signature, with each contract rising sharply into a great contango as it neared expiry (the opposite of what actually happens).


And this brings us back to the market action on Monday July 3, and the spread between spot and futures. Let’s take a look at the price of gold overlaid with the basis.


We see they are remarkably correlated. As the price drops, so does the basis from -0.2% to -0.4%, or -20bps.


This is a picture of selling primarily in futures. Speculators got flushed for whatever reason. The price fell, but our calculated fundamental price barely moved from $1,334 to $1,331.


Incidentally, in the Supply and Demand Report yesterday we noted that the cobasis of the August contract was 0. It is now +0.2%, aka backwardated.


Here is the graph of the silver action.


The silver basis fell from -0.36% to -0.92%. Like gold, the selling in silver was predominantly futures.


A word on this is appropriate. When we say “primarily” or “predominantly” we refer to which market was leading. The absolute change in the spread is very small relative to price. If there had been no selling in spot, and the futures price had dropped by 47 cents, then there would be a 47-cent backwardation. In such case, we would be bellowing from the rooftops about the broken silver market!


Paraphrasing our old buddy Aragorn, the day will come when there is 47 cents of backwardation in silver. But today is not that day!


There was plenty of selling of metal also. It’s simply that the selling of metal was trailing the selling of futures, pulled along by arbitrage and lagging behind.


It makes sense that most big price moves are driven by the futures market. Futures are made for trading: they have low costs, great liquidity—and leverage.


The silver cobasis was also 0 on Friday. It is now +0.6%. Our calculated fundamental price of silver is up 9 cents to $17.94.


Monetary Metals will be exhibiting at FreedomFest in Las Vegas in July. If you are an investor and would like a meeting there, please click here.


© 2017 Monetary Metals