Showing posts with label Alpha. Show all posts

Monday, December 18, 2017

Vince McMahon Considers XFL Relaunch As NFL Fans Evaporate

WWE owner Vince McMahon is considering bringing back his ill-fated football league, the XFL, amid sagging NFL viewership and a racially charged kneeling epidemic of players who won"t stand for the National Anthem which began during the summer 2016 pre-season. In a recent "30 for 30" documentary about the XFL, McMahon and his partner in the 2001 endeavor - former NBC Sports chairman Dick Ebersol, pondered the possibility of relaunching the league once promoted as having fewer rules and rougher play than other leagues.


Vince McMahon


“I don’t know what it would be,” McMahon told Ebersol, adding “I don’t know if it’s gonna be another XFL or what it may be or how different I would make it. It seems like in some way it would tie in either with the NFL itself or the owners.”


Then, on Friday, journalist and pro wrestling fan Brad Shepard tweeted "EXCLUSIVE: Vince McMahon is looking to bring back the XFL and may announce it on January 25th, 2018." Then on Saturday, Shepard said that McMahon pointed to the "30 for 30" interview 


Without much else to go on, Deadspin"s David Bixenspan approached the WWE - which neither confirmed nor denied the rumor, but did state that McMahon is "personally funding a separate entity from WWE, Alpha Entertainment, to explore investment opportunities across the sports and entertainment landscapes, including professional football," followed by another tweet stating that WWE has filed for two new XFL trademarks this year.  


And while the NFL has recently instituted a concussion protocol to address the league"s growing brain injury epidemic, perhaps a rougher, more violent version of the NFL is exactly what America needs right now.


As Mike Florio of PFT writes, 


Arguably, the time may be right for the XFL or something like it. A November 2016 Sports Illustrated article regarding the current state of football in America created the distinct impression that fans want old-school football, with all the big hits and none of the obsessions over safety.


Those attitudes from fans coupled with the messages that invariably will be sent by the incoming Commander-in-Chief,” we wrote on November 16, 2016, “suggest that the time may be right for someone to roll the dice with $250 million or so in the hopes of launching a football league that would essentially operate like a modern-day XFL — loud, proud, violent, brutal, bloody, and everything that the NFL was before political, legal, and social sensitivities forced the league to change.”


Is Vince McMahon going to make football great again? 


Wednesday, December 6, 2017

The Moment The Market Broke: "The Behavior Of Volatility Changed Entirely In 2014"

Earlier today we showed a remarkable chart - and assertion - from Bank of America: "In every major market shock since the 2013 Taper Tantrum, central banks have stepped in (even if verbally) to protect markets. Following the Brexit vote, markets no longer needed to hear from CBs as they rebounded so quickly that CBs didn’t need to respond." As a result, buy-the-dip has a become a self-fulfilling put.


The immediate result of this dynamic has been two-fold: i) investors now buy every dip, or as Bank of America notes, "Investors no longer fear shocks, but love them, as it is an opportunity to predictably generate alpha.", and ii) selling of vol has become a self-reinforcing dynamic, in which lower VIX begets more vol-selling by "yield-starved investors", leading to even lower VIX as the shock that can reset the feedback loop is no longer possible, and thus the strike price on the Fed"s put can not be put to a market test.


These observations prompt BofA"s derivatives expert Benjamin Bowler to ask the rhetorical question: "volatility: new normal or bubble?" and answer: "It"s a bubble." Indeed it is, but absent the abovementioned market-clearing shock, it is difficult, if not impossible to anticipate what can burst this bubble.


In the meantime, the market has spawned some spectacular distortions, including the following observation: "As one measure of volatility, the Dow Jones Industrial Average traded in its tightest trading range since 1900 this year." Here is Bowler:


While asset valuations are not at life-extremes, volatility is. In 2017 the Dow traded in a 110yr record tight trading range, the VIX hit all-time lows, and US equities reversed from sell-offs at near their fastest pace in 90 yrs. Investors no longer fear risk but love it, as it’s another opportunity to harvest “dip-alpha”. Volatility across asset classes has decoupled from uncertainty. Even if seemingly irrational, apathy to all risk has been the right trade and an impossible trend for most to fight – the definition of a bubble.


A bubble, he adds, "induced by years of heavy handed central bank influence, where investors have learned that it has not paid to panic." Bowler asks readers to consider the following:


As one measure of volatility, the Dow Jones Industrial Average traded in its tightest trading range since 1900 this year


Near 90yr records are occurring in the speed that US equities are recovering from dips


The VIX is near 26yr lows despite political & policy uncertainty recently near 26yr highs


Gold call options price less than 1 in 100 chance of rising North Korean tensions in the face of rising North Korean tensions


The above leads Bowler to concludes that "while there is active debate about whether risk-assets like equities and credit are overvalued, it is much harder to argue that currently depressed volatility levels are unsustainable when near 100yr records in terms of low vol and the lack of persistence of any shock are being recorded."


So when did the market "break", and when did the behavior of volatility change so dramatically?


This overarching question has been plaguing Wall Street strategists for much of 2017. In July, we presented one answer from Deutsche Bank"s Aleksandar Kocic who pointed out the divergence between the economic policy uncertainty index and the VIX, which took place roughly in 2012, prompting the derivatives expert to conclude that something "snapped" roughly around that time, or as Kocic said, sometime in 2012 it was as if the markets “lost their capacity to deal with uncertainty.”


Bank of America takes a somewhat different approach, and instead of looking at the divergence between volatility and news - or shock - flow, highlights the moment BTFD became religion.


According to Bowler, "the nature of volatility since 2014 has entirely changed, with volatility shocks retracing at record speed. Investors no longer fear shocks, but love them, as it is an opportunity to predictably generate alpha." This is demonstrated in the following stunning chart which not only shows that every VIX dip is now just an opportunity to buy it, but that the market"s "fragility" is at an all time high based on the surging frequency of vol spike events, which in turn, and paradoxically, reassure investors that a central bank backstop can not be too far away.


BofA is hardly the first to point out this phenomenon: almost exactly one year ago, it was JPM"s "quant wizard" who highlighted precisely the same, if not through the perspective of VIX but the overall market response to recover from "shock" events:


It appears that the time horizon of macro traders has shortened, likely as a result of increased participation of machines and algorithms that are quicker to adjust to significant events and can eliminate trading activity of slower investors. Consider for example the US elections - traders in Japan registered a 5.4% Nikkei drop on the 9th, followed by a 6.7% rally on the 10th, while S&P 500 investors did not register a significant close-to-close move over the election (due to market hours difference). These two days were enough to shift the volatility regime (usually calculated from closing returns) for the whole of 2016 for the Japanese equity market, and leave it unchanged for S&P 500 (e.g. think of rebalancing needs of a hypothetical risk parity fund, or a short volatility strategy based on Nikkei vs. one based on S&P 500). We also noticed that for a number of significant catalysts this year (Brexit, US Election, Italy Referendum) broad expectations were wrong both on the outcome and the directionally forecasted impact. It is possible that the lack of market reaction (or a reaction that went against the accepted narrative) was in part driven by investors’ reluctance to transact (“two negatives equal a positive”).


Ah yes, the infamous "investor reluctance to transact", which has only gotten worse as we hinted in our "trader paralysis" post, and which Goldman demonstrated vividly just last month when the bank showed that hedge fund turnover has now dropped to an all time low as virtually nobody trades anymore.


Whatever the reason behind the broken market, however, whether it is central banks, machines, algos, risk parity funds, vol-targeting strategies,  self-reinforcing "Pavlovian" dynamics, or simply traders no longer trading, the question is what comes next? While we will have a more detailed breakdown in a subsequent post, here are Bowler"s three questions, and several answers of what to expect in 2018:


As we enter 2018, three questions are top of mind when it comes to volatility:


  1. Is 2018 the year when vol begins to normalize, or is this the “new normal”?

  2. As low vol threatens to sow the seeds of the next crisis, how will this end?

  3. Where does vol go in the longer-run; can we ever see the old-normal return?


Vol likely to rise off extreme lows; ’87 crash unlikely, but so is VIX averaging 20 While we will look at each question in more detail in turn, the short answers are:


  1. Higher not lower vol: We think 2018 is most likely to see higher (not lower vol) as the Fed builds more “ammunition” in terms of rate-hikes leaving them less sensitive to financial market conditions (i.e. pushing the Fed put strike lower), and as CB balance sheets peak in 2018.

  2. Vol bubble more likely to deflate than explode: While the risk of “fragility” shocks due to positioning and feeble liquidity is high, we think the level of leverage today, which is lower compared to the last time vol was this depressed (2007), does not present the same risks as then.

  3. Vol to remain low vs. long-run average: However, to the extent we remain in a low inflation/low rates environment, we may also remain in a lower than normal vol environment. So while VIX near 9 is an unsustainable bubble, VIX at 20 (the long-run average) may also be unsustainable in a slower growth world.


And BofA"s conclusion:


What to watch for? In a world slaved to rates, inflation remains key


From a macro perspective, we continue to believe unexpected inflation is the kryptonite for volatility. Inflation presents a “triple whammy”, first driving economic vol higher, destabilizing bond markets (and putting bond/equity correlation at risk), but importantly handcuffing central banks from being as sensitive to financial markets. In other words it both drives fundamental risk higher and significantly impairs the protection markets have become dependent on. Rising rates vol is key to watch.


How bad can it get? From here Aug-15 shock likely but ’87 crash is improbable


Interestingly, while the world is hyper-focused on how big the “short-vol” trade is, history shows that any liquidity shock large enough to create an equity bear market (20% fall in equities, similar to 1987 or LTCM crisis) provides a forewarning in terms of rising volatility first (look for S&P vol to double from 10 to 20). Fragility shocks (similar to Aug-15) that happen without warning remain the bigger risk today in our view.


So, how do you trade this? Long “vol beta”, cheap options for direction


The most important question is, how do you trade this environment where investors have given up on risk (or have learned to love it as buying dips has been “free money”). Evidence of a “bubble in apathy” is strong, and we believe it is unsustainable. However, the problem with any bubble is not recognizing you are in it but rather timing its end. Hence the key is finding trades that will profit from a change in environment but carry well and hence don’t require perfect timing. The beauty of today’s low vol is that it can be cheap to own optionality (for example for upside stock replacement) which affords the benefit of not having to time when markets may peak.


Does this mean short vol is a bad idea? No, but it needs to be smartly managed


Importantly, believing that today’s low vol is unsustainable does not mean all short vol positions are bad. Don’t forget, owning any risk asset (equity, credit etc.) is a short-vol trade. The key is finding the best short vol opportunity (highest risk-adjusted returns), while managing downside risks appropriately. Harvesting rich vol risk-premia is key to funding cheaper long vol positions elsewhere.


Friday, December 1, 2017

Yes, Cash Is An Asset Class Again!

Authored by Steven Vannelli via Knowledge Leaders Capital blog,


In a US Dollar bull market with interest rates at zero, cash is rightfully dismissed as a non-asset class. But, when the US Dollar is in a bear cycle, things change, irrespective of what US interest rates are.


There are a handful of indicators we use to identify US Dollar bull and bear cycles.


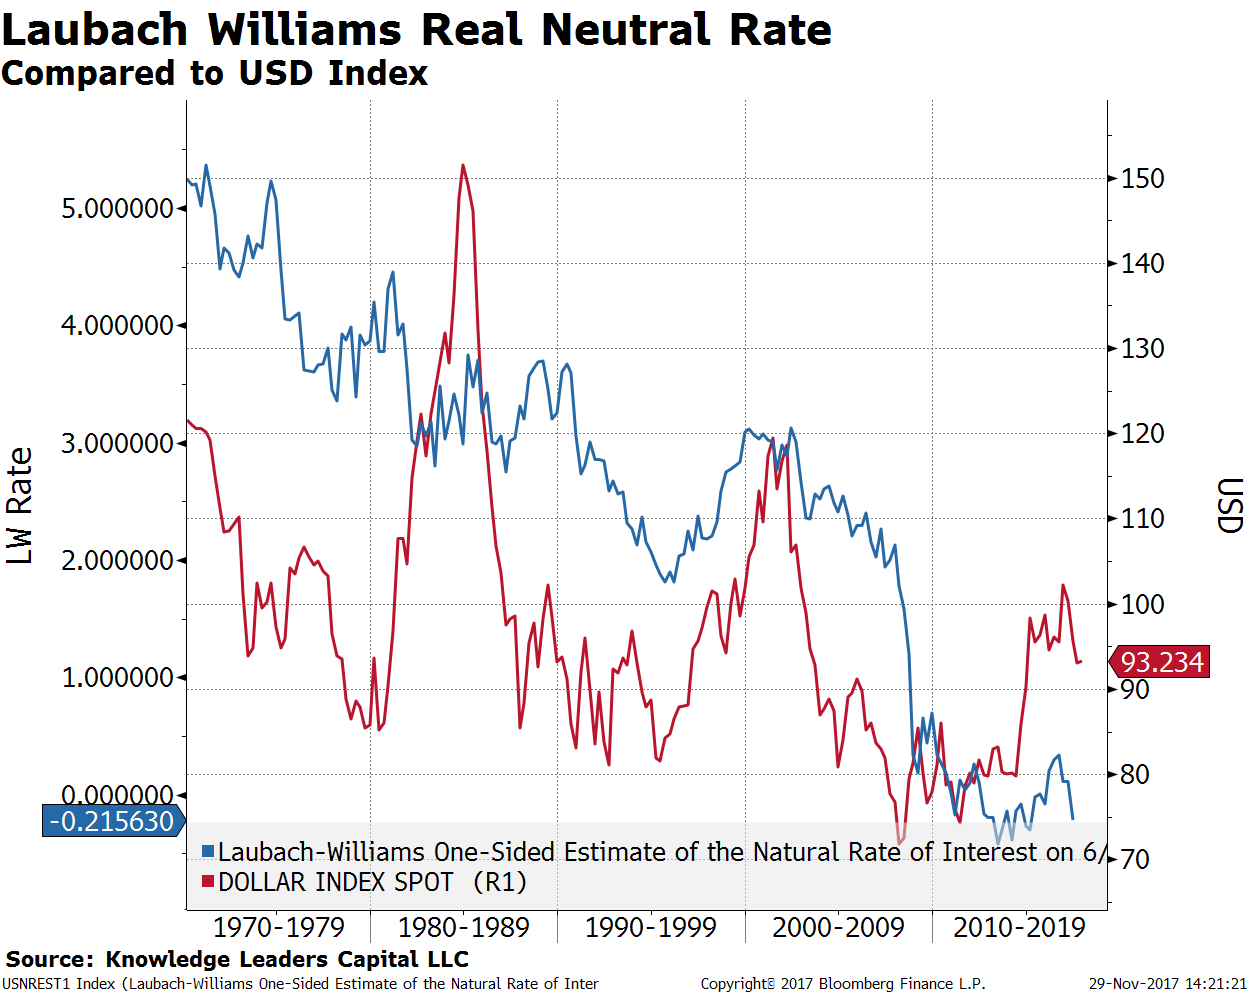
One indicator - the Laubauch-Williams (LW) Real Neutral Rate - has gained traction with the Fed and is often referred to as r-star. It is a measure of the real (after inflation) neutral interest rate that the US economy can handle without stimulating or restraining the economy. Over time, the LW Real Neutral Rate is one of the better signals for the US Dollar.


Every US Dollar bull market since 1970 has been marked by an increasing LW rate. In the chart below, I plot the LW Real Neutral Rate (blue line, left axis) against the US Dollar Index (red line, right axis). In the early 1980s the US Dollar bull market occurred with the LW rate rising from about 3% to about 4%. Similarly, the US Dollar bull run of the late 1990s occurred with the LW rate rising from just over 2% to just over 3%. The most recent US Dollar bull market has been no exception. While admittedly harder to see because the numbers are so small, the most recent US Dollar bull occurred with the LW rate rising from around -.5% to about +.3%.


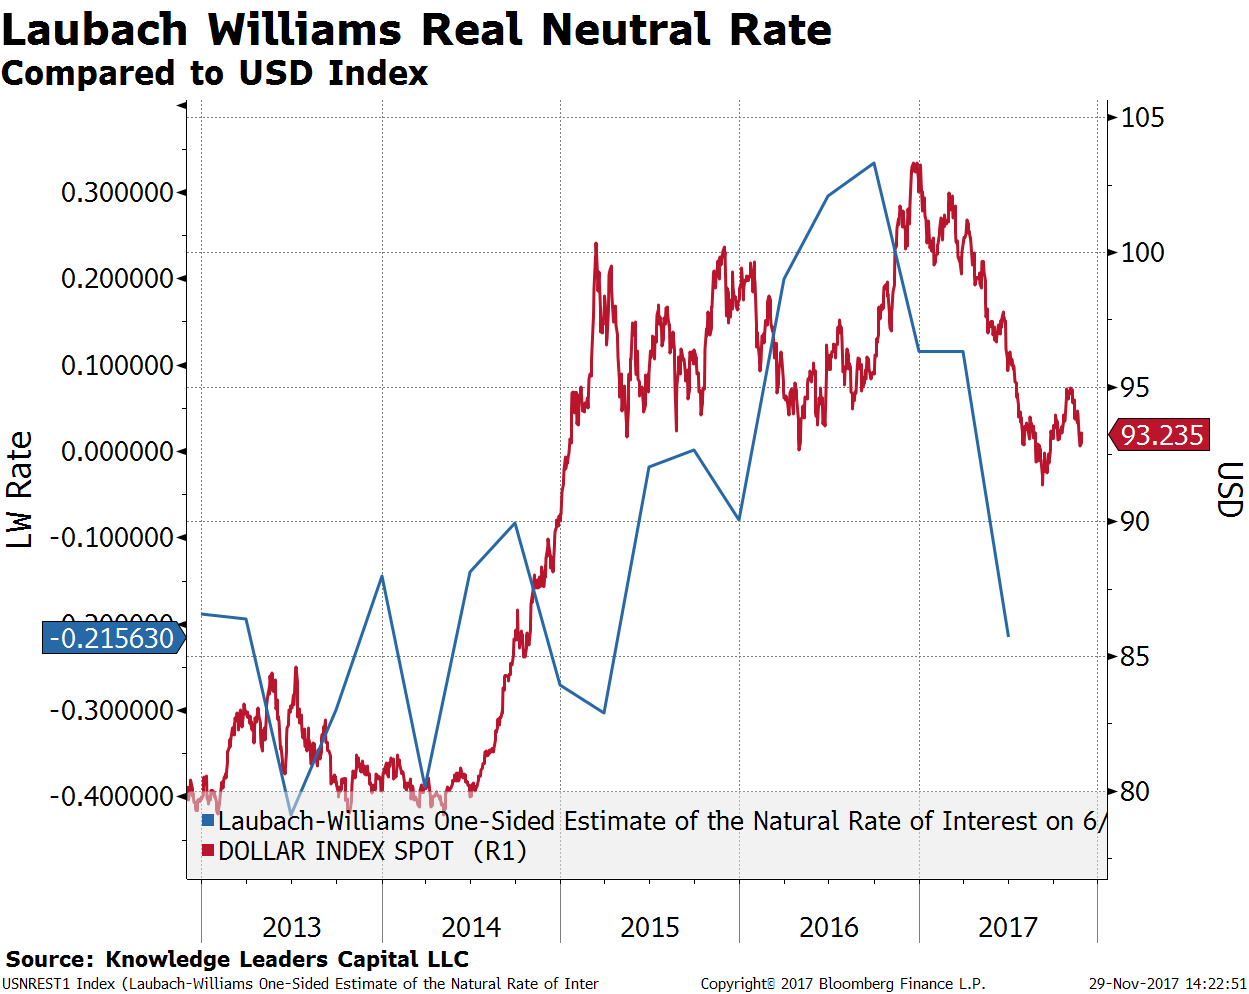
This relationship suggests the US Dollar bull run has come to a conclusion as the LW Real Neutral Rate has rolled over again. In the chart below, I focus on the last five years. Notice the US Dollar following the trend in the LW rate. The pop in the LW rate in the first quarter of 2014 led the 25% gain of the US Dollar from mid-2014 through early 2017. Notice also that the LW rate peaked in mid-2016, having fallen back by about 50bps in the last few quarters, leading the peak and decline in the US Dollar.


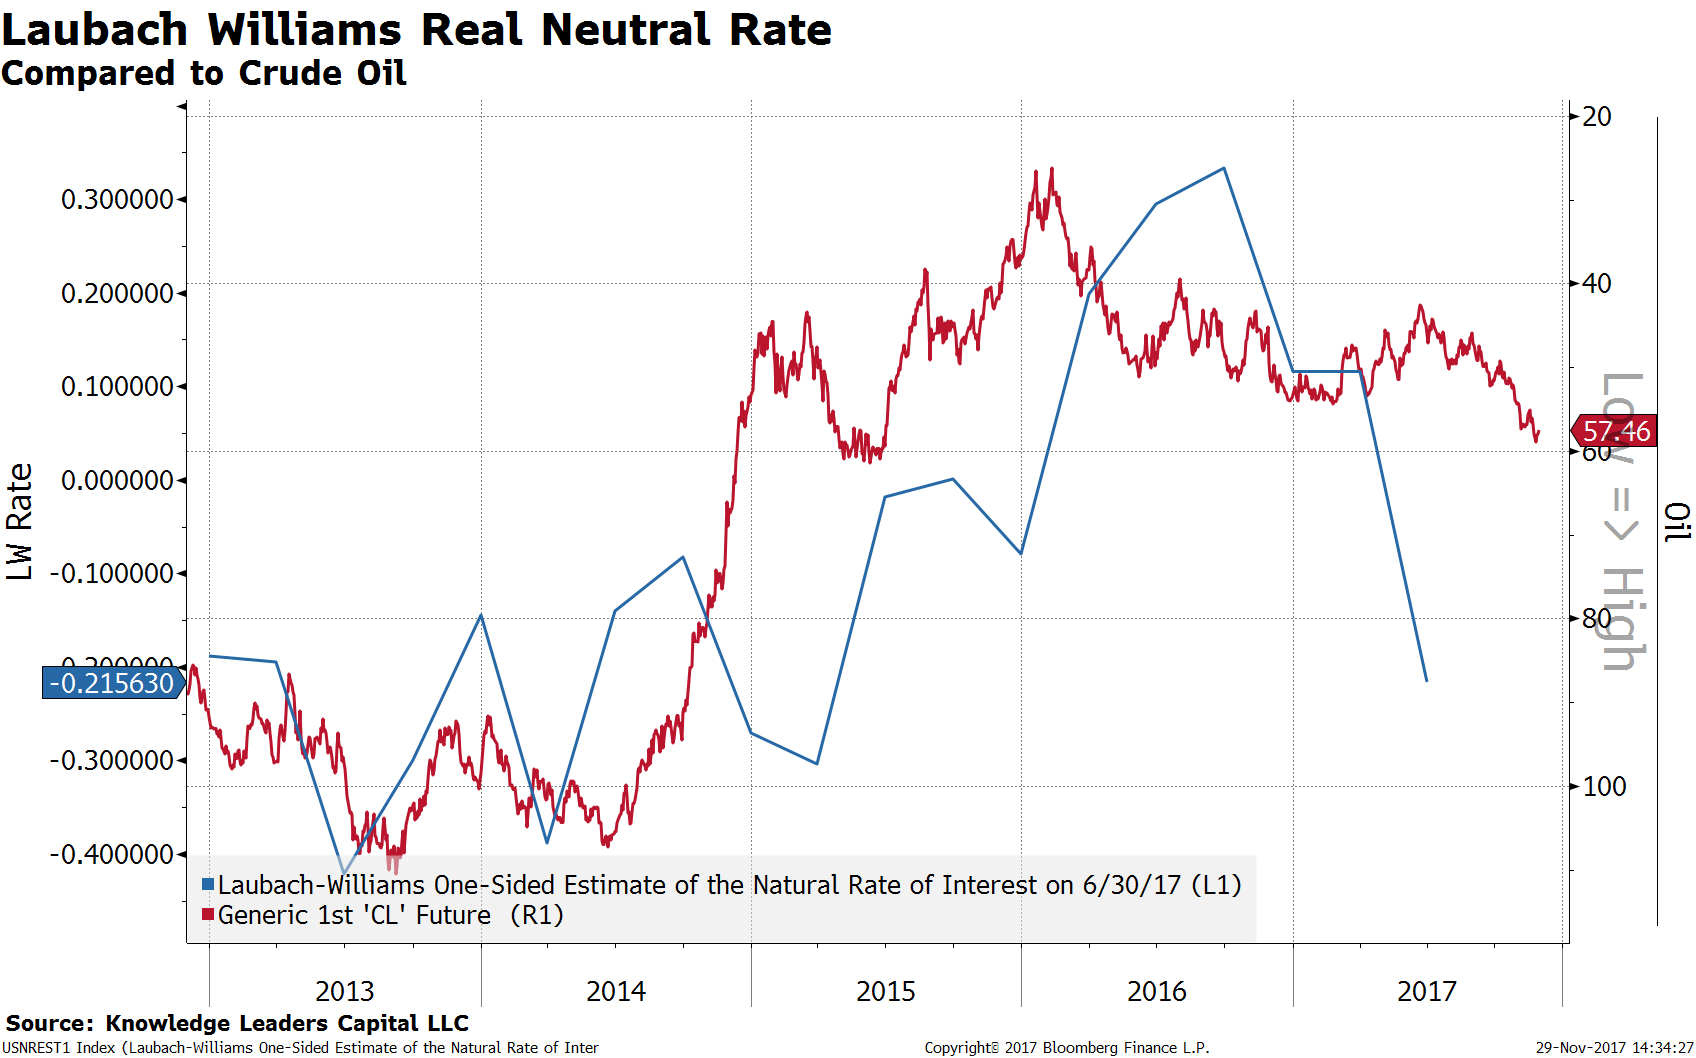
The fact that the LW rate has declined for three quarters in a row suggests this isn’t a temporary fluke. It is likely driven by the slow turnaround in oil prices. In the chart below, I plot the LW rate against oil prices. Simply, falling oil prices (red line, right scale, inverted) pull the LW rate (blue line, left axis) up. And, the reverse is true also that rising oil prices dampen the LW rate.


So, if we are now in a US Dollar bear market, driven by, among other factors, a falling LW rate and rising commodity prices, the good news is that cash is an asset class again.


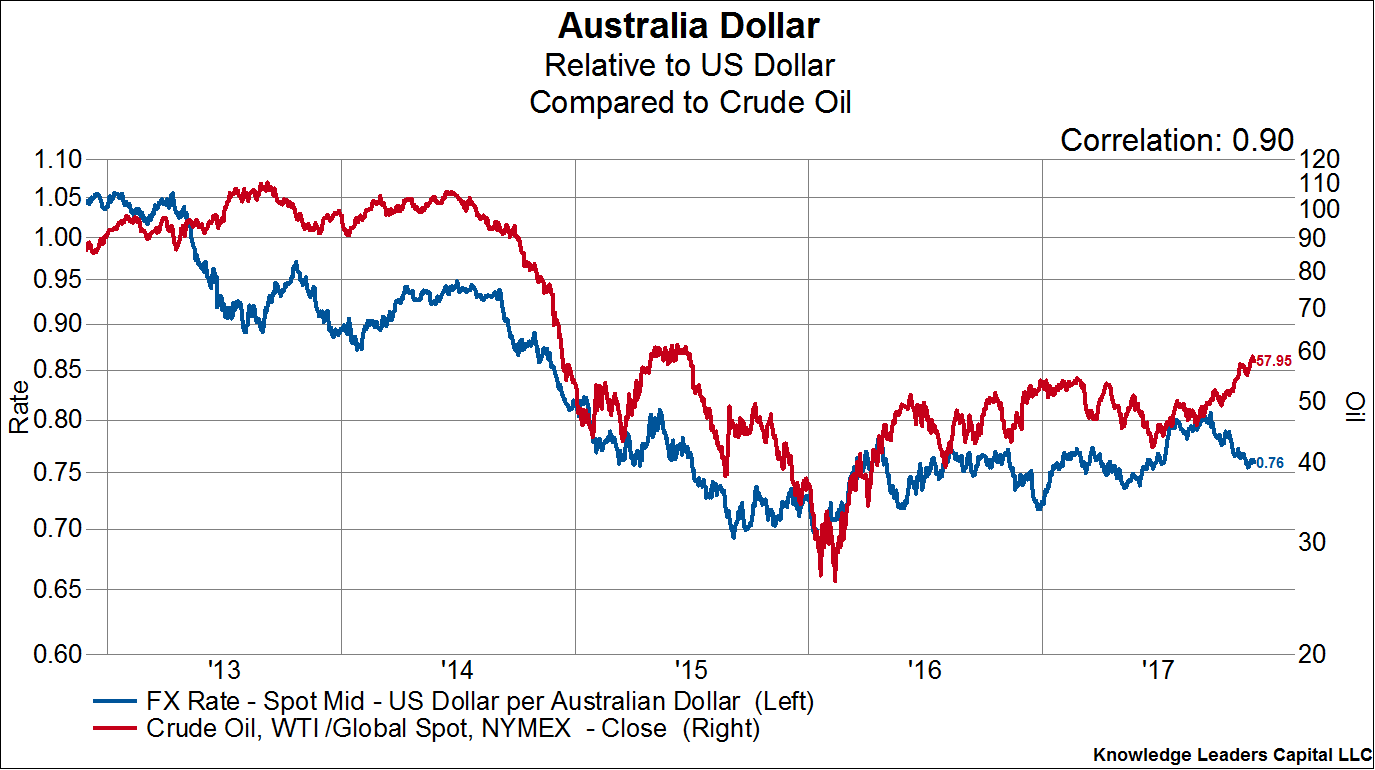
Which currencies should investors focus on? An easy place to start are those currencies with the tightest linkages to oil prices.


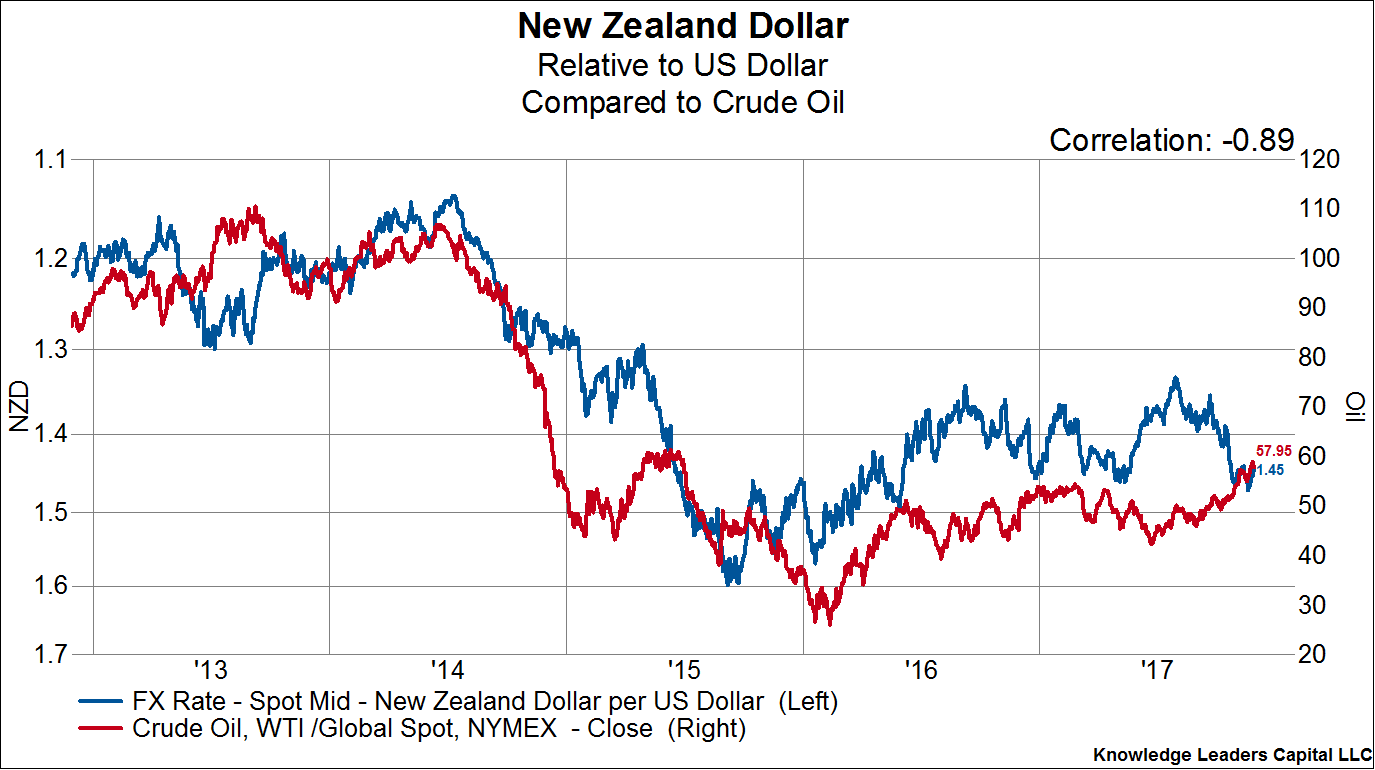
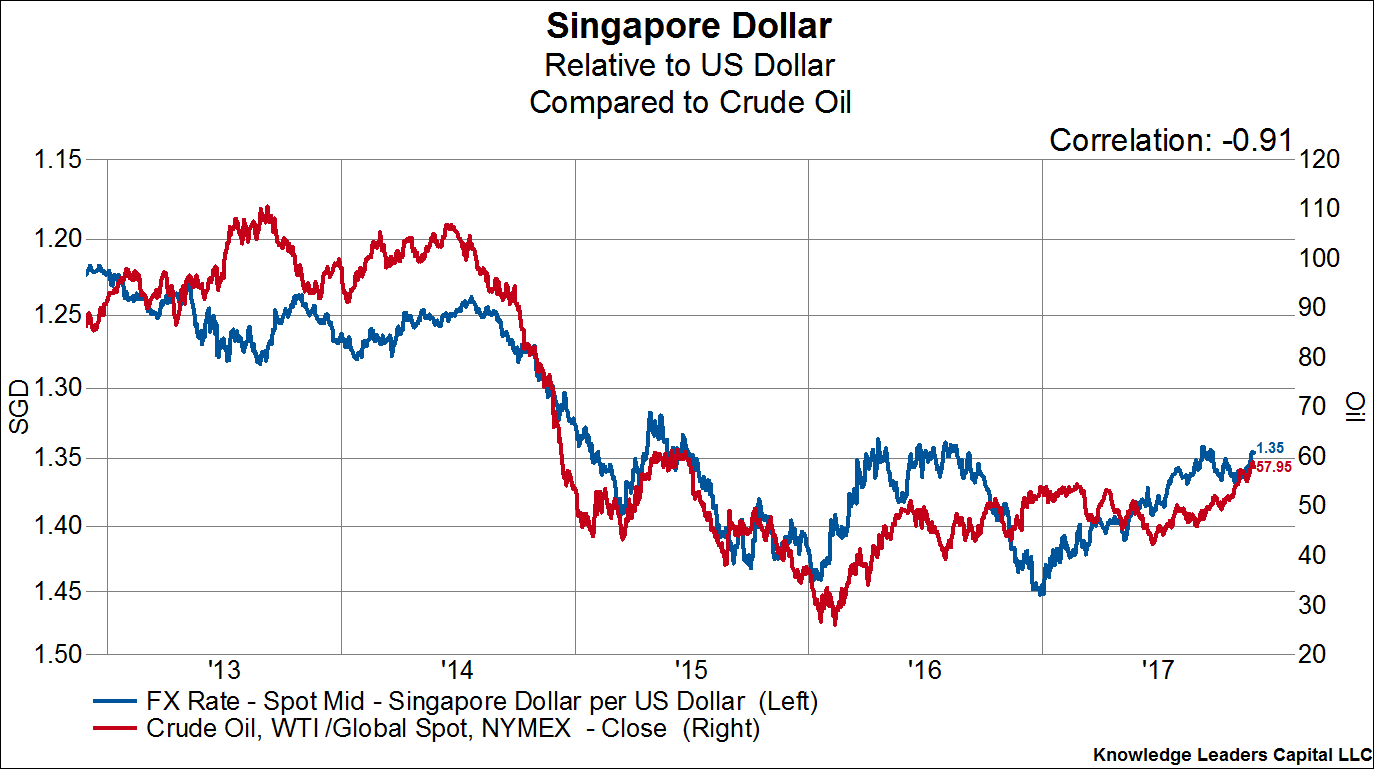
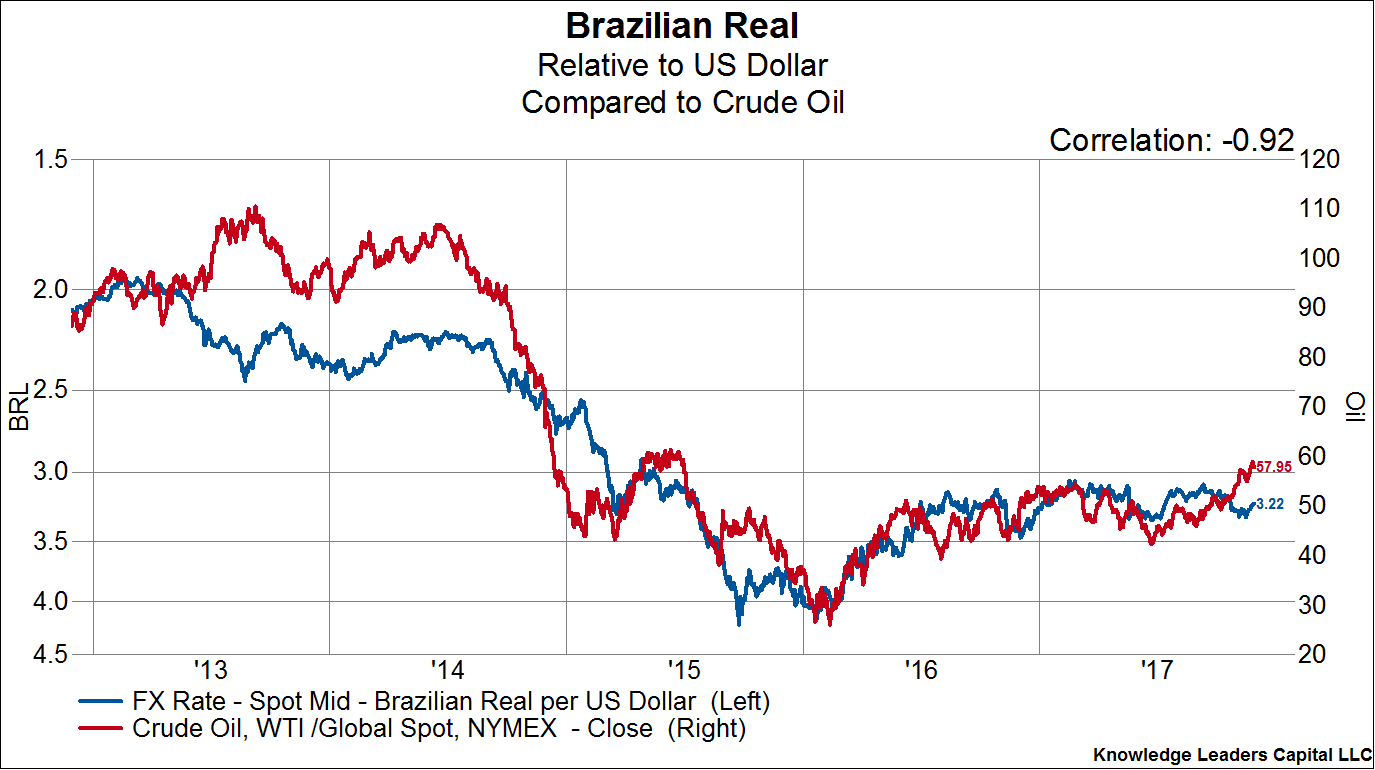
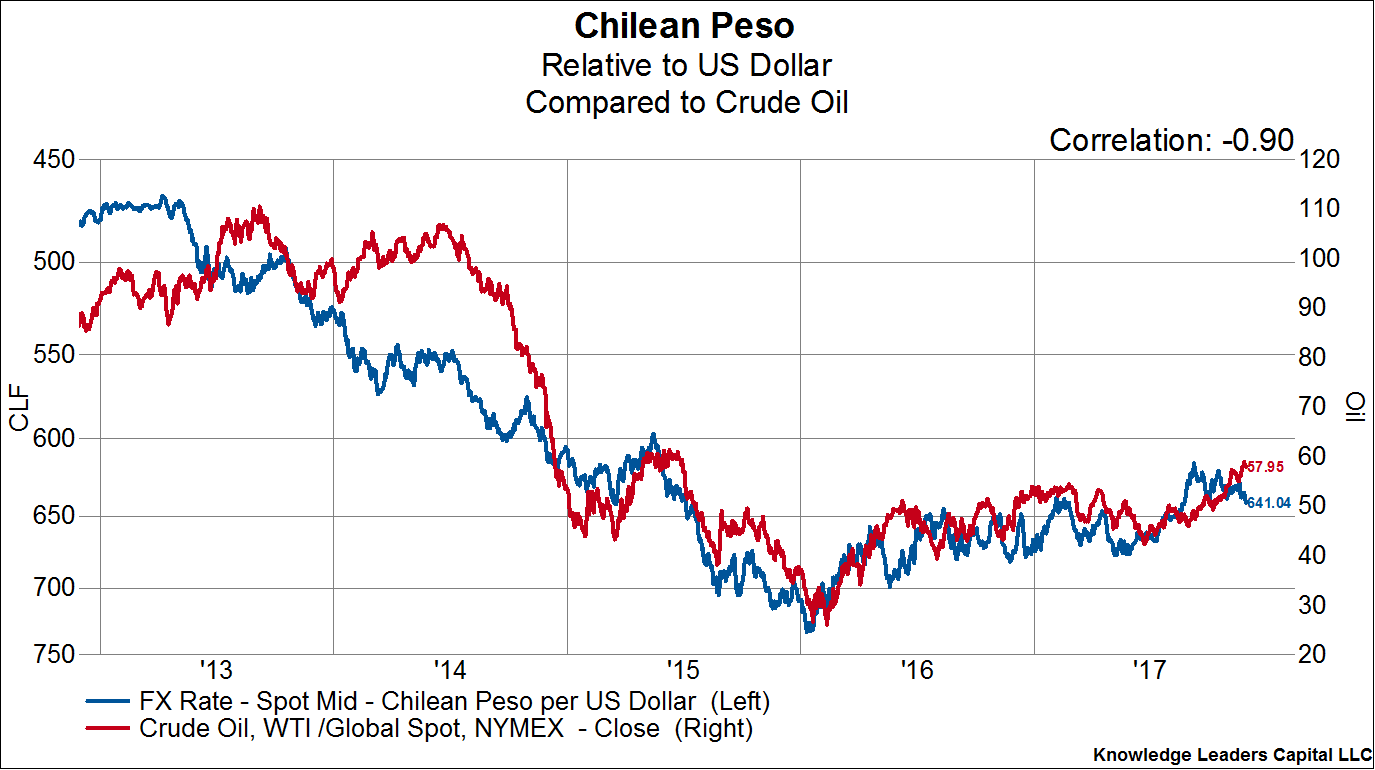
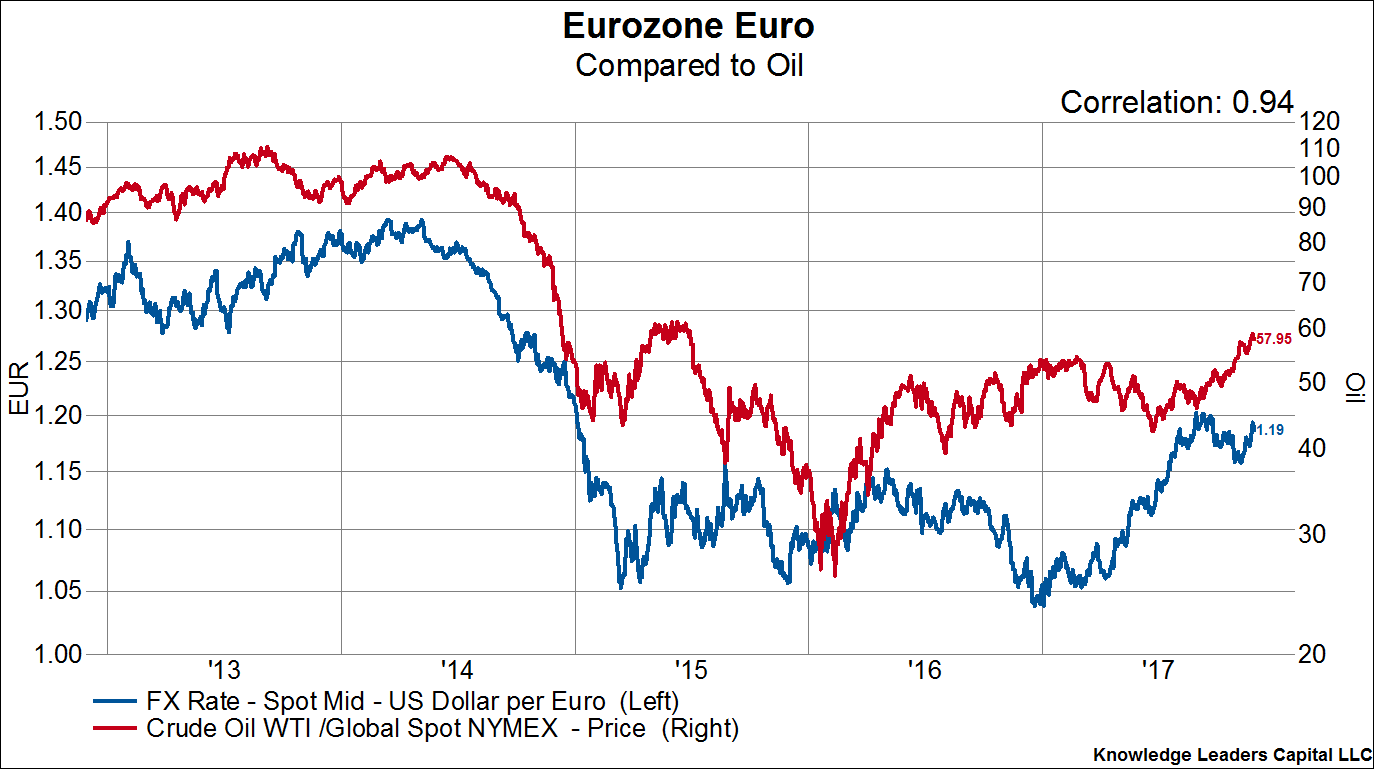
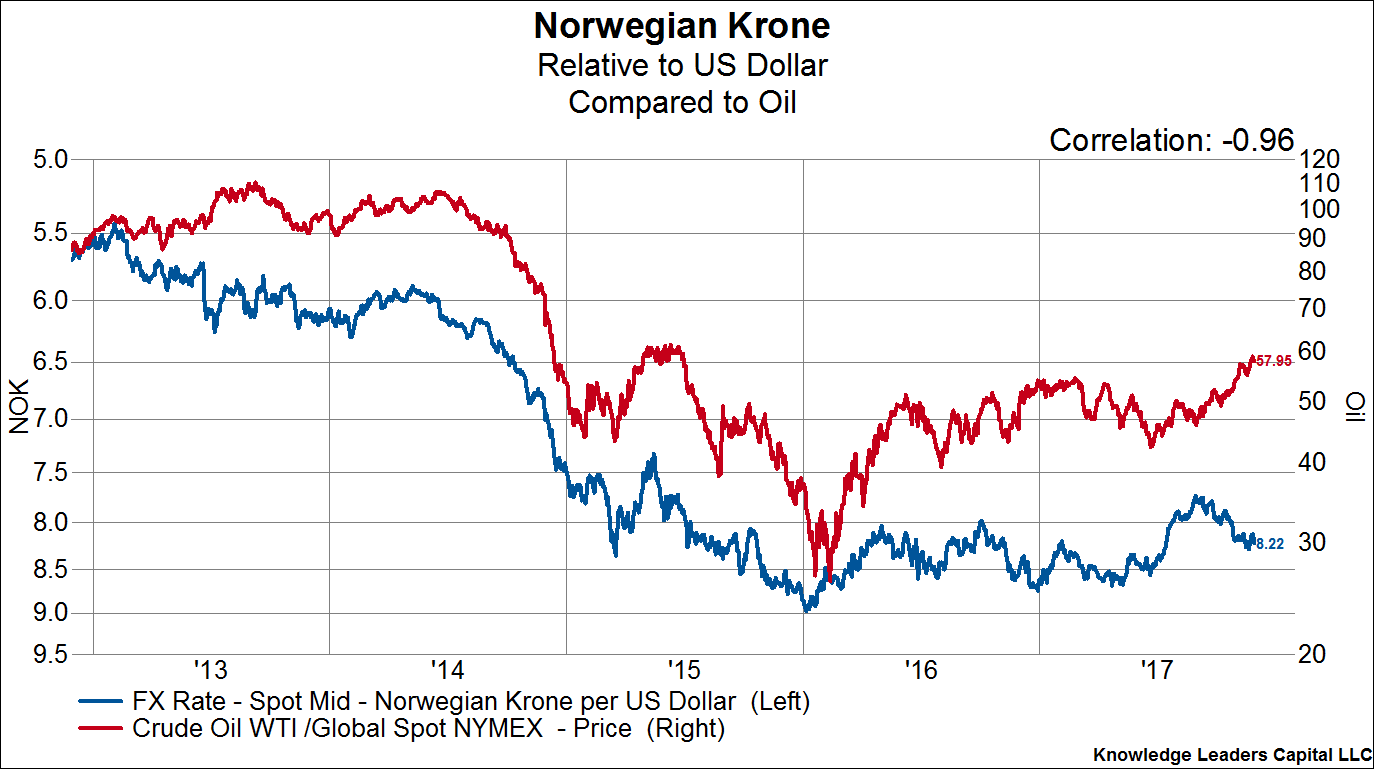
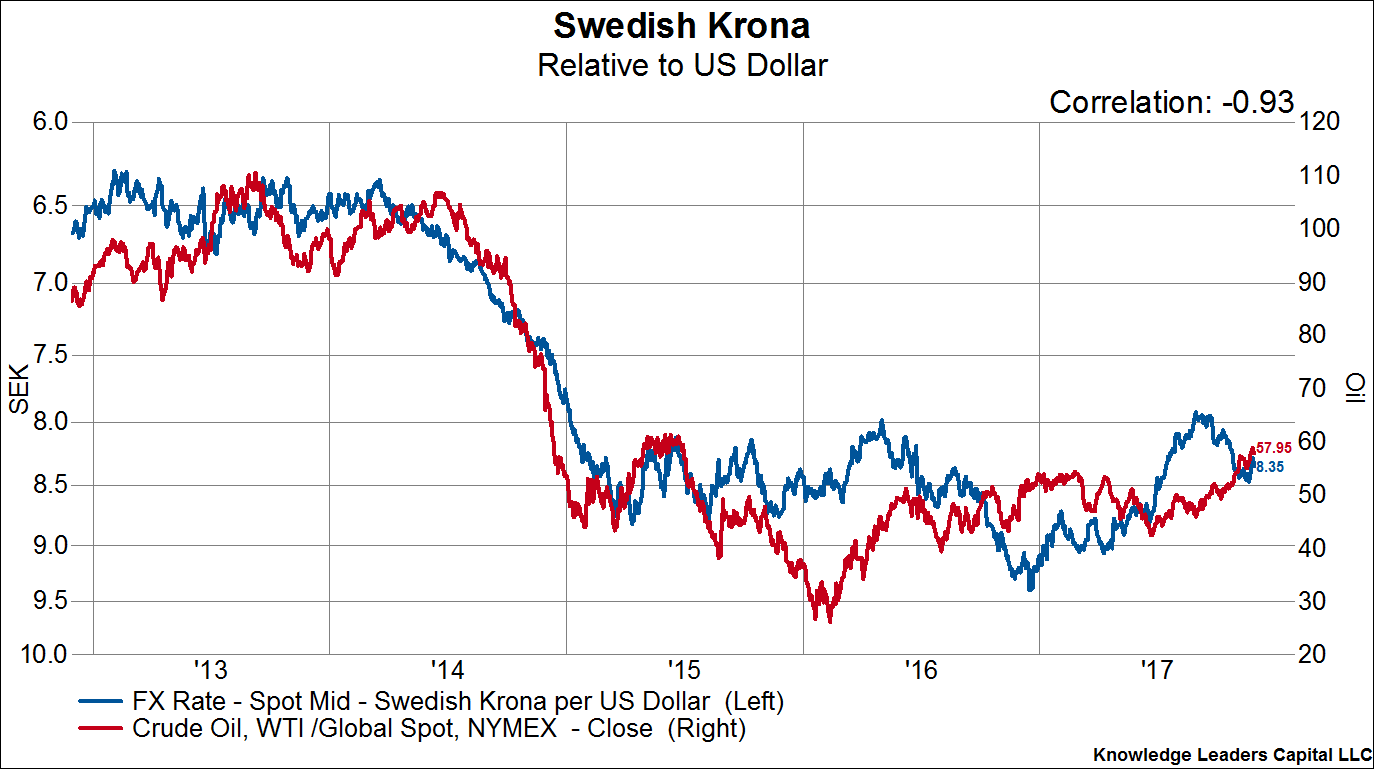
Let’s start in Asia. Among interesting developed market options for a cash allocation are the Australia Dollar, Singapore Dollar and New Zealand Dollar. In each chart below, I plot the US Dollar FX rate against oil prices, with the correlation shown in the upper right corner.


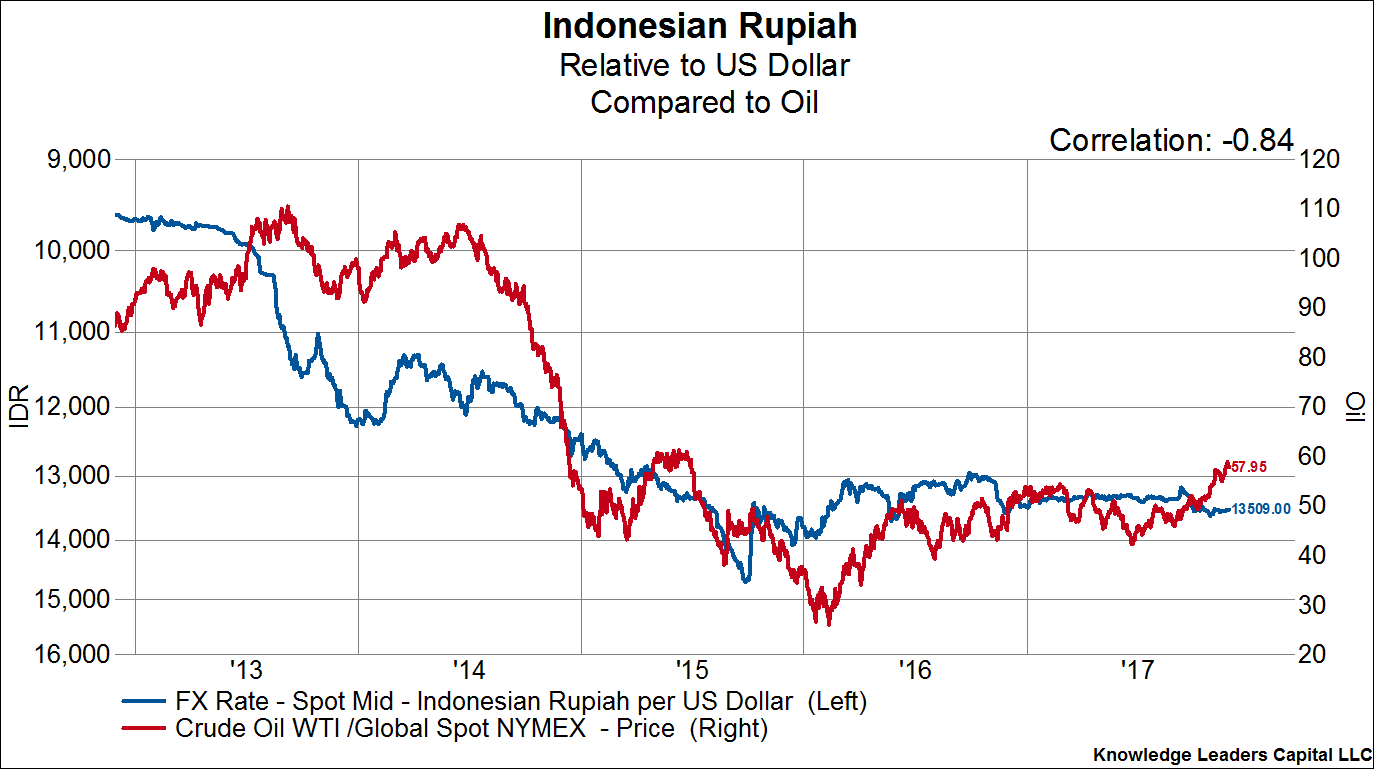
Among emerging market currencies in Asia, the most interesting are the Indonesian Rupiah and Thai Baht.


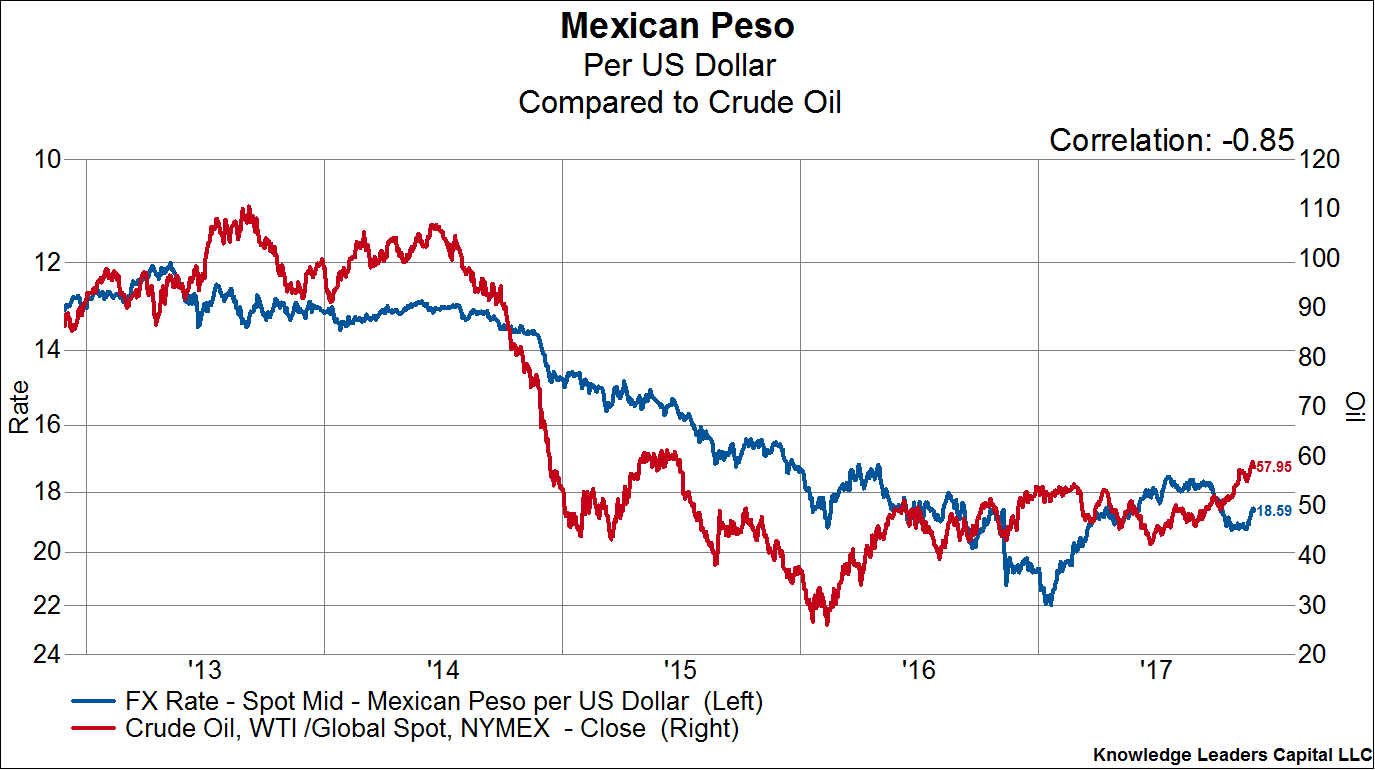
Moving to the Americas, the Canadian Dollar, Mexican Peso, Brazilian Real and Chilean Peso all look interesting.


Moving on to Europe, the most interesting currencies are Euro, Norwegian Krone and Swedish Krona.


While there are many asset allocation decisions that hinge on whether the US Dollar is in a bull or bear market cycle, one of the easier is currency allocation. An investor following an Anything but US Dollars policy has the chance to capitalize on the new US Dollar bear market. Cash is now an asset class again, and this creates new possibilities for alpha generation and risk management.


Sunday, November 26, 2017

Citi"s Shocking Admission: "There Is A Growing Fear Among Central Bankers They"ve Lost Control"

Earlier we showed a variation on a VIX chart from Citi"s Hans Lorenzen which, if it doesn"t impress, or scare you, then nothing probably will.


However, leaving readers unimpressed - and unscared - will not satisfy Lorenzen, which is why the credit strategist who works together with the godfather of rational doom, Matt King, and has been warning for weeks that now is the time to sell credit, unloads in one of the more effusive missives of dripping negativity to hit during this holiday week when one after another equity sellside analyst has been desperate to outgun each other with their ridiculous 2018 year end S&P forecasts.


And while Lorenzen touches on many things, at its core, his warning is straight out of Shumpeter: the longer nothing changes, the greater the crash will ultimately be, a topic which DB"s Aleksandar Kocic dissected over the summer, even defining an entirely new term in the process: metastability.


So without further ado, here is Lorenzen explaining why "embellishing the status quo will be the market’s undoing.


Ultimately, extreme valuations, the lack of risk premia, and a lack of responsiveness to tail risks are merely symptoms. The real question is what the skewed incentive structure resulting from that backstop has done to the fabric of markets after so many years. To our minds the answer is that trades and strategies which explicitly or implicitly rely on the low-vol environment continuing, are becoming more and more ubiquitous.


Realised historic vol is de facto an exogenous input to much of the risk management framework that underpins modern finance. With lookbacks extending a few years, an extended period of market stability reduces VaR measures and improves Sharpe ratios. Both allow / encourage investors to take more risk – driving valuations higher and vol lower still, creating a self-reinforcing dynamic. Intuitively, returns should follow flows – money is deployed and the asset price goes up. But in the real world the causation works the other way.


What this means in real-world terms:


Long periods of one-way markets breed survivor biases. The fund manager with lots of beta outperforms, the cautious fund manager underperforms. Either the latter gets on the bandwagon or soon enough outflows from the fund will ensue. Over time, fewer and fewer “critics of the regime” are left standing.


In an asset class where the upside is constrained, like in credit, that dynamic is further reinforced by the fact that a fund manager has to take more and more beta relative to benchmark in order to sustain the level of excess carry that will merely cover costs. The lack of volatility and the super high correlations between credits and the index (Figure 24), leave precious little scope for alpha (Figure 25).


Here we can add another piece to the short vol conundrum, because the closer spreads get to the lower bound, the more explicitly being long credit in itself becomes a short-vol position. With less and less upside remaining, owning credit risk become a question of generating a small amount of carry (or premium) for taking future downside risk – essentially, akin to selling a put option.


Meanwhile, as spreads collapse, as dol implied and realized vol, we are all “happily” ignoring that more risk is being issued into the market than ever before (Figure 26) and that the credit quality of the market keeps slipping – for the first time ever the market cap of the BBBs is about to overtake the rest of the € IG index (Figure 27).


What happens next should be familiar from the last financial crisis: the infamous step up in risk:


When the conventional asset class of choice no longer offers a “decent” return potential, money looks to the next one on the quality spectrum for a pickup. IG funds holding BBs and AT1. DM funds buying EM debt. European and Asian funds holding more and more $ fixed income. Corporates moving their liquidity from money markets to short-dated IG credit funds. Mandate creep in the investment criteria. Even synthetic structured credit is making something of a comeback. The list of tourist trades goes on and on. Most of these too are predicated on the status quo - if volatility and risk premia were to rise, retrenchment back towards the original / natural asset allocation would be swift and uncompromising.


And then, one day, the market will finally discount that the central banks are no longer set to injection trillions in liquidity: that"s the moment the public finally begins to admit the emperor is not wearing any clothes.


You could rightly argue that many of these factors are generic to every bull market. The fact that volatility clusters is exactly because of these (and other) selfreinforcing dynamics. But the implicit ceiling on vol / cap on downside from the central bank backstops has, in our view, allowed them to run for much, much longer than would have been possible in a market operating on its own devices.


You could argue that there is nothing to worry about as long as fundamentals remain strong. But those looking at the economic data, corporate earnings or leverage trends to indicate the next turn in markets are looking in the wrong place, if you ask us. Over the last 50 years, only 2 out of 19 corrections in US credit were led by a recession. 12 had no overlap with a  recession at all. In half the corrections, there wasn’t even a discernible turn in the leading economic indicator beforehand. Plainly, there is a long history of market corrections being triggered by other factors than fundamentals – Black Monday in 1987 and the correlation crisis in 2005 are two obvious examples.


Still, judging by the current state of the market, Citi writes that traders "evidently don’t expect a sharp market correction to happen tomorrow."


While the probability of a next-day loss still feels quite low there is an obvious temptation to stay invested a little bit longer for professional investors, tasked not with delivering a return of money, but a return on money and with high frequency. The process of judging that near-term probability manifests itself in the frenzied search for “triggers”. Surely, if one could just get a slightly better call on the next trigger, then it’d be possible to get out just in time before everyone else jams the exit? We don’t dismiss the importance of triggers. Indeed,  when you look back at the last fifty years, nearly every major correction in credit can be associated with a triggering event (Figure 28). With hindsight everything is easy.


Here Citi has some advice: don"t look for triggers; instead focus on the big picture.


We are sceptical that hunting for the next trigger is worth the effort. If a trigger seems obvious, then it’s probably obvious to everyone and chances are it will be too late. Triggers are often latent – the long-term problem is obvious, but it is ignored until suddenly it explodes without much warning (think the Greek sovereign debt crisis). Multiple factors often have to  combine to create a triggering event – the GFC wasn’t just about sub-prime, it was about excessive leverage, inadequate regulation, unchecked financial innovation, misaligned rating methodologies, inadequate backstops and a host of other things. The last couple of years have seen several widely peddled “triggering events” crystallise with remarkably little shake out.


So what about the big picture? Here one can argue that in recent years the market simply wasn’t vulnerable with so much central bank money behind it. However, Lorenzen believes that "2018 is different." As we see it, it is now increasingly vulnerable to a mid-cycle, “technical” correction, based on what we have discussed above:


  • Central bank asset purchases are set to be the smallest in a decade (Figure 29). A $1tn of incremental demand versus 2017 is needed from private sources.

  • At least in the US, the opportunity cost of not being invested in credit (i.e. the yield differential to 3m LIBOR) is likely to be the smallest since 2007.

  • The perception of a backstop has facilitated a multitude of trades and strategies that are contingent on a low level of volatility in an increasingly crowded space. Now that backstop is moving “out the money”.

  • Vol is near historic lows and has been so for longer than ever before. More risk than ever before is being issued into a credit market where spreads, on a like-forlike basis, are close to the 2007 tights and where breakevens are wafer thin.


Lorenzen then branches into some chaos theory for good measure:


In the context of a self-reinforcing, herding market, the pivot point where the marginal investor is indifferent between putting more money back into risk assets and holding cash instead is fluid. But when the herd suddenly changes direction, the result is a sharp non-linear shift in asset prices. That is a problem not only for us  trying to call the market, but also for central bankers trying to remove policy accommodation at the right pace without setting off a chain reaction – especially because the longer current market dynamics run, the more energy will eventually be released.


And while not intended to be a conclusion, or even a punchline, the next line from the Citi strategist should scare the living daylights out of anyone: it is a direct admission that central bankers have now lost control.


That seems to be a growing fear among a number of central bankers that we have spoken to recently. In our experience, they too are somewhat baffled by the lack of volatility and concerned about the lack of response to negative headlines.... Our guess is that sooner or later in the process of retrenchment they

will end up going too far – though that will only be obvious with

hindsight.


Frankly, that"s about the scariest admission from one of the world"s biggest banks that we have read in a long time.


* * *


As for how this period of cataclysmic metastability ends, here is Lorenzen"s dire conclusion:


In a fairy tale, turning points come suddenly and unexpectedly. Everything that has long been taken for granted is suddenly in pieces. In that sense markets are not all that different. People have gotten used to the paradigm that has been built up since the Great Financial Crisis. It has been tested on several occasions – 2011, 2012 and 2015 – and on each occasion central banks have overcome the challenge, thus ultimately reinforcing the regime.


The emperor in Andersen’s story was only able to parade around naked because the social norms, customs, conventions and vested interests that had built up over time were so strong that even the blatantly obvious was better left unspoken.


Similarly, the low risk premia, the low level of volatility, the lack of responsiveness to tail risk and spillover of systemic events, the reluctance to sell etc. to us are all indications that the market now has an almost Pavlovian response to central bank liquidity. The mere thought of it is enough to still leave us salivating, even when it is patently in the process of being turned off. Yes, excess liquidity will remain in the system even after central bank net asset purchases fall to zero, but as we have argued, if that money has chosen to stay out of the securities  market now, then why should it seamlessly come flowing in at these valuations when the backstop is moving out the money?


While our conviction in the exact timing and magnitude of the paradigm shift is admittedly low – hence the deliberately very wide range in the scenario forecasts – it is unwavering  when it comes to the broader point that central bank asset purchases will remain the key driver of markets. Exactly because trades and strategies have been built up around an assumption of the status quo, we fear that the inflection point, if / when it comes will be anything but smooth and linear. Indeed, the longer we remain in the current paradigm, the greater the chance that it  ends up being both sharp and painful.


One of our favourite quotes pertains as much to markets as it does to economics:


“In economics, things take longer to happen than you think they will, and then they  happen faster than you thought they could.”


    ? Rudiger Dornbusch


Surely, that is a sentiment which the emperor who had his vanity and pride shattered so abruptly from the least likely angle would recognise all too well?


We end with one of our favorite pictures: the one we call Yellen"s moment of epiphany haw it all ends.


No wonder the Fed chair can"t wait to get the hell out...


Thursday, November 23, 2017

The Real Winner In America"s Russia Crisis Is China

Authored by Leon Hadar via The Strategic Culture Foundation,


The continuing American obsession with Russia plays directly into Beijing"s hands and makes it less likely that Washington will develop an effective strategy to deal with China...


When thinking about male-pattern baldness, what comes immediately to mind? Genetics? Thanks for this, grandad.


But then I conducted my own scientific research and discovered the following: I started losing hair at the temples or the crown of the head when Vladimir Putin first held the position of president from 2000 to 2008, and my hairline receded big time after the Russian leader took office again in 2008.


Coincidence? Or is it possible that the balding Putin, resenting the hairy Dmitry Medvedev, not to mention those American presidents with their incredible full heads of hair, decided to do something about that? Isn’t that what you would expect from the Kremlin’s notorious alpha male, who was probably envious of my Fabio-like flawless hair in the late 1990s?

So did my hair loss have anything to do with the RT programs I started watching in the beginning of the new century? Or with the news reports on pravda.ru I was devouring daily? Or perhaps my bald spot was expanding as a result of paying more attention to the sexy Russian ads on Facebook? Or should I blame those Russian trolls on the social media who wanted to become my virtual friends and were posting videos of cats playing the piano on YouTube?


Well, after an extensive research of the topic, I am now more inclined to blame my late grandpa, not Putin, for my receding hairline.


But then surely we can still all agree that the Kremlin has been responsible for much the problems plaguing the world today, like the rising protectionist tide and the emergence of right-wing nationalist political parties in Europe. And of course, Putin was behind the election of President Donald Trump and the Brexit vote.


In fact, according to a study issued last week, one of the many research projects conducted these days about alleged Russian intervention in the electoral process of this or other country, more than 150,000 Russian-language Twitter accounts posted tens of thousands of messages in English urging Britain to leave the European Union in the days leading to last year’s referendum on the issue.


Similarly, the Spanish media have been accusing Russia of playing a major role in the Catalan independence crisis by employing its state-controlled media outlets, like RT and Sputnik, and its legions of trolls on Facebook and Twitter, as part of a strategy to encourage Catalan separatism. Much like the case of Brexit, Russia has been accused of trying to weaken the EU and NATO and devastate the West.


Many of these “the Russians did it” accounts assume that supporters of Brexit in England’s East and West Midlands and the pro-Trump voters in Ohio, Michigan and Pennsylvania, as well the backers of independence in Catalonia, were driven to the polls by a sophisticated propaganda campaign directed from Moscow, which is believed to have coordinated with candidate Trump and his aides.


Indeed, according to a report on the Russian electoral interference, released by America’s intelligence agencies on January 6, the coordinated activities of RT and the online-media properties and social-media accounts that make up “Russia’s state-run propaganda machine” have been utilized by Moscow to “undermine the U.S.-led liberal democratic order.”


Yep. Forget about the impact the German chancellor Angela Merkel’s immigration policy had on the British public, or the impact of presidential candidate Hillary Clinton’s bashing of the “deplorables,” or the rise of secessionist movements in Catalonia—not to mention the deep structural economic and political changes sweeping the West in response to the effects of unrestrained globalization and mass migration, and the backlash against the political and business elites. It’s the Russians, stupid!


We are supposed to buy into the notion that white blue-collar workers in deindustrializing areas of the Rust Belts of the United States and the UK spent the last days of the 2016 Brexit campaign and the American presidential race getting their news from RT and Sputnik while exchanging tweets with Russia-friendly trolls. We are supposed to believe that they just couldn’t get enough of those ads on Facebook, which induced them to switch their support from Hillary to Trump.


If Russian propaganda is to be blamed for Trump’s electoral victory, we might as well take seriously serial killer Ted Bundy’s explanation for raping and murdering women in the 1970s. Pornography drove his behavior, he insisted during an interview a day before his execution. Penthouse made him commit all those horrific crimes!


But contrary to communication scholar Marshall McLuhan’s quip, the medium is not the message or the massage. The same news story or political or commercial advertising would have different effects on different audiences of perhaps have no effect at all.


You probably won’t be able to convince an Eskimo to spend his or her vacation in Antarctica or to sell sand to Bedouins in the Arabian Peninsula. Nor would a billionaire financing an expansive campaign in support of polygamy have a major impact on the views of the large majority of Americans.


This explains why the extensive Soviet propaganda machine had almost no effect on American public opinion during the Cold War, and why it was mocked by those who were exposed to it.


That RT, which, according to a 2015 survey of the top ninety-four cable channels in America by Nielsen, a research firm, captured at one point just 0.04 percent of American viewers, suggests that today’s Russian global-propaganda apparatus, isn’t much more effective. It certainly has not had much impact when it comes to reaching British voters in the country’s rural areas who spend more time drinking in pubs than watching RT.


America’s spooks, who asserted in their much-cited report that RT videos get one million views a day on YouTube, didn’t bother to add that much of what it posts there consists of footage of natural disasters or dancing dogs.


But then how do you explain that the loser in the 2016 presidential race and her allies spent about $1.4 billion on their campaign, including on ads, compared to the roughly $1 billion spent by the winner’s campaign? How do you explain that some of the best media strategists on the planets were working on Clinton’s campaign?


If you watched the recent grilling of the heads of the social-media companies on Capitol Hill, then you might conclude that what turned the election outcome in Trump’s direction was a decision by “the Russians” to spend $100,000 on Facebook ads and the “Russian trolls” who posted disinformation or fake news online.


Recall that Mark Zuckerberg, the founder of Facebook was until recently considered by Democratic lawmakers to be a cross between Henry Ford and Albert Einstein, while liberal pundits celebrated Facebook as a leading force promoting democracy and freedom worldwide, not to mention its role in helping Barack Obama win two presidential elections.


But now that they conclude that Zuckerberg supposedly provided a platform to the disinformation campaign of the notorious Putin and his evil partner, Trump, Facebook is “too big” and it and the rest of the social media need to be regulated.


But as Democratic campaign consultant, Mark Penn, explained in the Wall Street Journal, there is no evidence that the Facebook ads and fake news had any effect on the election outcome.


“Even a full $100,000 of Russian ads would have erased just 0.025 percent of Hillary financial advantage in the campaign,” wrote Penn, who calculated that only half of the “Russian” ads went to swing states. In the last week of the campaign alone, Clinton’s Super PAC dumped $6 million on ads into Florida, Pennsylvania and Wisconsin.


If the Russians were indeed engaged in a propaganda campaign, it proved overall to be very inept and amateurish. Certainly there are no signs that RT has captured larger American television audiences than other foreign-media outlets, like the moribund Al Jazeera America, or similar operations launched by China and other foreign governments.


But don’t tell that to the Washington elites who, through media reports and a government investigation, have continued trying to convince themselves and the rest of us that Russia, in collusion with Trump campaign officials, was responsible for Clinton’s election loss.


Their efforts have gained steam thanks in part to the way that Trump and his close aides conducted their campaign. Boasting that they would not rely on the assistance of so-called Washington insiders and disregarding standard operating procedures, like the need to properly vet political advisors with or without ties to foreign governments and businesses, they made it easier for their adversaries to depict telephone conservations and brief conversations with Russian diplomats and businessmen as “collusion.”


It’s important to point out the obvious: the United States and Russia are not at war and the Americans maintain extensive diplomatic and economic ties with the Russians, much like they do with the Chinese communists or the Saudi theocrats. That China, Saudi Arabia, Russia, Israel and other friends and frenemies spend a lot of money recruiting political allies in Washington or expanding their business operations in the United States shouldn’t come as a big surprise to anyone. It would also explain why any big time lobbyist and political operator maintains some sort of ties to these countries.


The current demonization of Russia as a global threat to American interests and values, and of President Putin as the world’s leading arch-villain, can be explained as an extension of the Cold War, of auto-piloting a foreign-policy paradigm that Republicans and Democrats feel comfortable with. But that is intellectually dishonest, considering American partnerships with mass-murderers like Stalin and Mao, and runs contrary to U.S. interests.


First, the preoccupation with the alleged Russian threat makes it impossible to cooperate with Moscow in dealing with common interests in the Middle East and elsewhere, which was President Trump’s goal in reaching out to Moscow, hoping to work out a deal to end the civil war in Syria and reduce the costs of American intervention in the Middle East.


Moreover, the long-term challenge to U.S. global military and economic power is China, and not that second-rate power, Russia.


The continuing American obsession with Russia, like the never-ending military interventions in the Middle East, plays directly into Chinese hands and makes it less likely that Washington would be able to develop an effective strategy to deal with China, including through ad-hoc cooperation with Moscow.


Instead, keeping the Russia collusion story would only encourage China and Russia to further collaborate over and target U.S. interests. And unlike my receding hairline, that isn’t a funny joke.


Wednesday, November 22, 2017

These Are The Top 50 Hedge Fund Long And Short Positions

In its latest quarterly hedge fund trend monitor - a survey of 804 hedge funds with $2.1 trillion of gross equity positions ($1.4 trillion long and $704 billion short) - which analyzes hedge fund holdings as of Sept 30, Goldman makes some interesting observations about the current state of the hedge fund industry. First and foremost, it finds that the average equity long/short hedge fund has posted a 10% YTD return, which while the strongest since 2013 is once again underperforming the S&P for the 7th consecutive year.


In terms of holdings, it"s a continuation of what we discussed the last two quarters - everyone and their kitchen sink is plowing into high beta, "growty" and "momentum" tech names, and since most funds still underperform the S&P, the average net leverage is at all time high. Here"s Goldman:


Fund performance has been lifted by sector (Information Technology) and factor (growth, momentum, large-cap) exposures. Our Hedge Fund VIP list of the most popular long positions,  whose top five stocks are FB, AMZN, BABA, GOOGL, and MSFT, has outperformed the S&P 500 by 770 bp YTD (25% vs. 17%).


Also notable, while at least on paper hedge funds are expected to diversify, in reality the average HF carries 68% of its long portfolio in its top 10 positions, just below the record high reached in early 2016. Meanwhile, confirming that the market is afflicted by a creeping paralysis, portfolio position turnover fell to a new record low last quarter, at just 13% for the largest fund positions. Oh yes, and nobody is short: hedge fund short interest as a percent of S&P 500 market cap remained close to 2%, near the lowest level in five years.


Below are Goldman"s 5 key observations from this edition of the HF Trend monitor:


  1. PERFORMANCE: The average equity long/short hedge fund has returned +10% YTD on the strength of the most popular long positions, high exposure to Information Technology, and atypical factor tilts toward large-caps and away from value stocks. This ranks as the strongest return since 2013 and compares with 17% for the S&P 500, 16% for the average large-cap core mutual fund, and 2% for macro hedge funds.

  2. SECTORS: Information Technology remains the largest net sector exposure, accounting for 27% of fund portfolios. However, the 307 bp overweight tilt relative to the Russell 3000 is 100 bp smaller than at the start of 3Q. Materials represents the largest sector overweight. Financials is the largest underweight and a major source of disagreement with large-cap mutual funds, which are overweight the sector. Current overweights in Energy and Consumer Discretionary are nearly the smallest tilts in recent history, as is the underweight in Utilities.

  3. LEVERAGE: Hedge funds increased net leverage in 3Q 2017 as the most popular positions continued to outperform a rising equity market. Short interest as a percent of S&P 500 market cap remained close to 2%, near the lowest level in five years.

  4. VERY IMPORTANT POSITIONS: Our Hedge Fund VIP list (ticker: GSTHHVIP) of the most popular long positions has outperformed the S&P 500 by 770 bp YTD. The VIP list contains the 50 stocks that appear most often among the top 10 holdings of fundamentally-driven hedge fund portfolios. The basket’s absolute and risk-adjusted YTD returns rank as the strongest since 2013. The list’s top 5 stocks are FB, AMZN, BABA, GOOGL, and MSFT. The basket has outperformed the S&P 500 in 65% of quarters since 2001, generating an average quarterly excess return of 62 bp. 10 new constituents entered the basket this quarter, compared with a quarterly average of 16 stocks since 2001: EQIX, GDDY, IAC, IQV, MGM, MPC, NRG, SBAC, TTWO, and XPO.

  5. CROWDING AND TURNOVER: Hedge funds continue to demonstrate high conviction in their favorite positions. The typical hedge fund has 68% of its long equity assets in its top 10 positions, just below the record high of 69% in 1H 2016. Similarly, our crowding index increased but remains shy of its 2016 extremes. Quarterly turnover of the largest portfolio positions fell to new historical lows, at 13%, declining in all sectors but Health Care.

The biggest component of the favorable hedge fund return in Q3 was a result of the outperformance of the Goldman Hedge Fund VIP basket, also known as the "hedge fund hotel"index, a list of 50 names which are the most widely held hedge fund stocks. Good luck selling them during a firesale, as happened in early 2016 when the GSTHHVIP basket crashed, wiping out four years of gains in a few months.


With no crash yet, and despite softness during the last month, Hedge Fund VIP names outperformed the broad market YTD both in absolute and risk-adjusted terms according to Goldman.


The basket’s strong  return has more than made up for its higher volatility (8 vs. 6 for S&P 500), combining for a YTD ratio of return/volatility of 3.0, above the ratio of 2.8 for the S&P 500 and the best since 3.2 in 2013.


What is more concerning is that as discussed the past two quarters, the trend of growing hedge fund leverage (to make up for loss of alpha), continues, and according to Goldman, funds added net leverage entering 4Q. Data calculated by Goldman Sachs Prime Services on exposures in their business show that net leverage has risen in recent months and is near cycle highs.


Meanwhile, everyone has given up on shorting: in fact, short interest as a share of S&P 500 market cap sits just below 2.0%, matching January of this year as the lowest level since 2012. Relative to trading volumes, the short interest ratio (days to cover) ranks higher compared with history but still far below the cycle high in 2015.


Predictably, with market leadership increasingly more concentrated, and with fewer leaders, the density of hedge fund portfolios is near all time highs.


Hedge fund crowding in the most popular positions rose slightly in 3Q 2017 but remains below the extremes reached in 2016. The average hedge fund holds 68% of its long portfolio in its top 10 positions, just below the record “density” of 69% in 1H 2016. The increase in hedge fund portfolio density mirrors the growing share of S&P 500 market cap accounted for by the 10 largest index constituents, which has risen steadily for two years but even now sits near the average level since 1990.


As a tangent, those who were long tech, remained long tech as the average infotech portfolio turnover dropped to the lowest on record.


So putting it all together, here are the 50 positions which make up the latest GS VIP list, i.e., the 50 most popular hedge fund longs...


... and the list of 50 stocks representing the most important short positions.


Finally, here are the 20 stocks with the highest positive and negative changes in popularity.


As a reminder: traditionally, being long the most shorted hedge fund names and shorting the most favored ones has been a source of double digit alpha ever since 2011, and while this year that may have been different, for now, there is no reason to assume this normalcy will persist especially once the revulsion with tech names reappears once more.