Showing posts with label Japanese yen. Show all posts

Monday, December 25, 2017

Chinese Stocks Spooked By Apple iPhone X Forecast Cut, Nikkei Boosted By BOJ Hopes

With most global markets closed for Christmas, the only overnight action was in Asia, which saw Chinese equities fall with tech stocks and names linked to Apple the worst performers after a report that Apple cut forecast iPhone X sales forecasts, while property firms surged on speculation of coming consolidation. As a result, after opening higher, the Shanghai Composite Index closed 0.5% lower on the day, the blue-chip CSI 300 Index fell 0.3%, the Shenzhen Composite Index retreated 0.9%, while the ChiNext small-cap and tech Index dropped 1.3%. The PBOC"s refusal to conduct a reverse repo for the second day did not boost the market mood.


The biggest Asian losers were Apple suppliers after the Taipei-based Economic Daily News reported that Apple has cut its sales forecast for the iPhone X by 40% from 50 million in Q1 to only 30 million. The report also noted that Foxconn’s Zhengzhou plant stopped recruiting workers. Following the news, Apple supplier Lens Technology Co. dropped 8.4% to be among worst performers on the ChiNext measure; Shenzhen Sunway Communication Co. -2.2%, Luxshare Precision Industry and GoerTek both dropped at least 4%. As the table below shows, it was a sea of red for Apple suppliers.


Offsetting the drop in tech names was strength among property firms: Gemdale rose 6.3% as the best performer on CSI 300 measure after Citic Securities analysts said that the planned strict implementation of property curbs in 2018 would boost industry consolidation and benefit big companies. Unless, of course, it ends up crippling the business for everyone in which case today"s spike will promptly turn into a selloff.


Elsewhere in open Asian markets, Japan"s Nikkei erased early losses and scraped out gains on Monday as expectations that the Bank of Japan would buy more exchange-traded funds (ETFs) offset drops by financial stocks, Reuters reported. Movements in Japanese equities were confined to a narrow range with foreign investor presence lacking due to Monday"s closure of other major markets for Christmas; as a result, the Nikkei finished 0.16% higher at 22,939.18.


Of Tokyo"s 33 subsectors, 10 were in the red, led by securities T and banking after their U.S. financial peers lost steam on Friday following their recent strong performance. Denim clothing store operator Jeans Mate 7448.T soared 20.2 percent after reporting that December existing store sales increased 13.2 percent from a year earlier.  Furniture and interior goods seller Nitori Holdings 9843.T sank 6.4 percent after the company saw its operating profit for the nine months through to Nov. 20 rise a modest 0.3 percent to 70.4 billion yen ($621.58 million).


Cryptocurrency related shares slipped following recent wild swings in bitcoin. Internet provider GMO Internet which is engaged in the "mining" of bitcoin, fell 4.8%.  Remixpoint, an operator of virtual currency trading post services, dropped 4%.


In FX, it was a quiet session, with the only major mover once again out of China, where the yuan surged over 240bp to hit 6.5514 per USD at one point, the strongest since mid-September. Earlier in the day, the PBOC raised the yuan’s fixing by 138bp to 6.5683 per USD, the highest since Sept. 20. The dollar was little changed against other major currencies on Monday in holiday-thinned trading while the cost of swapping the yen for the dollar jumped as banks scrambled to raise dollars for the year-end period.


With most currency trading centers except for Tokyo shut on Monday for Christmas, trading volume was less than 20 percent of the average for major currency pairs including the euro/dollar and the dollar/yen. 


According to Reuters, the discount for buying the yen at future dates widened sharply as non-U.S. banks, which typically buy dollars now with sell-back contract at a future date, scrambled to procure greenbacks for the year-end.  The one-week forward discount starting from Wednesday jumped to 0.23 yen from around 0.04 yen in the middle of last week.


“Because foreign banks are away and few market players are eager to offer dollars, the forward market is very thin,” said a currency trader at a major Japanese bank. “The market is very volatile and there are hardly any trades beyond one week."


Monday, December 11, 2017

After $150 Billion Buying Binge, "Tokyo Whale" Seen Paring Back ETF Purchases In 2018

A few months ago, we noted that the Bank of Japan had decided to throw every textbook out of the window and crank their plunge-protection to "11"after reports surfaced that they owned a staggering 75% of Japan"s ETFs.


The BOJ first started their buying spree in December 2010 - when they held no ETFs at all - and have since accumulated some $150 billion in aggregate holdings.  The buying was all as part of unprecedented "economic stimulus" which has undoubtedly contributed to the Nikkei 225 Stock Average surging roughly 125% since December 2010.


Here"s a quick graphical recap of the program courtesy of Bloomberg...


...and another look which shows the central bank owns three quarters of ETFs by market value...


...all of which has resulted in the following bubble stock market appreciation...


Not surprisingly, since the program started, everyone from the head of the country’s stock exchange to the chairman of the Japanese Bankers Association has questioned the ETF program’s size and whether it artificially depresses volatility.


Now, with the Nikkei surging to 25 year highs, analysts are increasingly saying it"s time for the BOJ to put this specific component of their many controversial bubble-blowing policies to rest.  Per Bloomberg:


Sometime next year, the BOJ will cut its annual buying target for domestic exchange-traded funds by as much as a third from the current 6 trillion yen ($53 billion), says Toru Ibayashi, head of Japanese equities at UBS Wealth Management in Tokyo. Soichiro Monji of Daiwa SB Investments Ltd. expects a similar reduction, but by the end of March.


“Four trillion yen,” UBS’s Ibayashi predicted. “And everybody will understand.”


"Fear of deflation was behind the 6 trillion yen target,” Daiwa SB’s Monji said in an interview. “We’re no longer in that kind of environment. Risks are now skewed toward the upside, rather than the downside. It’s hard for the central bank to justify its buying spree.”


“Given the circumstances at this point in time, it is difficult for the BOJ to keep buying ETFs at six trillion yen per year,” Ibayashi said.


Jonathan Garner, chief Asia and emerging markets equity strategist at Morgan Stanley in Hong Kong, described the ETF purchases as “perhaps the most controversial part” of the bank’s stimulus program which includes everything from negative interest rates and yield-curve control to buying tens of trillions of yen of bonds each year, on top of its stock purchases. 


Of course, not everyone agrees as Naoki Kamiyama, chief strategist for Nikko Asset Management Co. in Tokyo, and Hisao Matsuura, a strategist at Nomura Holdings Inc., both saying the BOJ won’t cut its ETF target anytime soon as "it would hurt investor confidence and make a pickup in inflation much less likely..."


You know, because every central bank"s primary objective is to boost "investor confidence" by creating massive asset bubbles that make the masses feel richer...at least until the marginal stimulus fails and the whole ponzi comes crashing down...


Monday, November 6, 2017

Gold Spikes Above Key Technical Level As USDJPY Tumbles

As European markets closed this morning, all bids disappeared from USDJPY and the pair dropped back below 114.00. In its mirror-like manner, gold reflected this tumble and surged above its 100-day moving average over $1280.


If you"re looking for a catalyst, good luck. Fed"d Dudley was speaking but focused on regulation with no monetary policy comments. No new headlines from Asia/Trump. It seems the closing bell in Europe is all that is needed to panic-buy Yen.


Perhaps it"s just a delayed reaction to the chaos in the middle-east this weekend?


Friday, October 27, 2017

1,000,000,000,000 - Japanese Foreign Assets Top One Quadrillion For First Time

"...a quadrillion here, a quadrillion there... and pretty soon you"re talking real money!"


For the first time in history, foreign assets held by Japanese institutional and individual investors appear to have topped 1,000 trillion yen ($8.79 trillion), according to Nikkei estimates.


The amount has increased roughly 50% during the past five years and now is more than twice as much as the country"s gross domestic product.


Japanese investors are in the midst of a major shift -- pulling their cash out of domestic securities and placing it in overseas markets.


Securities seem to have accounted for nearly half of the 1,000 trillion yen that has escaped overseas. Japanese investors were holding 453 trillion yen worth at the end of June, up 100 trillion yen or so over the past three years.


By investment destination, nearly half of securities investments were directed to the U.S., while close to 30% went to Europe.


They have been pushed to this collective decision by a hyper-aggressive Bank of Japan, which for more than four years now has been flooding the country"s economy with so much yen that cash instruments can only earn negligible interest.


And given Shinzo Abe"s recent super-majority election win... do not expect this flood of liquidity - fungibly leaking out to the rest of the world"s assets - to stop anytime soon!


Just ask Kuroda...


Monday, October 23, 2017

USDJPY Inches Higher As Japanese Stocks Set For Longest Winning Streak In History

Yen is weaker and Japanese equity futures notably higher following a landslide election victory for Japan Prime Minister Shinzo Abe which theoretically ushers in yet more easy monetary policy. USDJPY has jumped above 114.00 in early trading, sending NKY futures up almost 1% in the pre-market.


If this equity rise holds it will mark the 15th consecutive gain for the Japanese market - breaking the 1961 record of 14 straight days to become the longest winning streak in Japanese stock market history.


Nikkei 225 is at its highest since Dec 1996.


Meanwhile, much has been made recently of the decoupling between USDJPY and the Nikkei 225


However, this chart masks a closer relationship between USDJPY and the relative performance of Japanese and US equities.


So there really is no regime shift.


What are the drivers of this persistent negative correlation between the yen and Japanese equities and which flows supported this negative correlation this year?


On Friday, JPMorgan presented three fundamental explanations to justify the link between Japanese equities and the yen.


One typical explanation is that the yen, being a major funding currency for the world, should rise in a risk-off equity environment and vice versa. But this argument is not supported by the fact that there is much lower correlation between the yen and global equities. It is also not supported by the structural break in the correlation between Japanese equities and the yen shown in the chart above. The yen was the most prominent or sole funding currency before the financial crisisof 2007/08. After the financial crisis the yen was joined by the dollar and later by the euro as funding currencies. So if anything the negative correlation between equities and the yen should have been even more negative before the financial crisis. But the opposite happened. The negative correlation only intensified after the financial crisis.


A second explanation, with causality running from yen to Japanese equities, is that a weaker yen has a positive impact on corporate profits inducing equity investors to buyJapanese equities and vice versa.


A third explanation is that Abenomics was always thought of as a combined trade for overseas investors: buy Japanese equities and sell the yen. And reverse, i.e. sell Japanese equities and buythe yen, when Abenomics wanes.


But JPM notes both of these last two explanations have a problem: why does the yen not go up as foreign investors buyJapanese equities? In principle when foreign investors buy or sell Japanese equities currency-hedged there should be no currency impact. And when foreign investors buy or sell Japanese equities currency unhedged there should be in fact a positive correlation between the yen and Japanese equities. What are the circumstances then under which we have a negative correlation between Japanese equities and the yen?


We previously presented three flow circumstances:


1) If a foreign investor (buyer) purchases Japanese equities currency-hedged from another foreign investor (seller) who was long yen already (i.e. the seller owned these Japanese equities currency unhedged before), the net market impact would be an up movein Japanese equities and a down move in yen.


2) If a foreign investor (buyer) purchases Japanese equities currency-hedged from a Japanese investor (seller) and this Japanese investor uses the proceeds to purchase foreign equities currency-unhedged, the net impact would also be an up move in Japanese equities and a down move in yen. This flow appears to have taken place since mid-September. Foreign investors were buyers of Japanese equities, at the same time as Japanese investors sold domestic equities and as Japanese investors stepped up their purchases of foreign equities. But since September, the purchases of foreign equities by Japanese investors were smaller in magnitude relative to the purchases of Japanese equities by foreign investors. So the negative impact on theyen from the former flow was more muted relative to the positive impact on Japanese equities from the latter flow.


3) Another flow example is related to dynamic hedging by existing holders of Japanese equities, Existing foreign holders of Japanese equities could have unwound previous FX hedges in response to equity price declines in recent months, even if they did not sell any Japanese equities themselves. This is because equity investors tend to dynamically adjust their FX hedges to match the size of the hedges to the value of their equity holdings. So as the price of Japanese equities goes down in local currency terms, these foreign investors cut some of their previous FX hedges, pushing the yen up in the process. The opposite flow takes place in periods of Japanese equity appreciation: existing foreign holders of Japanese equities have to increase the size of their FX hedges to match the increased equity values, pushing the yen down in the process.


This dynamic hedging flow suggests that there should be an even stronger correlation between the performance of the yen and the absolute performance of Japanese equities in local currency terms, relative to the correlation between the yen and the relative performance of Japanese vs. US or global equities. But the two charts above show that the opposite happened this year. The correlation between the yen and the relative performance of Japanese vs. US equities has been stronger than the correlation between the performance of the yen and the absolute performance of Japanese equities. This suggests the above flow stemming from dynamic hedging by foreign investors of existing Japanese equity holdings, has likely weakened this year.


So from the above three flow circumstances, it is the second one that appears to offer the best explanation of what happened since September in the Japanese equity/yen space. 


So, following the recent buying, how overweight have foreign investors become in Japanese equities?


So in all, it appears that overweights in Japan have been focused mostly among leveraged overseas investors including CTAs, making Japanese equities vulnerable to an unwind of some of these positions in the near term. Non-leveraged institutional investors or retail investors are rather neutral.


To conclude, JPMorgan finds no reason to believe that the historical negative correlation between Japanese equities and the yen has broken down. The relationship between Japanese equities and the yen has been closely aligned this year if one looks at the relative rather than the absolute performance of Japanese equities.


More recently, since September, the purchases of foreign equities by Japanese investors were smaller in magnitude relative to the purchases of Japanese equities by foreign investors. So the negative impact on the yen from the former flow was more muted relative to the positive impact on Japanese equities from the latter flow. Going forward, overseas leveraged investors present the main vulnerability for Japanese equities, in our view.


Saturday, September 9, 2017

Conor McGregor - Worth His Weight In Gold?

Conor McGregor - Worth His Weight In Gold?


- Conor McGregor, MMA champion has gold statue made of him
- If McGregor was cast in investment grade gold bullion he would be worth ...
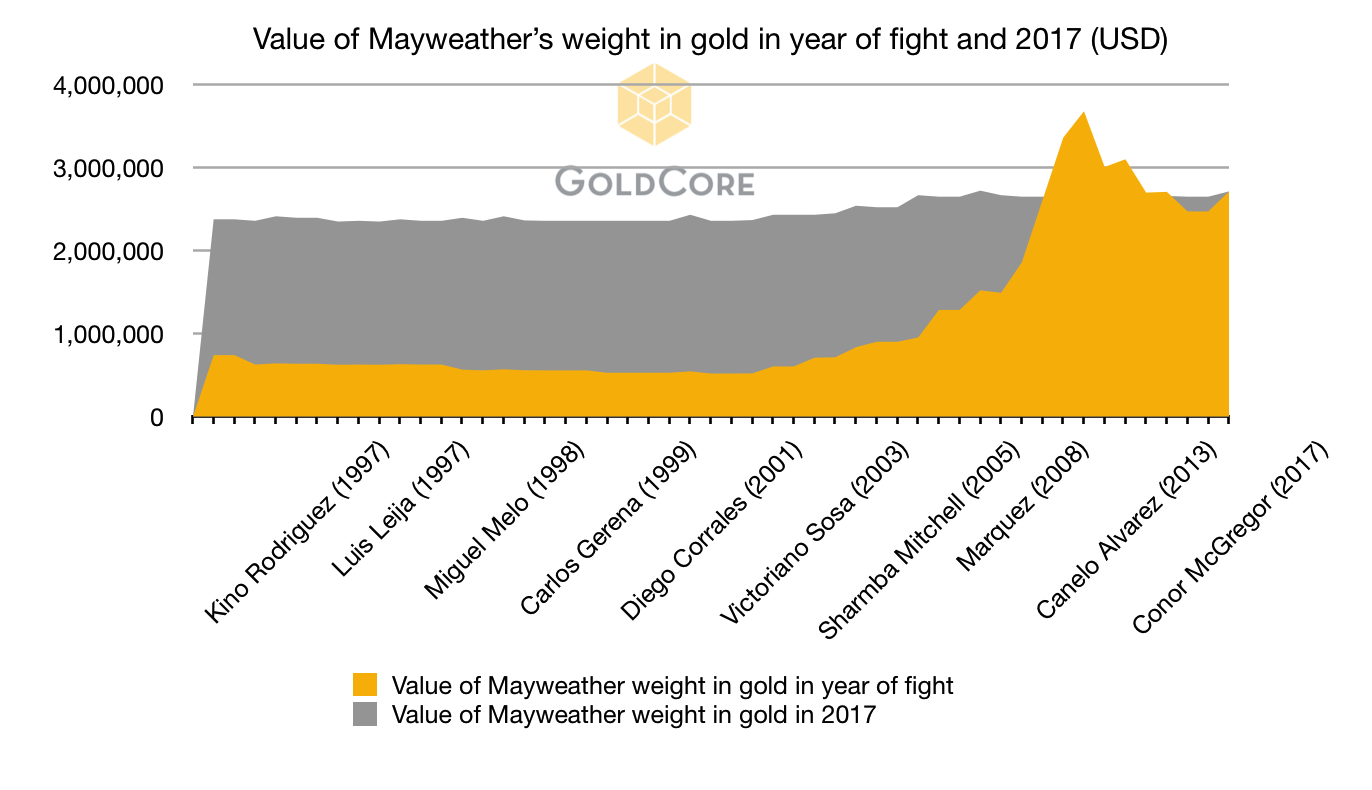
- If Mayweather were cast in gold he would be worth $2.7m
- Ali once fought equivalent of MMA fighter and nearly lost use of his legs
- Gold continues to be seen as the ultimate prize in sport
- Gold a great prize but true value is as a safe haven


At the moment there are some heated debates going on about statues that some believe should no longer stand.


Many of the figures previously cast in bronze, gold or stone are no longer seen as heroes. Time has changed some people"s perspective on what were once seen as heroic endeavours and achievements.


Today we have different measures of success and while statues of now divisive historical figures are being pulled down, statues of modern millennial heroes are being raised. Last week a statue was created of the "Notorious", world champion Mixed Martial Arts (MMA) fighter, Dublin-born Conor McGregor.


In one of the most hyped fights of all time last week, McGregor was defeated by the 50-times unbeaten boxing champion Floyd Mayweather in Las Vegas.


McGregor’s achievement of stepping out of his comfort zone and his actual sport and taking on the legend that is Floyd Mayweather was applauded by most and it is something that has not gone unnoticed by Irishman Eamon Heneghan.


Last week Heneghan unveiled a life-size gold statue of Conor McGregor, ‘I"m such a big fan and find him so inspirational.’ the amateur sculptor told the Irish Independent.


Heneghan is currently out of work. He saw that McGregor has a keen interest and penchant for gold and gold statues and decided that he would make one for him.


His hopes are that the MMA champion will notice it. We hope he does as statues are getting bad rep at the moment and this one was only made out of admiration for someone who has made history.


The gold-sprayed chicken wire and papier-mâché statue has been called a mixture of things but it was definitely one headline that declared the statue ‘belongs in the pantheon of horrible sports sculptures’ that grabbed my attention.


Whatever you think of the statue you have to admire the effort that went into it. We thought we would look at some other headline-grabbing sports statues and look at what may have happened if they had been cast in gold.


Ugly statues


A lot of sports stars have been confronted with statues that perhaps aren"t the most...flattering.


One of the most famous is Ronaldo.


The bust was cast out of bronze, but we suspect if Ronaldo had ben cast in gold he might feel a little happier about it.


Is Ronaldo worth his weight in gold? Ronaldo was bought by Real Madrid for €94 million in 2009. At the time his weight in gold was worth €1.76m, today he is worth over €2.8m in gold. This is nothing to do with Ronaldo"s performance, instead the simple climb in price of gold.


How does that compare to the other competitor for world"s best footballer, Lionel Messi. The Barcelona Forward €250m. Weighing in at 72kg, Messi"s weight in gold today is worth €2.25m.


Wimbledon champs


Photo credit: AP


In 2011, Andy Murray was "honoured" with a Terracotta Army statue in Shanghai.


The Chinese are obviously known for their love of gold. Had they decided to make Andy"s 84kg frame into a gold statue in 2011 then it would have fallen slightly from £2.856m to £2.688m.


Murray"s statue in Shanghai was in good company. Just the year before Roger Federer had been gifted with a statue in a similar style. In contrast to Murray"s 2011 statue, Federer"s 2010 statue has climbed in value from £2.295m to £2.72m. It shows what difference a year can make.


All about the gold


What’s most interesting about the coverage surrounding this new statue is that it wouldn’t have happened if Heneghan hadn’t decided to paint it in gold.


If he’d not painted it at all or just gone for a plain colour then no-one would be interested.


We have a fascination with gold that means it makes headlines. Most people have an interest in gold.


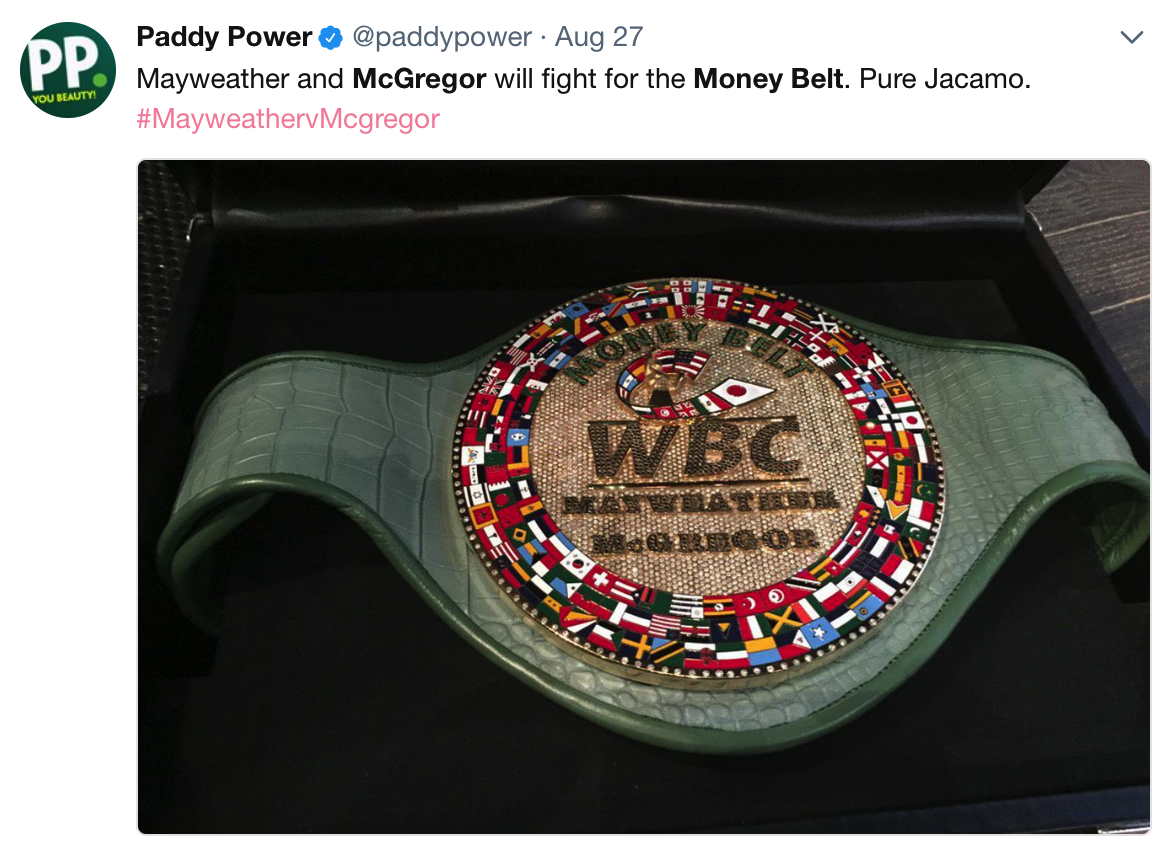
We reward people in gold. Last week the belt McG and Mayweather were fighting for was made of 1.5kg gold (plus 3,360 diamonds 600 sapphires and 160 emeralds).


The desire to reward and be rewarded in gold has been around since time immemorial. It is not a recent phenomenon of rising gold prices or flashy Instagram photos.


We know deep down inside that to be rewarded in gold is to be rewarded with something that will last long past the victories and should even secure your financial future.


Watch gold in the long-term


The last few examples of how gold can change in over time are merely short-term ones.


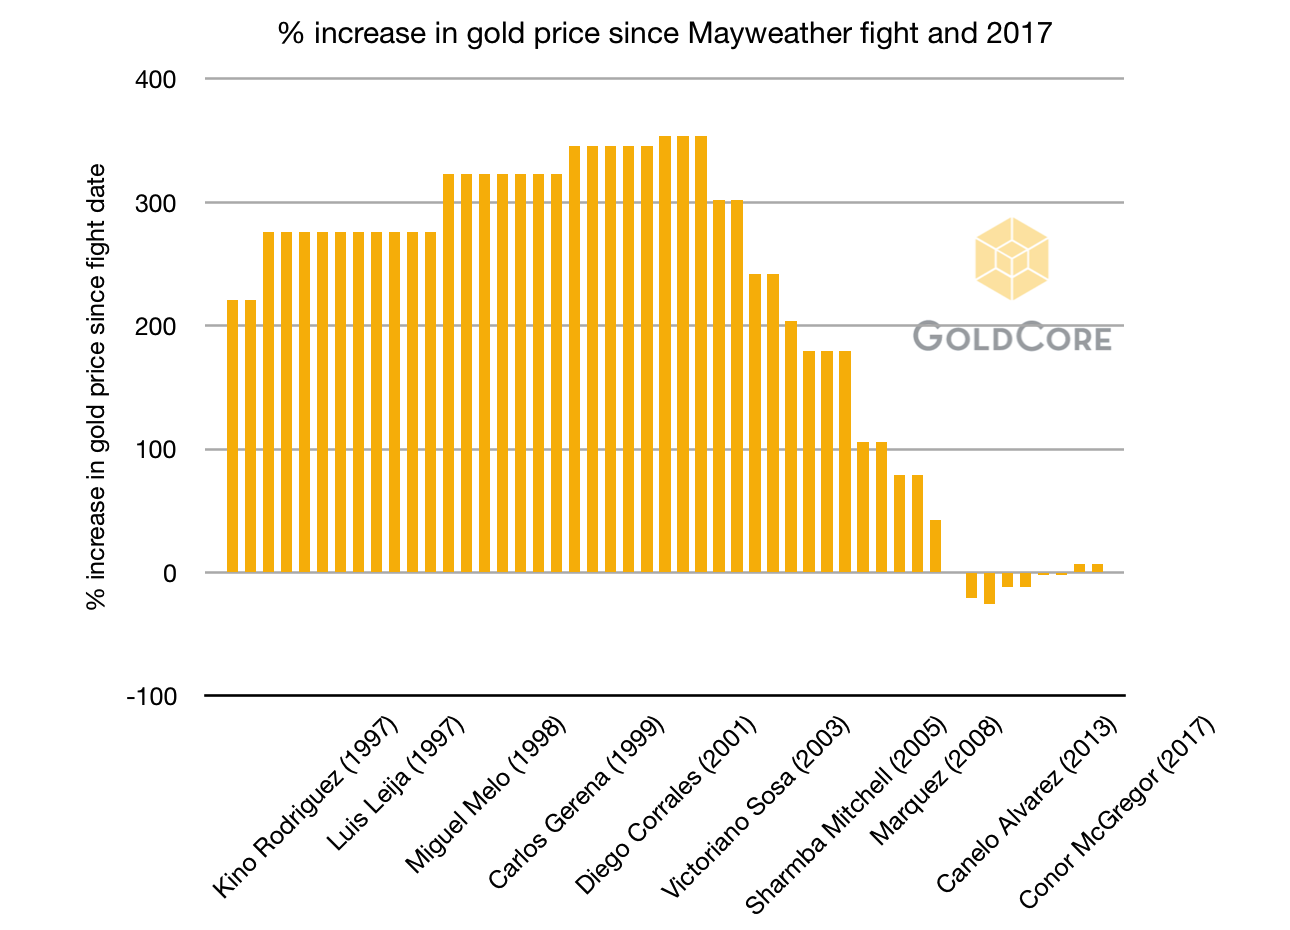
To bring it back to Mayweather we can take each of his fighting weights from his 50 fights and see how the equivalent weight in gold has climbed since.


The graph below shows the percentage gain in the gold price since Mayweather"s first fight in 1996 and in 2017. Since his 1996 fight against Roberto Apodaca the price of gold has climbed by over 226%.


Gold hasn"t demonstrated as big gains if you bought in recent years but the lesson here is that gold takes its time. A bit like property or indeed fine wine.


Conclusion: Gold"s the champion but it takes its time and doesn"t show off


The most famous boxer of all time is of course Muhammad Ali.


What"s interesting about Ali in light of the Mayweather vs McGregor fight is that the legendary boxer once took on a similar challenge.


In 1976 Ali fought Antonio Inoki, a Japanese professional wrestler. The fight was fought under special rules  and is seen as a precursor to the MMA sport which McGregor is famous for today.


The result was a draw but Ali was arguably left worse off. He was left with two blood clots in his legs. These hindered him for the rest of his career with amputation even being discussed at one point. The fight is considered one of the most embarrassing of Ali"s career.


Ali was so convinced that he could show that he was "The Greatest" that he stepped out of his comfort zone and into unfamiliar territory. As a result he nearly ruined his entire sporting future and his health.


An analogy can be drawn with Ali"s challenge with what we see today in the financial world and governments controlling the monetary system. They feel they are infallible. They are taking on riskier and riskier matches, with rules that are unfamiliar and the consequences known.


What has survived the test of time and all of the risk taking and speculative punts whether in sports or finance?


Gold has. Gold cannot be beaten to a pulp whether figuratively or literally. It has stood strong through financial crisis and crashes throughout history and will continue to protect people in the coming uncertain years.


Conor McGregor has done very well financially in recent years and is believed to have made €100 million from the Mayweather fight alone.


We sincerely hope that in order to protect his financial well being, he diversifies into physical gold bullion.


News and Commentary


Gold climbs to 1-year high as U.S. dollar sees fresh weakness (MarketWatch.com)


Gold rises to one-year high amid sluggish dollar (Reuters.com)


Dollar Tumbles as Yen, Euro Rally on Irma, ECB (Bloomberg.com)


ECB keeps door open to even more stimulus (Reuters.com)


Hurricane Harvey lifts U.S. jobless claims to more than two-year high (Reuters.com)


Source: Bloomberg


Yen Losing its Haven Sheen to Gold on North Korea (Bloomberg.com)


Gold to reach $1400 on dollar weakness and North Korea (CNBC.com)


Flight to quality may see further gains for gold bullion (CNBC.com)


Gold prices boom as fears grow over North Korea nuclear crisis (Independent.co.uk)


Own Gold for Long Term as Fiat Money is Doomed - Frisby (MoneyWeek.com)


Gold Prices (LBMA AM)


08 Sep: USD 1,350.90, GBP 1,026.82 & EUR 1,120.71 per ounce
07 Sep: USD 1,340.45, GBP 1,026.52 & EUR 1,119.54 per ounce
06 Sep: USD 1,340.15, GBP 1,028.03 & EUR 1,122.11 per ounce
05 Sep: USD 1,331.15, GBP 1,029.51 & EUR 1,120.43 per ounce
04 Sep: USD 1,334.60, GBP 1,030.98 & EUR 1,120.53 per ounce
01 Sep: USD 1,318.40, GBP 1,020.18 & EUR 1,107.98 per ounce
31 Aug: USD 1,305.80, GBP 1,013.17 & EUR 1,098.31 per ounce


Silver Prices (LBMA)


08 Sep: USD 18.21, GBP 13.80 & EUR 15.09 per ounce
07 Sep: USD 17.79, GBP 13.59 & EUR 14.85 per ounce
06 Sep: USD 17.77, GBP 13.62 & EUR 14.90 per ounce
05 Sep: USD 17.88, GBP 13.80 & EUR 15.03 per ounce
04 Sep: USD 17.80, GBP 13.75 & EUR 14.95 per ounce
01 Sep: USD 17.50, GBP 13.53 & EUR 14.69 per ounce
31 Aug: USD 17.34, GBP 13.47 & EUR 14.62 per ounce


Recent Market Updates


- ‘Things Have Been Going Up For Too Long’ – Goldman CEO
- Physical Gold In Vault Is “True Hedge of Last Resort” – Goldman Sachs
- Bitcoin Falls 20% as Mobius and Chinese Regulators Warn
- Gold Surges To $1338 as U.S. Warns of ‘Massive’ Military Response
- Precious Metals Outperform Markets In August – Gold +4%, Silver +5%
- 4 Reasons Why “Gold Has Entered A New Bull Market” – Schroders
- Gold Reset To $10,000/oz Coming “By January 1, 2018” – Rickards
- Gold Surges 2.6% After Jackson Hole and N. Korean Missile
- Diversify Into Gold On U.S. “Political Instability” Advise Blackrock
- Trump Presidency Is Over – Bannon Is Right
- The Truth About Bundesbank Repatriation of Gold From U.S.
- Cyberwar Risk – Was U.S. Navy Victim Of Hacking?
- Global Financial Crisis 10 Years On: Gold Rises 100% from $650 to $1,300


Important Guides


For your perusal, below are our most popular guides in 2017:


Essential Guide To Storing Gold In Switzerland


Essential Guide To Storing Gold In Singapore


Essential Guide to Tax Free Gold Sovereigns (UK)


Please share our research with family, friends and colleagues who you think would benefit from being informed by it.

US Dollar/Yen- Slip here, bear trend could start!


Since 2011, it has paid to be long the US$/Yen, could that trend be about to change? Big test in play friends!


Below looks at the US$/Yen over the past 8-years-


weekly chart of us dollar Japanese Yen ratio, chris kimble chart


CLICK ON CHART TO ENLARGE


The trend is your friend and the trend in the US$/Yen still remains up at this time. It has paid for years to buy on support, will it be different this time?


Most important test of support in the past year is in play at (3) currently.


What the US$/Yen does at (3), has huge implications for many different assets and stocks are one of them. If support would fail to hold at (3), US$/Yen could see selling pressure ramp up. Next key support for the US$/Yen comes into play around the 100 level.


Keep your eye on the US$/Yen, what it does from here, should be very important!


from Kimble Charting Solutions.  We strive to produce concise, timely and actionable chart pattern analysis to save people time, improve your decision-making and results


Send us an email if you would like to see sample reports or a trial period to test drive our Premium or Weekly Research


Email services@kimblechartingsolutions.com 


Call us Toll free 877-721-7217 international 714-941-9381


Website: KIMBLECHARTINGSOLUTIONS.COM

Monday, September 4, 2017

Why the US Dollar is About to Go Up, and the Euro Isn’t.

With $DXY’s 92.63 monthly close, August 2017’s end likely marked an 8-month high-to-low cycle for the US Dollar – which hovers a mere penny above major support at 92.62 (next major support ~ 91.92).


92.63


That’s where the Dollar ($DXY) closed the month of August.


A full 0.01 above major support at 92.62.


The Dollar’s been hammered for 8-months straight.


It’s gone down for all of 2017.


Yeah, it bounced in February - c’mon.


After an 8-month high-to-low time cycle that shaved off 11.75% (peak-to-trough), the US Dollar appears poised to find its footing and bounce markedly from a cluster of strong price support spanning 92.62 - 91.92 (note $DXY price action and weekly candlesticks across the last few weekly bars of 2014 and first few of 2015 ~ extremely strong support range from massive technical breakout).


Technical Outlook for the US Dollar ($DXY)


~ why it wants higher from here


The combination of a strong 8-month selloff – that ends in a picture-perfect doji, 1 penny above the first major support level going back to 2015 – suggests that a strong bounce is more than likely to develop over the next few months, with 95/96 $DXY the likely target (round number 100 is a longer-term possibility and a floor to absolutely trampoline through 103 if  Big Lil’ Kim launches an EMP that ‘fails’ over Hokkaido/ Sakhalin.


The daily chart below shows the US Dollar with the Super RSI, Super MACD, and Super DMI – it’s worth noting that all four of these technical indicators are showing a clear-cut bullish divergence. This is because every indicator is registering a higher value even though the price of $DXY printed a new swing low.


dxy super rsi macd dmi stochastics


dxy weekly super rsi macd


dxy monthly super rsi macd dmi


dxy monthly candlestick patterns


The following chart shows the exact Pip Strength of individual currencies … 


(EUR, GBP, USD, JPY, CHF, CAD, AUD, NZD)


over the last 8-months ~ the timespan when the USD registered it’s last major swing high.


Over this period of time, the USD has been the weakest currency when we tally the total amount of pips lost since January 1st. 


Working from the assumption (albeit measured) that the USD is about to turn up …


what may prove itself the best currency pair trade, from the perspective of technical risk:reward?


EUR has been the strongest performing major currency (represented via Cyan below) but appears ready to cool-off, lose its lust for the luster of 1.20 and turn south (after explicitly failing to plot a new swing high).


fibozachi forex force pip strength


i) Looking at a EURUSD monthly chart shows that the open gap from January 2015 has just been filled (to within roughly 20 pips), and


ii) While the 1.2100 level has provided rock-solid support on numerous occasions, we’re now on the other side of it ..


iii) Meaning that same level will likely serve as resistance now – because price is approaching it from below instead of above.


eurusd monthly support resistance level


[1] http://www.zerohedge.com/news/2014-07-29/most-significant-danger-according-elliotts-paul-singer


[2] http://www.zerohedge.com/news/2017-08-04/epic-quarterly-letter-elliotts-paul-singer-rages-against-everything-passive-investin

Monday, May 29, 2017

Update: Gold Ready to Rocket? Yen and Cable Say Yes

The Trend Retains the Name


Intro by Vince Lanci  and Bon Scott for Soren K. Group


The pattern continues in Gold, with last week"s move reaffirming the wave count Enda is using below. Friday"s rally puts the market right above the high on the 30 minute chart established in the previous "5". The next  "1" would be completed if gold pierced the $1271.21 level. After that, any retracement that holds $1259.78 further confirms a wave  seeking final extensions to the $1550 area. A drop below $1247 at this point puts into  question the pattern, but does not negate it. 


The 4 hour chart shows a nice traditional channel with an upward bias that also respects the counts described. Note the steepness in the rally in that chart. Impulsiveness is in play now. To clarify, we identify "impulsiveness as a negative describing momentum chasing funds. But the term is not being used the same way here. The  author is describing a market that is following the path of least resistance; which right now is higher. This does warn of equally violent pullbacks, but until the wave count is put into question below $1247 the short term and long term bias are aligned.


The daily chart shows the macro goal of this pattern: a "corrective" high in the $1550 area. Nothing new here. But that is what bulls want right now. And they are getting it.


 GBPUSD, JPY, and Gold Walking Hand in Hand?


Other currencies are lining up to corroborate the  count here as well. As her title implies, a GBPUSD high is potentially indicative of an acceleration  in Gold. We are fans of JPY behavior when it comes to Gold correlation. Note the similarities at the 30 minute and daily charts of the Gold and the JPY below in the analysis. Here is a quick overview. 


?


Why is this? There are several potential reasons for the eerie parallel between JPY and Gold. One simple one is this. In Asia, the JPY is viewed as the most stable regional currency. The Yen is viewed as the USD of the far east. So when Chinese and other Asian players seek safety, the buy Gold and Yen as well as USD if the crisis is EU based. We feel as the Asian Cartel picks up more strength and the USD Petrodollar becomes less powerful, this JPY/ Gold positive correlation will strengthen more.


Enda"s GBP/USD noted pairing is just icing on a Golden cake to us. But we are happy to now see it. -  SKG


GBPUSD top in place, GOLD ready to rocket?


by Enda Glynn of BULLWAVES.ORG


GOLD - 30 min


4 Hours


Daily


My Bias: Long towards 1550
Wave Structure: ZigZag correction to the upside.
Long term wave count: Topping in wave (B) at 1550
Important risk events: USD: N/A. 


Today"s rally in GOLD has triggered the alternate wave count for wave "ii" brown which I had spoken about.
That means wave "ii" brown traced out a running flat which bottomed at 1247.
The rise off that low now has a nice impulsive look to it,
and one more push up would break the resistance level and create a clear five wave form off the low.
That type of action would complete wave "1" pink.
Wave "2" pink should find support at 1259.
Any break of 1247 form this point will signal that wave "ii" brown was extending into a more complex form.


For early next week, watch for a break of 1271 to prove the bullish case.


Thats it for this week, I wish you all a happy and peaceful weekend.


GBPUSD


30 min


4 Hours


Daily


My Bias: short below parity.
Wave Structure:  continuing impulsive structure to the downside in wave (5)
Long term wave count: decline in wave (5) blue, below parity
Important risk events: GBP: N/A. USD: N/A. 


Well!
The market finally gave us the action which the main wave count had called for.
That is an impulsive decline in a possible wave "3" grey and a break of that important support line at 1.2865.


The focus has now fully shifted to the downside, and the beginning of a renewed downtrend in wave (5) blue.
The indesision in the wave pattern over the last few days was resolved with a very impulsive third wave down.


Wave "2" grey traced out a running flat correction, a wave which is always throws the cat amongst the pigeons!
At the moment I can count five waves complete "within wave "3".
For next week we should get a three wave correction in wave "4" grey and wave "5" grey will likely decline into the trend line once more.
Support at 1.2865 now becomes a significant resistance level and should hold the price down for now.
Look for wave "4" grey to complete below 1.2865 on Monday.


USDJPY


30 min


4 Hours


Daily


My Bias: LONG
Wave Structure: rally in wave [C]
Long term wave count: wave [C] is underway, upside to above 136.00
Important risk events: JPY: N/A. USD: N/A. 


Despite further declines today in USDJPY,
The price did not take out the support at 110.85 which leaves the bullish short term wave count intact.
Today"s decline completes a three wave form off the recent high labeled wave "1" pink.


The current wave count still calls for a major rally in wave "3" pink, and the support is at that wave "2" low of 110.85.
If the price breaks 111.95, then wave "3" will likely be underway.
A break of 111.47 strengthen the bullish case in the short term.
In the early trade next week, watch for the key support at 110.85 to hold, and a break of 111.47.


DOW JONES INDUSTRIALS


30 min


4 Hours


Daily


My Bias: market topping process ongoing
Wave Structure: Impulsive 5 wave structure, possibly topping in an all time high.
Long term wave count: Topping in wave (5)
Important risk events: USD: N/A. 


The DOW is now moving in a corrective pattern, possibly in wave "ii" pink.
I have labelled the short term chart as a complete wave "a" and "b" in blue.
That leaves wave "c" blue to the downside to finish off wave "ii" pink.


I have marked 20925 as the initial target for wave "c" blue.
This is the low of the previous fourth wave.
20875 marks the Fibonacci 38.2% retracement level.


For Monday, a break of 21037, the wave "a" low will signal wave "c" has started.
The low at wave "ii" pink offers the next best opportunity to enter long.


It is Memorial Day on Monday, and U.S market is closed, the London market is closed also for the summer bank holiday.
So, I will see you all again after the close on Tuesday the 30th.


More analysis HERE


Good Luck