Showing posts with label Atomic physics. Show all posts

Saturday, December 23, 2017

WORLD SILVER PRODUCTION: 3 Charts You Won’t See Anywhere Else

SRSrocco


By the SRSrocco Report,


The rate at which global silver production increased over the past century is quite astonishing.  When Columbus arrived in America (1492), the world was only producing 7 million oz of silver a year.  Today, the world"s largest primary silver mine, Fresnillo"s Sauicto Mine, produced three times that amount in just one year (22 million oz, 2016).  Yes, we have come along way in 500 years.


Just think about that for a minute.  One silver mine last year produced three times the global amount in 1493.  According to the U.S. Bureau of Mines 1930 Report on Summarized Data of Silver Production, the average annual silver production in the world from 1493 to 1600 was 6.9 million oz (Moz).  If we look at the following chart, we can see how world silver production increased over the past 500+ years:


As we can see, average annual world silver production increased from 6.9 Moz during 1493-1600, to 13 Moz from 1600-1700, 18 Moz from 1700-1800, 51 Moz from 1800-1900, 274 Moz from 1900-2000 and a stunning 722 Moz from 2000-2017.  Again, these figures represent the average annual silver production for each time period.


In the current period, 2000-2017, the world has produced 103 times more silver per year than from 1493-1600.  However, the next chart shows the total silver production for each period.  From 1493-1600, the world produced a total of 747 Moz of silver, compared to 13,000 Moz (13 billion oz) in just 18 years from 2000-2017:


Now, the reason the last silver bar on the right of the chart is lower than the previous one has to do with comparing 18 years worth of silver production (2000-2017) versus 50 years (1950-2000).  It took 50 years to produce 17,061 Moz during 1950-2000 versus 13,000 Moz in the 18 years from 2000-2017.


If we compare world silver production from the different periods, here is the result:


Percentage Of World Silver Production (1493-2017)


2000-2017 = 26.4%


1950-2017 = 61%


1900-2017 = 82%


While a little more than a quarter of all world silver production (1493-2017) was produced in the past 18 years, 82% were produced since 1900.  That is a lot of silver.  It turns out that 40.4 billion oz was produced from 1900-2017 out of the total 49.3 billion oz produced since 1493.  Interestingly, more than half of that silver was consumed in industrial silver applications.  I will be writing more about that in future articles.


The last chart I find quite interesting.  If we go back a little more than a century, the United States was the largest silver producer in the world.  In 1915, the U.S. produced 75 Moz of silver out of the total 189 Moz mined in the world that year:


Thus, in 1915, the U.S. produced 40% of all world silver production.  Mexico came in second in 1915 by producing 39.3 Moz.  However, U.S. silver production in 2017 will only be 34 Moz versus the estimated 870 Moz globally.  Thus, U.S. silver production only accounts for 4% of world mine supply versus 40% back in 1915.  What a change in 100 years.


Lastly, the U.S. imports approximately 22% of world mine production each year.  That is 193 Moz of the total 870 Moz in 2017.  While domestic mine supply is only 34 Moz, the United States has to import more than a fifth of global mine production to meet its silver market demand.


If you haven"t checked out our new PRECIOUS METALS INVESTING section or our new LOWEST COST PRECIOUS METALS STORAGE page, I highly recommend you do.


Check back for new articles and updates at the SRSrocco Report.

Wednesday, December 6, 2017

THE BLIND CONSPIRACY: The Gold Market Is Heading Towards A Big Fundamental Change

SRSrocco


By The SRSrocco Report,


SRSrocco


The gold market is heading towards a big fundamental change that few are prepared.  While many analysts in the alternative media community suggest that the gold price is manipulated due to Fed and Central bank intervention, there is another more obscure rationale that is the likely culprit.  I call it, "The Blind Conspiracy."


But, before I get into the details of this Blind Conspiracy, there are a few very troubling developments in the alternative media community that I would like to discuss first.  The bulk of these concerns has to do with the increasing amount of faulty analysis and misinformation as well as the peddling of lousy conspiracy theories on the internet.


Why is this a big problem?  Because a lot of readers are being misguided as to the true nature of the serious predicament we are facing.  Half of the emails that I receive are from readers who are bringing up doubts based on other analysts" faulty analysis and misinformation.  Thus, it takes a great deal of effort to provide the real facts and data to counteract the damage being done by certain individuals, even those with good intentions.


Furthermore, an increasing number of so-called precious metals analysts have switched over to Bitcoin and other cryptocurrencies, believing that gold and silver will no longer function as monetary metals.  However, some of these analysts suggest that silver will still be valuable because it will be used as critical raw material in advanced products in our new HIGH-TECH WORLD.  I find this idea of a future modern high-tech world quite amusing when we can"t even maintain the failing complex infrastructure we are currently using.


American Society Of Civil Engineers 2017:  U.S. Infrastructure Grade Is...???


According to the Amercian Society Of Civil Engineers, ASCE, they just came out with their grade this year for U.S. infrastructure.  Does anyone want to guess what overall grade we received here in the good ole U.S. of A?  The ASCE gave us a D+:


Well, at least a D+ isn"t an "F" grade.  Here is the ASCE"s Infrastructure Report Card Grading Scale for receiving a "D":


"D" GRADE = POOR, AT RISK
The infrastructure is in poor to fair condition and mostly below standard, with many elements approaching the end of their service life. A large portion of the system exhibits significant deterioration. Condition and capacity are of serious concern with strong risk of failure.


The ASCE U.S. Infrastructure Report also provides separate grades for different aspects of U.S. infrastructure.  For example, the U.S. Energy Infrastructure received a "D+" as well.  This is a brief description of the Energy Infrastructure:


Much of the U.S. energy system predates the turn of the 21st century. Most electric transmission and distribution lines were constructed in the 1950s and 1960s with a 50-year life expectancy, and the more than 640,000 miles of high-voltage transmission lines in the lower 48 states’ power grids are at full capacity.


Moreover, the report states that $4.5 trillion needs to be invested 2016-2025 to raise the U.S. infrastructure to a "B" Grade.  However, only $2.5 trillion has been budgeted.  Thus, we are $2 trillion short of the total amount needed.  Regardless, I doubt we will be able to spend anywhere close to the budgeted $2.5 trillion over the next decade for our infrastructure.  Unfortunately, I see the U.S. Government and private sector running into serious financial trouble by 2020 as the massive amount of debt and derivatives finally take down the system.


So, the question remains.  How are we going to move into a new HIGH-TECH world if we can"t even maintain our current infrastructure?


The notion that we can bring on some new "Energy Technology" fails to consider the tremendous amount of raw materials, manufacturing, transportation, and logistics to repair and maintain our current infrastructure.  You see, we have much bigger problems than just replacing an energy source or technology.  But, to understand that principle, you must look past superficial thinking and "Silver-Bullet energy technologies."


Now, if you hear certain analysts suggesting that gold and silver will no longer be used as money in the future because cryptocurrencies will take over the monetary role in our new high-tech world, you may want to contact them and provide the link to the U.S. Infrastructure D+ Grade Report.


Destroying Once Again.... Certain Myths About The Gold Market


If I collected an ounce of gold for every email that I have received about patently false gold myths and conspiracies; I could buy one hell of a lot of silver....LOL.  Gosh, if I went back to my email folder and added up all the emails on this subject, it would number well over 500 in my ten years publishing articles in the alternative media community.  However, I continue to receive the same type of emails because individuals are still being misled.


Before I begin, let me say that I focus my work on disproving the faulty analysis by other individuals, and not directing anything negative towards the person.  I am adamantly against the idea of "targeting the messenger."  Rather, I like to target the faulty message.  So, there is nothing personal in my attempt to set the record straight.


Let me start off by saying.... THERE AREN"T MILLIONS OF TONS OF HIDDEN GOLD in the world.  Anyone who continues to believe this needs to pay close attention to the following information.


One of my readers sent me the following recent YouTube video by Bix Weir, titled "Vast Gold Riches Hidden In The Grand Canyon":


In the video, Bix quotes a New York Times article published on June 19, 1912, that proclaimed vast gold riches in the Grand Canyon.  According to Bix, this massive gold find is what prompted the starting of the Federal Reserve because billions of ounces of new gold from the Grand Canyon dumped into the market would destroy the monetary system.


While this may sound plausible to the layman, if we carefully read the article and do some additional research, we will come to a much different conclusion than what Mr. Weir is suggesting.


First, Bix makes a grave error during the interview when he states "billions of ounces of gold," rather than "billions of Dollars of gold."  Here is the segment of the article:


There"s a big difference between a billion ounces of gold and a billion dollars worth of gold.  For example, the market price of gold in 1912 was $20.65 an ounce.  If we assume that $2 billion worth of gold was extracted from the Grand Canyon, it would equal approximately 100 million oz of gold.  If we take it a step further and convert it to metric tons, it would equal 3,110 metric tons.... a figure much much lower than one million tons stated by Mr. Weir.


Second, the article provides us with an idea of the very low quality of the gold found in the silt on the banks of the Grand Canyon:


As we can see, the individual in charge of the mining operation in the Grand Canyon stated that the value of gold was worth 50 cents per yard.  When gold miners refer to a "yard," they mean a cubic yard or a volume that equals 1.3 tons.  With an ounce of gold worth $20 in 1912, 50 cents a yard is a tiny amount of gold.  Thus, 50 cents worth of gold in a yard is approximately 0.025 oz or one-fortieth of an ounce of gold.


Let"s compare the supposed vast Grand Canyon gold riches worth 50 cents a yard to the gold mining that took place in Alaska during the same period.  According to the data provided by the U.S. Bureau of Mines in 1912 Report:


This chart represents "Placer" gold mining in Alaska, which was the same type of gold mining that took place on the banks of the Grand Canyon.  Placer gold mining is the process of washing gold from gravel, sand or silt.  Lode mining is extracting gold ores from veins in rock.  Here we can see that the average value of gold recovered in Alaska in 1912 was $2.10 per cubic yard.  Now, why on earth would anyone want to go to the remote location in the Grand Canyon and mine gold for 50 cents a yard when you could receive four times as much in Alaska???  Please, someone forward that information to Mr. Weir.


Third, the notion of extracting Billions of Dollars of gold from the Grand Canyon fails logistics miserably.  Let"s overlook  Mr. Weir"s error in quoting billions of ounces of gold rather than billion dollars of gold and consider the tremendous logistics of mining that amount gold out of the Grand Canyon.  According to the same U.S. Bureau of Mines 1912 Report linked above, Alaska produced a total of 7.4 million oz of gold worth $154 million between 1880 and 1912:


So, in over three decades of mining placer gold in Alaska, the total amount was $154 million.  Furthermore, the value of the gold per yard was likely much higher between 1880-1900.  Regardless, it took a great deal of human resources, energy, and capital to produce the $154 million worth of gold and the most ever produced in one year during that time-period in Alaska, was 1,066,000 oz of gold in 1906 valued at over $22 million.


Which brings us to the next logical conclusion.... was it ever possible for anyone to produce billions of dollars worth of gold valued at 50 cents a yard in the Grand Canyon when a small percentage of that amount ($154 million) took over three decades to produce in Alaska?  Hell, even during the mighty California Gold Rush of 1848, the peak year of 3.9 million ounces in 1852 was only worth $80 million.  However, the average annual gold production for the California gold rush was only 1.3 million ounces per year valued at $26 million.  It would take a great deal of time mining gold during the famous California Gold Rush to equal just $1 billion.


Even at $1 billion, that is only 50 million oz of gold or a measly 1,555 metric tons of gold.  Again, nowhere near the one million tons of gold suggested by Mr. Weir.


Lastly, the supposed vast gold riches in the Grand Canyon came to a dismal end.  That"s correct.  If we spent a few minutes doing a bit of research on the internet, we would find out The Rest Of The Ugly Story.


(American Placer Gold - Spencer Mining Operation 1911, Grand Canyon)


According to Arizona State history of gold mining at Lee Ferry in the Grand Canyon, the American Placer Gold company needed coal to process the gold.  Unfortunately, the only coal seam was 28 miles away.  So, the gold mining investors decided to incorporate a steamboat to transport the coal:


Investors decided a 92-foot steamboat would improve coal transport and gold production; it was ordered and assembled by late February 1912. Dubbed the Charles H. Spencer, the steamboat performed the way it was supposed to, but it burned most of the coal it transported in the process. Spencer also had trouble with his amalgamator and by 1912 his investors had seen enough and shut the project down. Spencer left, and his boat sank to the bottom of the Colorado River. The Charles H. Spencer is now on the National Register of Historic Places as a shipwreck in Arizona.


Just consider for a moment the type of intellectual thought process taken by these investors who couldn"t understand that the steamboat would consume most of the coal during its 28-mile trip.


Thus, the LIFE & DEATH of the Great Vast Gold Riches in the Grand Canyon came to an abrupt end, not because there were billions of ounces of gold that would destroy the global monetary system, but rather due to the typical mistake made by investors.  And that is... the belief that utterly incompetent management and miners could extract low-quality gold that is uneconomical to produce.


So, if we look at the New York Times article that Mr. Weir quotes as his source of billions of ounces of gold, we can logically assume that it was likely written by the company spokesman to get more POOR UNWORTHY INVESTOR SLOBS to purchase the American Placer Gold stock before it went belly-up.  It"s called the PUMP and DUMP.... a shady stock marketing technique that has been going on for hundreds of years.


If we can have an open mind and the ability to discern fact from fiction or lousy conspiracy theories, we can finally put an end to the notion that the world has a Million Tons of Hidden Gold in the world.


THE BLIND CONSPIRACY:  The Gold Market Is Heading Towards A Big Fundamental Change


Now that we have dispensed with certain conspiracies that don"t pass the smell test, there is a real one that very few are aware.  I call it the BLIND CONSPIRACY.  The interesting thing about this conspiracy is that nobody really knows about it.  However, it behaves like a conspiracy because many individuals and parties are manipulating the market which is providing a false sense of security to the average investor.


Thus, investors with a false sense of security, continue to invest in STOCKS, BONDS, and REAL ESTATE at amazing inflated values.  Today, the Dow Jones hit a new record high of 24,272 points:


If you look at this chart of the Dow Jones Index, it is starting to resemble the Bitcoin chart.  However, Bitcoin"s graph is moving up at a level  ten times more insane than the Dow Jones Index:


While the Dow Jones Index increased 4,200 points, or 21% since the beginning of 2017, the Bitcoin price has surged more than $9,000, or a staggering 1,125% increase.  Furthermore, the Bitcoin price doubled in just the past month.  This is completely insane.  Even though a lot of Bitcoin enthusiasts are shouting for $20,000 and $100,000 Bitcoin, if we are ever going to get there, there needs to be a serious correction first.  However, we may have already seen the top of Bitcoin at $11,400.


Folks, nothing goes straight up and then continues even higher.  I would be very cautious about investing in Bitcoin at this time.  Both the stock market and cryptocurrencies are extremely overbought... to say the least.  On the other hand, gold and silver have been selling off over the past several days and are even closer to their lows and cost of production.


Getting back to the Blind Conspiracy and the Big Fundamental Change in the gold market, investors are entirely in the dark about the dire energy predicament we are facing.  I continue to receive emails from individuals in various industries that tell me the "Situation is MUCH WORSE than you realize."  Also, there are good CLUES published in the media if you are IN-TUNE to this information.


According to this jewel, titled Oil Major: 70% Of Crude Can Be Left In The Ground, by Nick Cunnigham:


“A lot of fossil fuels will have to stay in the ground, coal obviously … but you will also see oil and gas being left in the ground, that is natural,” Statoil’s CEO Eldar Saetre told Reuters in an interview. “At Statoil we are not pursuing certain types of resources, we are not exploring for heavy oil or investing in oilsands.


If heavy oil and oil sands are to be left unproduced, then a lot of oil will need to stay in the ground. According to the USGS, about 70 percent of the world’s discovered oil reserves are in the form of heavy oil and bitumen. Much of that comes from Venezuela – one of the last places in the world that an oil company wants to do business in these days – and Canada.


Last year, Statoil abandoned Canada’s oil sands, selling off its assets to Athabasca Oil Corp. But Statoil is hardly alone in the exodus. ConocoPhillips unloaded a whopping $13.3 billion of oil sands assets to Cenovus Energy earlier this year. Shell sold off $4.1 billion in oil sands assets to Canadian Natural Resources. Meanwhile, ExxonMobil wrote off 3.5 billion barrels of oil sands from its book in February, admitting that they were unviable in today’s market.


ConocoPhillips’ CEO said that it would no longer invest in any oil project that needs a breakeven price of $50 or higher, according to the FT.


If the Major Oil Industry believes that upwards of 70% of the oil reserves should be left in the ground, how much do we really have left to produce??  Furthermore, it was quite surprising to see that the ConocoPhillips CEO said they would no longer invest in oil projects with a breakeven above $50.  Folks, there aren"t many oil discoveries available with a price tag less than $50 a barrel.


Again, the clues are all around.  Let me repost the completely awful financial results by the second largest natural gas producer in the United States.  Chesapeake Energy produced the second highest amount of natural gas during the first nine months of 2017 at 2.9 billion cubic feet per day compared to ExxonMobil"s 3.1 billion cubic feet per day.  So, what benefit did Chesapeake receive for producing the country"s second largest amount of natural gas?  Take a look at the Q3 2017 Cash Flow Statement:


After everything was considered, Chesapeake"s operations provided $273 million in cash (shown in the highlighted yellow).  For those who are not familiar with Cash Flow Statements, we subtract capital expenditures from cash from operations to arrive at their FREE CASH FLOW.  Unfortunately for Chesapeake, they spent a staggering $1.6 billion (highlighted in blue) on drilling and completion costs (capital) to produce their natural gas and oil.  Thus, Chesapeake"s Free Cash Flow was a negative $1.3 billion.


That would have been terrible news if it wasn"t for the sale of properties of worth $1,193 million ($1.2 billion.. two lines below the highlighted blue line).  Which means, the financial wizards at Chesapeake used asset sales to help pay for their natural gas drilling capital expenditures.  How long can Chesapeake sell properties to fund their drilling costs??


Are we starting to get a PICTURE here?  Regrettably, even highly trained energy analysts do not understand that the oil and gas industry is cannibalizing itself just to stay alive.  If investors do not understand just how bad our energy situation has become, they are BLINDLY investing in the worst assets (STOCKS, BONDS & REAL ESTATE) that derive their value from the burning of ENERGY.


This is the BLIND CONSPIRACY.  It"s taking place right in front of our eyes, and virtually no one sees it.


We are going to experience a Massive Fundamental Change in the gold market because investors will finally begin to understand what a true store of wealth is versus one that is an ENERGY IOU.  Stocks, Bonds, and Real Estate get their value from burning energy IN THE FUTURE, while a gold or silver coin bought today, received its value from burning energy IN THE PAST.  That is a big difference that investors, even precious metals investors fail to realize.


Lastly, if you want to pay more for precious metals, than I suggest you don"t check out our PRECIOUS METALS INVESTING section or our new LOWEST COST PRECIOUS METALS STORAGE page.


Check back for new articles and updates at the SRSrocco Report.

Tuesday, December 5, 2017

Gold Breaks Below Key Support, Drops To 4-Month Lows

At 0907ET, someone decided it was the perfect time to dump $1.5 billion notional worth of gold, smashing the precious metal below its 200-day moving-average and back down to 4-month lows...


And so, once again, gold futures are tumbling...


To 4-month lows...but still up around 10% year-to-date...


What"s driving the gold weakness? Who knows... because it"s not the dollar...


Though Gold"s sensitivity to USDJPY has picked up notably...


The War On Gold Intensifies: It Betrays The Elitists" Panic And Coming Defeat - Part 1

Authored by Stewart Dougherty via InvestmentResearchDynamics.com,


Dictatorship (noun):  Definition #3:   absolute power or authority (Websters);
Def. #2:   absolute, imperious or overbearing power or control (Random House);
Def. #3:   Absolute or despotic control or power (American Heritage);
Def. #3:  Absolute or supreme power or authority (Collins English Dictionary);
Def. #1:  A type of government where absolute sovereignty is allotted
to an individual or small clique (Wikipedia).


“If you know the enemy and know yourself, you need not fear the result of a hundred battles. If you know yourself but not the enemy, for every victory gained, you will also suffer a defeat. If you know neither the enemy nor yourself, you will succumb in every battle.” Sun Tzu, The Art of War


In recent weeks, the War on Gold, which is a subset of the broader War on Human Freedom, has sharply intensified, with massive, multi-billion dollar naked short price raids now being launched on a weekly and even daily basis by the criminal, state-sponsored price manipulators. This escalation proves the supreme importance to the Deep State financial elite of the maintenance of their gold price dictatorship, which is a vital component of their long term, systemic campaign of financial plunder.


The elitists have no problems whatsoever with stratospheric stock and bond prices; 5,000 year low interest rates; $450 million Da Vinci’s; $250 million private homes; $50,000,000 annual salaries for circus masters, whose role in keeping the masses distracted and dumb is vital; $1.9 million Aston Martins; $100,000 Air Jordan sneakers, or any of the other prices that have now gone into outer space.


But there is one thing they will not accept: an honest, free market price for gold. Because while all debauchery under the sun is permitted and encouraged in the Castle of Fraud and Corruption they have constructed and in which they revel, one thing is strictly prohibited: the utterance of truth. Being monetary truth when free to speak, gold is their deadliest enemy. Therefore, it is silenced, in the same way truth tellers are silenced in all dictatorships.


The vast majority of people, aside from a small, enlightened minority who refuse to poison their minds by ingesting mainstream media (MSM) fake news, propaganda and brainwashing, do not yet realize what they are up against in the wars that have been declared against them, and are therefore at serious risk. For those who wish to survive the wars, there has never been a greater need to know the enemy and know yourself.


As the gold price war becomes manic, so has the MSM’s anti-gold propaganda campaign, with their attempts to smear gold now a clinical obsession.


In a prime example of their over-the-top anti-gold propaganda, on 10 November 2017, the Financial Times, a long-time Deep State bullhorn and puppet, ran an article entitled, “Gold is the new cocaine for money launderers.” In this screed, the author beat the dead horse of the NTR Metals gold import scheme. This operation, whose total dollar yield was an infinitesimal fraction of the massive sums stolen by the financial Deep Statists in their forty year gold price manipulation crime, was already the subject of an over-dramatized Bloomberg Businessweek propaganda piece published on 9 March 2017, entitled “How to Become an International Gold Smuggler.” Apparently, the MSM is running so short of new material with which to try to demonize gold, that it is now forced to recycle old, stale non-stories to keep the smear machine going.


In the article, the MSM propagandist states such things as: 2017 has seen, according to his one time Goldman Sachs source, a “dramatic crash in [physical gold coin] demand,” that interest in gold coins is linked to “political conservatism, or anarcho-libertarianism” and “end of the world right wing sentiments,” that gold has been implicated in a “conspiracy to commit money laundering,” that gold is “financed by people in the narcotics trade,” that it comes from “illegal mines and drug dealers in Peru, Bolivia and Ecuador,” that “the federal authorities assume the NTR Metals [case] represented only a fraction of illegally sourced and financed gold,” that therefore the US attorney is broadly investigating the gold industry, that gold is “produced by exploited workers,” that “crude [gold] extraction techniques create serious and lasting environmental damage,” that gold plays an important part in “tax evasion,” that it is related to American gun sales, which the author abhors; that “drug dealers [use] gold imports as a way of laundering their proceeds,” and that “they came to realize that illegal gold [is] an intrinsically better business” than drug dealing; to name but a few of the aspersions cast against gold in the short article. As we can see, when it comes to their smear jobs, the MSM flings at the wall all the mud it can fit in its hands, hoping that some of it might stick.


As is always the case with the MSM’s consistently negative, biased and dishonest reporting on gold, no mention was made in the article of the Deep State financial elite’s criminal gold price manipulation fraud that has been perpetrated non-stop for nearly forty years and that has resulted in a massive, $1,000,000,000,000.00+ theft from its victims. This is because the MSM is the Deep State’s in-house public relations agency, whose job is to whitewash the elitists’ crimes, no matter how egregious they are.


But buried in the article was an important clue that the Deep Statists are concerned they are losing the War on Gold, which we will further explore later in the article. It turns out that the Deep Statists’ paranoia about and rage toward gold might be entirely justified, because more than ever in the past 37 years, gold is poised to tell the world what it knows, and this will absolutely annihilate them.


Many people are completely baffled as to why, with so many serious fiscal, financial, monetary, economic, social, and geopolitical problems in the world, the Deep Statists remain so mono-maniacally fixated on demagogically denigrating gold and controlling its price.


The answer is that the Deep Statists cannot, under any circumstances, allow the price of gold to replicate the surging price of Bitcoin and other cryptocurrencies. If the gold price genie were to get out of the bottle, becoming international news in the process no matter how much the MSM might try to suppress it, it would spur a gold buying stampede that would cause a flood of money to pour out of bank accounts and into physical precious metals. $325+ billion worldwide now resides in cryptocurrencies, a highly specialized and complex product class. In the right set of circumstances, many multiples of that amount could incrementally flow into gold, a simple product that has been innately understood for millennia by human beings all over the globe.


Already fragile, the banking system cannot withstand a large scale withdrawal of funds. Being finite and in short supply, incremental demand for physical gold would result in immediate and sustained price gains, creating a positive feedback loop in the market place. As people watched the price go up, more and more of them would want to jump on the band wagon and participate in the gains, which is exactly what has happened in the cryptocurrency market.


If interest in gold goes mainstream, then basic supply fundamentals indicate the price would have to rise by thousands of dollars per ounce to even approach what might be considered overbought and/or bubble territory. Which is exactly what has happened to Bitcoin, whose price has exploded to over $10,500 as of today, 29 November 2017.


In the United States, the latest Federal Reserve Board tally of Household and Non-profit Organization (much of which is private) wealth totals $96.2 trillion. If a miniature, 1% sliver of this amount, $962 billion, attempted to find its way into the physical gold market, it would represent incremental demand, at $1,300 per ounce, of 740 million ounces. Not even a small fraction of this incremental demand would be available in the physical gold market at this time, given that it already operates at a supply / demand equilibrium. The gold price would have to surge in order to flush out supplies from current gold owners, whose hands have proven to be, and are likely to remain strong. We believe it would take years for incremental demand of this magnitude to be filled, even at much higher prices. Please keep in mind that this example relates to the United States, alone; there are additional, vast stores of private wealth all over the world, all of which would almost certainly be activated in unison by a run to gold.


With the right spark, the same viral, Social Media-enhanced demand that has come to cryptocurrencies could come to gold. The Deep Statists know it, and the ghostly whites of their eyes now glow eerily and blinkingly across the dark battlefield of Liberty, in the senseless war they provoked and are going to lose.


While there are now hundreds of cryptocurrencies, physical gold is physical gold, and cannot be replicated or conjured out of nothing. There will be no endless stream of new ICOs for genuine, physical gold, because gold is what it is and always will be. This means that funds flowing into gold will be forced into the one and only physical gold market that already exhibits tight, inflexible supply. This further means that the upward price pressure on gold could become volcanic if a run starts.


A steadily increasing number of people will want to get in on the “new Bitcoin,” a bizarre paradox given that gold is as old as time, and will soon realize that gold possesses virtues Bitcoin does not, given that it is real, not digital and abstract; that owners can personally possess and store it in physical form; that it will survive any kind of electric grid or Internet disruption that might occur; that it cannot ever be hacked; that it is the epitome of private, quiet wealth; that it is actually quite beautiful to behold; and that it was not and cannot be made by man, only by God, who does not appear to have any interest in making any more of it.


To date, in order to prevent a surge in physical gold demand from happening, the Deep Statists have created various forms of transparently fake gold, such as electronic gold futures, options and non-auditable ETFs and EFPs. These fake gold products have siphoned funds away from real, physical gold, which cannot be created out of the nothing the way the imposter electronic gold products can be. Increasingly, people are learning that there are no substitutes for physical gold.


More, we find it interesting that while there have been certain highly publicized condemnations of cryptocurrencies, such as J. P. Morgan Chase CEO Jamie Dimon’s comment that Bitcoin is a “fraud,” the financial authorities in the west have done little to nothing to shut down the crypto market. They seem to be just fine with $10,500 Bitcoin, but will stop at nothing to prevent $1,300 gold. Today’s (29 November) market action is a case in point.


The reason is that monetary elitists fully approve of cryptocurrencies, because this the new form of fiat currency the western banks intend to issue. Mass adoption of cryptocurrencies is the necessary forerunner to the elimination of cash, a well-known and important agenda for the financial elite. By issuing their own cryptocurrencies, and/or co-opting Bitcoin and other private cryptos via regulation and edict, central bankers can continue their tradition of controlling the money supply. A population that has learned the value of owning and become adept at trading physical gold would prevent central banks from continuing to use fiat currencies as economic, political and societal control mechanisms. It should be no surprise that they loathe gold so much; in its honesty and integrity, it is the exact antithesis of everything they stand for, are, and do.


Some people argue, “Even if people run to gold, their funds will still remain within the banking system, so the bankers aren’t worried about this happening.” In our opinion, this is wrong.


Fiat currency used to buy precious metals will move from personal and business bank accounts, to gold dealer accounts, to gold wholesaler accounts; and then to a variety of sovereign mint, gold precious metals refiner, gold miner and other gold supplier accounts, a large percentage of which are international.


A bank that hosts a deposit account used to purchase physical gold has no assurance whatsoever that the buyer’s funds will transfer into another personal or business account managed by it. In all likelihood, the funds will disappear from the host bank and not return. Ultimately, the likelihood is also high that a portion of the funds, potentially significant, will disappear from the country’s banking system altogether, given the global nature of gold mining, refining, minting and fabrication. Therefore, bankers regard a run to gold as a severe, direct threat to them, which is why they do everything in their power to discredit it and crush its price. They are attempting to prevent a run on their banks.


Over the past several years, the Deep Statists have gone to extraordinary lengths to internationally legalize bank “bail-ins.” They did not do this casually, by accident, or for fun; they did it because they know that when the system fails, a time-bomb guaranteed to detonate given the system’s very design, they will be able to make an unprecedented fortune by expropriating customers’ deposits via the elaborate bail-in mechanism they have engineered. They will use the phony pretext of “rescuing” and “resetting” the financial system for the public good to justify this action. If, before they spring the bail-in trap, depositors have already withdrawn their funds to purchase physical precious metals held outside the banking system, those funds will no longer be available for bail-in looting. The bankers cannot steal bank balances that have disappeared.


The cryptocurrency phenomenon, now an international sensation, has stunned them into the awareness that people all over the world have a deep, abiding, instinctive desire to own honest money of limited supply that will serve as a reliable store of value, and that cannot be hyper-inflated into oblivion for the private gain of plunderers and profiteers, the chief problem with corrupt, endlessly counterfeited fiat currencies controlled by self-interested, opportunistic, predatory central bankers and their controllers, the Deep State financial elite.


*  *  *


Due to the length of this article, we have divided it into two parts. This ends Part 1. In Part 2, which is already written and will be released in a few days, we will share with you important clues indicating the Deep State’s concerns about losing the War on Gold, despite the unprecedented intensification of their attacks. We will also discuss how the United States Federal Reserve is outright warning that new threats to financial and economic stability are on the horizon.


Friday, November 10, 2017

Gold Slammed After Someone Pukes $4 Billion Notional In Gold Futures

As we approach the European close, the dolar index just spiked and precious metals (and crude) were pummeled. Gold futures tumbled on massive volume as over $4 billion notional was purged instantaneously...


Over 30,000 contracts ripped through gold futures - over $4.2 billion notional - in the space of a minute. That"s around 10% of a normal days" volume.


NOTE - $1281 is the 100-day moving average that has been an equiliborum level for the last few weeks...


Silver was hit too as the dollar spiked...


Notably Gold remains the only winner post-Saudi chaos... for now...


Finally, we thought this was interesting...


Tuesday, November 7, 2017

Stocks Sink Back Into Red After Saudi Purge

Bonds and Bullion continue to lead after this weekend"s "pre-emptive coup" in Saudi Arabia but stocks have given up their gains and the dollar is sinking once again...


Small Caps are under the most pressure for now - perhaps as hope for tax reform fade...


As HY credit signals perhaps more pain to come for small caps...


Wednesday, November 1, 2017

Doc Copper/Gold ratio breaking 10-year support


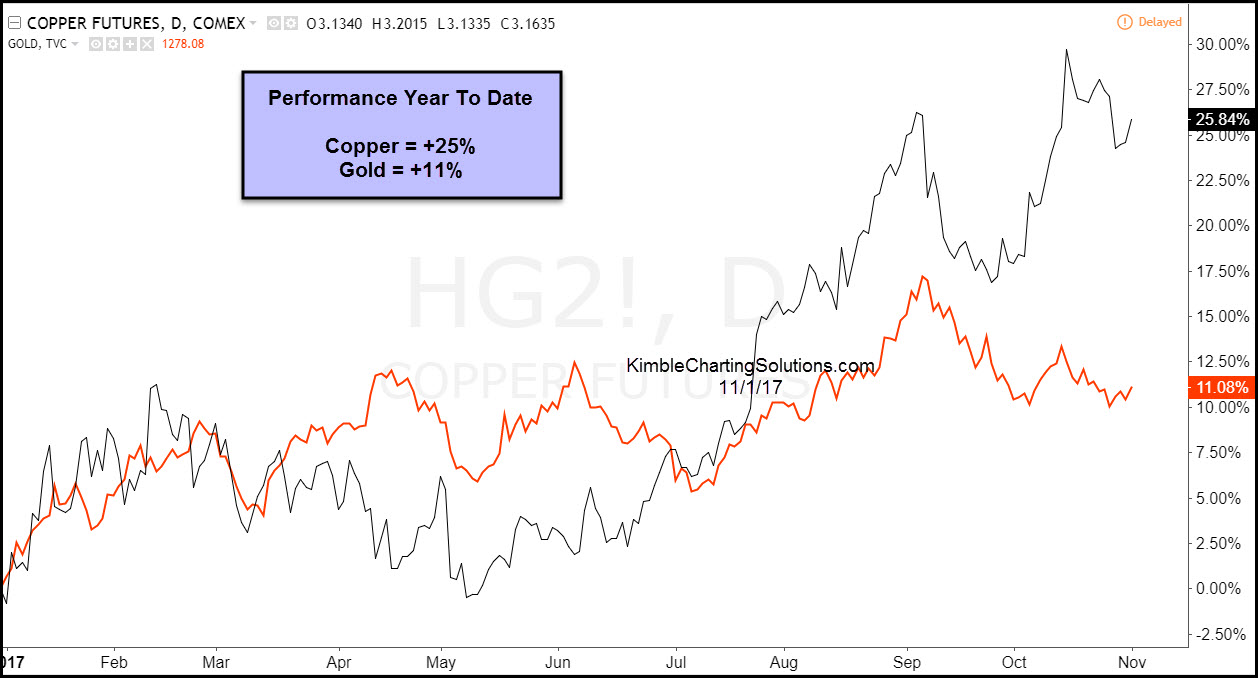
Doc Copper and Gold have both done well this year. Doc Copper has been the stronger of the two, reflected in the chart below-


CLICK ON CHART TO ENLARGE


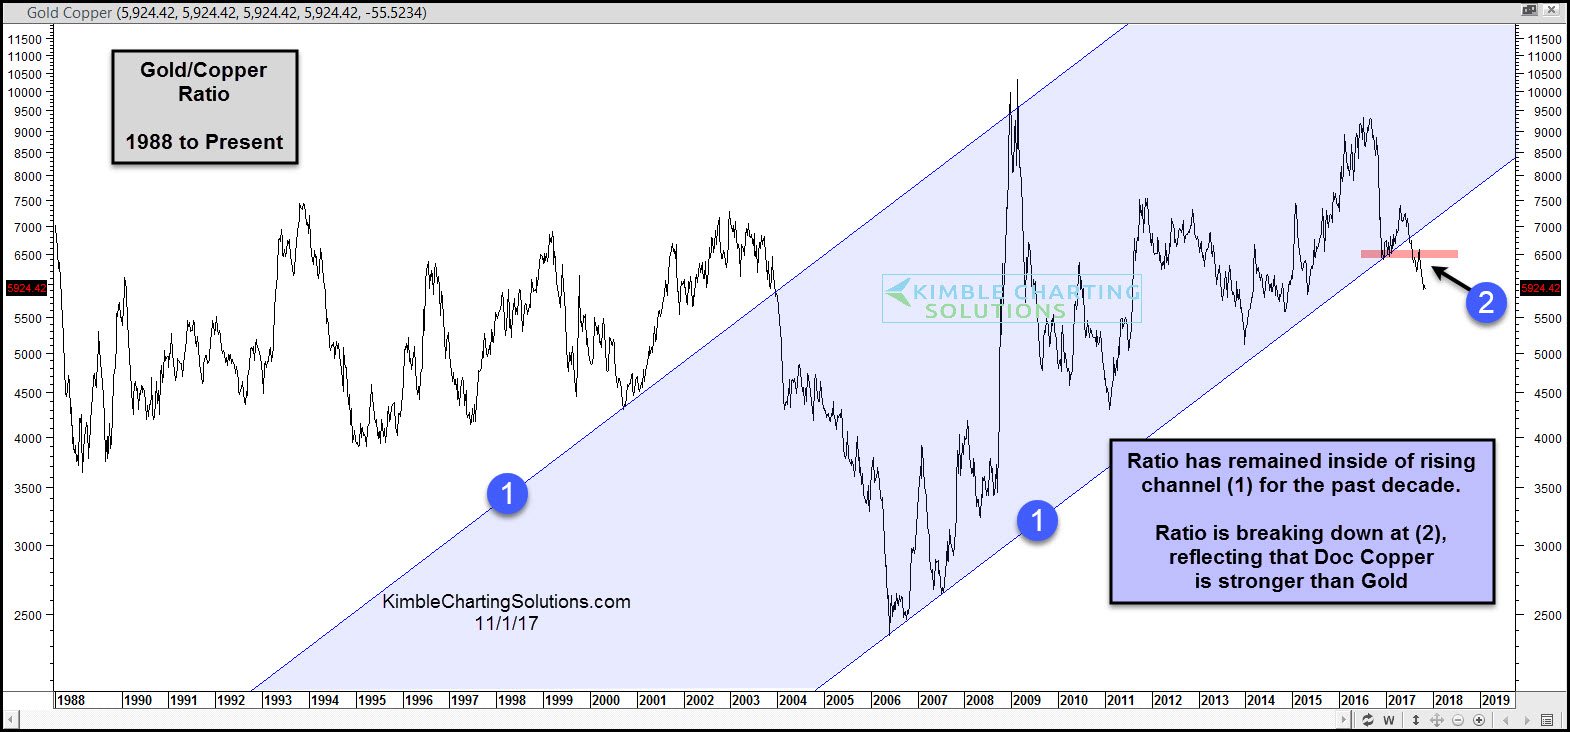
The strength in Doc Copper has the Copper/Gold ratio below doing something it hasn’t done in a long time!


CLICK ON CHART TO ENLARGE


The Doc Copper/Gold ratio has remained inside of rising channel (1) for the past decade. The ratio of late is now breaking below 10-year rising support at (2).


When attempting to decide on what metals to own, this break of 10-year rising support could be sending a very important message to the metals market and could be sending an important macro message as well.


Why you see chart pattern analysis with brief commentary:   There is a ton of news and opinions around markets and assets that make the decision-making process more difficult than it needs to be.   I believe the Power of the chart Pattern provides all you need to see what is taking place in an asset and determine the action to take.  This approach has worked well for me and our clients and I encourage you to test it for yourself.


Receive my free research posted on the blog daily here 


Or,  send an email if you would like to see sample research and take me up on a trial of my premium or weekly research where I provide actionable alerts on breakouts and reversals in broad market indices, sectors, commodities, the miners and select individual stocks 


Email services@kimblechartingsolutions.com  


Call us Toll free 877-721-7217 international 714-941-9381 


Website: KIMBLECHARTINGSOLUTIONS.COM 


Thursday, October 26, 2017

As Lithium Booms, Some Analysts Sound Note Of Caution

In “Mad Scramble for Lithium Mines From Congo to Cornwall”, Bloomberg puts some colour on current conditions in the red hot sub-sector.


For evidence of just how hot battery ingredient lithium is right now, look no further than Australia’s AVZ Minerals Ltd. A penny stock until a few months ago, the mining hopeful has surged about 1,300 percent this year. The proposition: recasting a remote, century-old tin mine in the Democratic Republic of Congo as a supplier of lithium needed to power electric cars. While its rise has been dramatic, AVZ isn’t alone in the rush to position for a rechargeable-battery boom.


In the U.K., a company (Cornish Lithium) founded by former investment banker Jeremy Wrathall Cornish Lithium is planning to tap thermal springs in Cornwall, a region more famous for its beach coves.


Cornish beach cove…but have you tried driving to one from London (takes hours).


Other companies are hunting for lithium deposits from Germany to Mali, and even Afghanistan plans to tender exploration permits.


As we explained last month, there is so much interest in lithium – mainly due to its application in electric vehicles and energy storage - that the Lithium and Battery tech ETF has seen record volumes and the LME is reportedly considering the introduction of a lithium (carbonate) contract.


While everybody has been fretting about the supply side, some analysts are starting to question whether the supply side will expand too fast in the coming years, as Bloomberg explains.


"You’ve got a scramble for deposits, a demand side that looks very impressive, the question is always around the supply," said Paul Gait, an analyst at Sanford C. Bernstein Ltd. in London. In the rush to meet demand there is a risk too many mines will be developed and too much metal supplied, Gait said.


"When the tide goes out, those that do not have good geology will always be found wanting."


Bloomberg notes that uncertainty about global production growth has encouraged some users to lock-in future supplies of the metal.


However, while production might struggle at first to catch up with demand growth, lithium isn’t really rare compared with other battery metals like cobalt and graphite, according to Bloomberg Intelligence analyst Eily Ong. And mining history is full of cautionary examples of booms that ended in bust when the rush to boost supply overshot demand growth. Iron ore is a recent example, after a boom in Chinese steel production led to a push to build new mines. That turned out poorly for many of the iron ore upstarts that either struggled to build projects or brought mines into production just in time for prices to drop. Global lithium production increased by about 12 percent last year, with batteries accounting for about 39 percent of consumption, according to the U.S. Geological Survey. While Australia was the largest producer in 2016, its identified resources are dwarfed by Argentina and Bolivia, each with about 9 million tons and Chile, with more than 7.5 million tons.


 “This is not a metal that’s going to be exempt from the normal laws of commodity economics,” said Bernstein’s Gait. “Sooner or later we will over supply.”


Bloomberg cites a report from Liberum Capital, the London-based brokerage…


There are about a dozen projects being built or expanded around the world, according to Liberum Capital Ltd. Those, plus a handful of others seen as likely to proceed, could help nearly triple global lithium supply by 2025, but still fall short of expected demand. Beyond that, there’s a further eight projects that haven’t secured financing yet, but could possibly push the market into a surplus by 2025, Liberum said in a report. Lithium carbonate prices have more than doubled in the past two years, according to data from Benchmark Mineral Intelligence.


“With prices where they are right now, there’s not a potential lithium mine in the world that doesn’t make an extraordinary amount of money,” said Liberum analyst Richard Knights. “There’s every incentive to bring supply on.”


…and a report from BMO Capital Markets published earlier this week.


Current shortfalls may abate by 2019-20 based on the strong supply response, BMO Capital Markets analyst Joel Jackson said in a note dated Oct. 24. However, uncertainty about assumptions including electric-vehicle penetration, battery technology and lithium supply growth makes the market balance difficult to predict, he said.


The Bloomberg article circles back to AVZ Minerals.


In Congo, AVZ must still prove that extracting the lithium is economically viable. It will also need to rehabilitate an old power station to reach production and build over 600 kilometers (372 miles) of roads to connect the mine with the regional capital of Lubumbashi for exports. Still the project is attracting investors, including China’s Zhejiang Huayou Cobalt Co., one of the world’s biggest refiners of cobalt. "The biggest companies in China are just queuing up," AVZ Chairman Klaus Eckhof said from Dubai.


"They all want to be part of it because they don’t have a pipeline of supply, my phone keeps ringing."


Monday, October 23, 2017

Neck and Neck: Russian and Chinese Official Gold Reserves

Submitted by Ronan Manly, BullionStar.com


Official gold reserve updates from the Russian and Chinese central banks are probably one of the more closely watched metrics in the gold world. After the US, Germany, Italy and France, the sovereign gold holdings of China and Russia are the world’s 5th and 6th largest. And with the gold reserves ‘official figures’ of the US, Germany, Italy and France being essentially static, the only numbers worth watching are those of China and Russia.


The Russian Federation’s central bank, the Bank of Russia, releases data on its official gold holdings in the Bank’s monthly “International Reserves and Foreign Currency Liquidity” report which is published towards the end of the third week of each month, and which confirms gold reserve changes as of the previous month-end.


The Chinese State releases data on its official gold holdings via a monthly “Official Reserve Assets” report published by the State Administration of Foreign Reserves (SAFE) that is uploaded within the Forex Reserves pages of the SAFE website. This gold is classified as held by the Chinese central bank, the People’s Bank of China (PBoC). The SAFE report is published during the 2nd week of each month, reporting on the previous month-end.


In both reports, official gold reserves (i.e. monetary gold) are specified in both US Dollars and fine troy ounces. Monetary gold is gold that is held by a central bank or other monetary authority as a reserve asset on a central bank’s balance sheet.


Delta: 63 Tonnes


For the Bank of Russia, its latest report, published on 19 September 2017 addressing August month-end, shows the Bank holding 57.2 million fine troy ounces of gold (1779 tonnes). For the Chinese State, the latest SAFE release is reporting Chinese official gold reserves of 59.24 million ounces (1842 tonnes).


Russian gold reserves, as officially reported, now total 1779 tonnes, and are now just 63 tonnes shy of the ‘official’ gold reserves of the Chinese central bank. Given that the Bank of Russia is expected to add about another 36 tonnes of gold to its official reserves during the remainder of 2017,  then if the Chinese State does not reveal any increase in its ‘official’ gold reserves between now and the first quarter of 2018, Russia will most likely surpass China in terms of official gold reserves by April 2018.


While its possible and probable that the Chinese State / PBoC really holds more gold than it claims to hold, any upcoming scenario in which the Bank of Russia surpasses the People’s Bank of China in terms of gold holdings would at least be symbolic in terms of international monetary developments, and would be sure to generate some chatter in the financial press.


Although the official gold reserves of these two key nations are now nearly neck and neck, there are still some interesting contrasts between them, not least the way in which the Bank of Russia’s reported gold holdings have been steadily increasing month on month, while the reported gold holdings of the People’s Bank of China have remained totally unchanged for nearly a year now, since the end of October 2016.


Therefore the situation which is now emerging, i.e. the distinct possibility that Russian official gold reserves will surpass those of China something in early 2018, is a situation which is emerging precisely because the Russian Federation keeps adding to its gold reserves, while the Chinese State seemingly does not.


Differing Styles of Communication


The routes via which these two strategically important nations have amassed their official gold reserves are also quite different, at least at a public reporting level.


Bank of Russia Gold Reserves: 2006 – September 2017, Source:www.GoldChartsRUs.com


It wasn’t so long ago (2007) that the gold reserves of the Russian Federation were still in the region of 400 tonnes. However, beginning in about the third quarter of 2007, the Bank of Russia began a concerted campaign to rapidly expand its official gold holdings, a trend which never subsided and which has been ongoing now for exactly 10 years. By early 2011, official Russian gold reserves had exceeded 800 tonnes. By the end of 2014, the Bank of Russia was reporting holding more than 1200 tonnes of gold. And by the end of 2016, Russian official gold were more than 1600 tonnes. For full details on the Bank of Russia’s gold holdings, including gold storage, gold reserve management, gold purchases and Russian government views on gold, see “Bank of Russia, Central Bank Gold Policies” at BullionStar’s Gold University.


From the above chart, it can be seen that during 2014, 2015 and 2016, respectively, the Bank of Russia added 171 tonnes, 208 tonnes, and 199 tonnes to its gold reserves, or in total 578 tonnes over a 3 year period. In 2017, with the Bank of Russia having added another 164 tonnes of gold for the year to end of August, its official gold reserves now stand at 1779 tonnes.


The route to the Chinese State accumulating 1842 tonnes of gold is a different one to that of the Russians, again at least from a publicly reported angle. While the Bank of Russia has historically published changes to its gold reserves on a monthly basis, the Chinese central bank has chosen to remain very secretive, and between 2001 and mid 2015 had only issued four public updates addressing the size and growth of its gold reserves. These 4 updates were as follows:


  • 4th Quarter 2001: From 394 to 500 tonnes: A 106 tonne increase

  • 4th Quarter 2002: From 500 to 600 tonnes: A 100 tonne increase

  • April 2009: From 600 to 1,054 tonnes: A 454 tonne increase

  • July 2015: From 1,054 to 1,658 tonnes: A 604 tonne increase

Beginning in July 2015, however, the Chinese State started to report changes in its official gold reserves on a monthly basis, and by July 2016 was reporting 1823 tonnes of official gold holdings. The following graphic, taken from a BullionStar infographic on the Chinese gold market, illustrates the sporadic reporting of Chinese official gold reserves between the early 2000s and July 2015. Note that between July 2016 and October 2016, the Chinese State through SAFE reported that the PBoC had acquired another 19 tonnes of gold, taking its total reported gold reserves to 1942 tonnes as of the end of October 2016.


Chinese Official Gold Reserves, 2003 – 2016 Source: Chinese Gold Market Infographic, BullionStar


The sparse official reporting by the Chinese is also clear in the below chart from the GoldChartsRUS website, which shows cumulative holdings of monetary gold by the People’s Bank of China (PBoC) between 2000 and 2017. Looking at the top panel of the chart, it can be seen that between 2001 and 2015, there were only 4 distinct jumps in the quantity of gold held by the PBoC.


This was followed by a period of about 15 months from July 2015 during which SAFE reported small monthly accumulations in PBoC’s gold holdings, as can be seen from the gradual increases in the bars in the top panel from July 2015 to October 2016, and the corresponding presence of frequent activity in the monthly changes in the lower panel of the chart.


Official Gold Reserves of the Chinese central bank: Divulged Holdings 2000 – 2017. Source:www.GoldChartsRUs.com


By September 2016, Chinese State gold reserve holdings had reached 59.11 million ounces. In October 2016, the SAFE report announced that Chinese official gold holdings had reached 59.24 million ounces, a 0.13 million ounce increase from the previous month. However, then something unusual happened, at least in terms of monthly updates. Since October 2016, Chinese official gold reserves have not changed at all. The SAFE updates are still published each month, but the gold holdings figure has remained unchanged at 59.24 million ounces (1842 tonnes).


Therefore, for nearly a year now, the Chinese authorities are signalling that they have not acquired any new gold. At least that is what they want the public to believe. Hence the constantly recurring headlines from the financial media, such as this one from Reuters a couple of weeks ago, “China gold reserves steady at 59.24 mln ounces at end-September – central bank”.


But is it true that China only holds 1842 tonnes of gold and that it has not been active during the last year in continuing to accumulate monetary gold as part of its reserve assets? And for that matter, is it the case that the Bank of Russia and Russian Federation only hold 1779 tonnes of monetary gold?


While its difficult to know for sure, it is possible that the People’s Republic of China and the Russian Federation both hold additional gold that is not reported by their monetary authorities. This is so for multiple reasons, including the opaque ways in which these monetary gold reserves are accumulated, the traditional secrecy of both governments, and the fact that both countries have access to other investment pools that might hold gold that can be transferred at short notice into the respective central banks’ official gold holdings.


How Much Gold could the Chinese State really have?


The historical track record of the Chinese State in sporadically communicating the size of its monetary gold holdings shows that there has often been a large gulf between the true size of its gold reserves and what the Chinese claimed to have via its piecemeal and rare updates. For example, even based on its official numbers, the PBoC accumulated over 600 tonnes of gold between April 2009 and July 2015 but did not reveal this until July 2015.


The nearly year-long hiatus between October 2016 and the present, during which the Chinese authorities, via SAFE, claim that the PBoC’s gold holdings have remained at 1842 tonnes, could be true, but only in so far as the Chinese State does not wish to inform the world about its sovereign gold reserves. Beyond this, the true gold holdings of the Chinese central bank may be significantly higher than even official published figures suggest.


There is very little transparency into how the Chinese authorities accumulate monetary gold. In July 2015, when SAFE announced the first update to its gold holdings since 2009, it stated that the “major channels of accumulation” of gold were from purchases in foreign markets, domestic gold production, domestic scrap sources, and other transacting in the domestic market. But beyond this, the Chinese authorities never comment on where they source gold from.


There is lots of evidence that the Chinese State purchases significant quantities of gold in the international market, including in the London Gold Market, and then monetises this gold (i.e. classifies it as monetary gold) , before transporting it back to Beijing. See “PBoC Gold Purchases: Secretive Accumulation on the International Market”, at BullionStar Gold University for further details.


The Chinese State is also a possible candidate for having purchased a tranche of the IMF’s gold during IMF gold sales in 2010. See BullionStar blog  “IMF Gold Sales – Where ‘Transparency’ means ‘Secrecy’” for further details.


There are also plenty of other State entities and state controlled entities in addition to the Chinese central bank that could conceivably be holding gold reserves that could in time be reclassified as PBoC gold, and brought into the sphere of reporting. See section “Gold Transfers from other Chinese State entities” in BullionStar Gold University article “Gold Policies of the People’s Bank of China” for further details.


There is also evidence to suggest the Chinese State is really buying about 500 tonnes of gold per year, and that it has a first step target of holding at least 4000 tonnes of gold. This evidence, which is from 3-5 years ago, comes from senior people in the China Gold Association (CGA). See section “How much gold might the PBoC be buying each year?” in article PBoC Gold Purchases.


A gold reserves-to-FX reserves ratio of 5% would currently put Chinese state gold holdings at nearly 4000 tonnes. A gold-to-GDP ratio of about 1.77%, which is the equivalent of the gold-to-GDP ratio of the US, would currently put Chinese state gold holdings at nearly 5000 tonnes of gold.


Russia: Golden Pipelines and Stockpiles


In its “Methodological Notes to International Reserves of the Russian Federation“, the  Bank of Russia defines “monetary gold”  as:


“standard gold bars and coins with a purity of at least 995/1,000 held by the Bank of Russia and the Government of the Russian Federation. It comprises gold in vault, en route and in allocated accounts, including that which is held abroad. The item monetary gold includes unallocated gold accounts with non-residents.”


The primary source of gold flowing to the Bank of Russia comes from Russian gold mining production, with the Russian Federation acquiring a large percentage of domestic gold mining production each year. In practice, a small group of state influenced Russian banks are authorised to intermediate between the gold mining companies and the State, acting as a gold pipeline between the mines and the Bank of Russia / Government. These banks finance the mining companies, purchase their gold output , have it refined into gold bars by Russian gold refineries, and then offer this gold to the Russian State.


Some of these banks include Sberbank, VTB, Gazprombank and Otkritie. For details see section “Russian Banks as bulk buyers of Russian Gold” in the Russian gold market article in BullionStar’s Gold University.


But its possible that some of this gold ends up not with the Bank of Russia, but with other Russian State entities, one of which is the “Gosfund” or “Precious Metals and Gems fund” operated by “The Gokhran”.


This Gosfund could be buying a portion of Russian gold mining output, stockpiling it, and intermittently releasing some of its stockpile to the Bank of Russia. When I asked the Gokhran last year could it reveal its gold holdings, the Gokhran replied to me that “it does not publish information about the amount of gold reserves in the Russian Gosfund nor any data about its precious metal operations.” See letter reply from Gokhran below (for those who can read Russian):


Gokhran reply January 2016 to query on whether it could publish its Gold Holdings.


Conclusion


Given the high degree of opacity with which both the Russian State and Chinese State accumulate monetary gold, and the fact that they both can probably tap additional gold stockpiles to boost their official gold reserves, it will be interesting to see whether China, through SAFE, announces any increase in the PBoC’s gold holdings between now and the end of Q1 2018.


Because if China does not do so, the Russian Federation will soon have the distinction of being the world’s 5th largest gold holder, pushing China into 6th place. Will China update its gold holdings before the end of 2017, or at least by early 2018? Nothing is certain, but with an ‘official’ difference of only 63 tonnes of gold between them, the race is on.


This article first appeared under the same title, "Neck and Neck: Russian and Chinese Official Gold Reserves" on the BullionStar.com website.