Showing posts with label Metals. Show all posts

Wednesday, March 28, 2018

Now is the time to buy gold, major commodities team suggests

(INTELLIHUB) — A Goldman Sachs commodities team suggests that gold may “outperform” in the coming months amid growing fears of an upcoming stock market bobble.


A man by the name of Eugene King leads a team of Goldman Sachs analysts who believe now is the time to invest in gold.


“Last week, the Federal Reserve approved the widely anticipated quarter-point rate hike to put the new benchmark funds rate at 1.75 percent. Central bankers, led by Jerome Powell in his first meeting as chairman, also hinted the path of rate hikes could be more aggressive,” as CNBC reports.


Historically speaking, when the stock market has fallen from rate hikes gold typically climbs which is what makes the tangible metal such an appealing investment.


“Based on empirical data for the past six tightening cycles, gold has outperformed post rate hikes four times,” one analyst explained.


©2018. INTELLIHUB.COM. All Rights Reserved.

The post Now is the time to buy gold, major commodities team suggests appeared first on Intellihub.

Monday, November 27, 2017

The Effects of Toxic Metals

The Effects of Toxic Metals | sardines | General Health Sleuth Journal Special Interests Toxins


Many ordinary, everyday products have toxic metals in them. Toxic metals are in the foods we eat, water we drink, and the air we breathe. The human body requires extremely trace amounts of a few metals, but too often the concern is with getting too much, rather than too little. Metal poisoning occurs as a result of the unhealthy accumulation of specific metals in the body. Metals become toxic when the quantity is too high and it takes really very little to be too much.


Mercury, lead and cadmium are three metals that can be especially harmful and aluminum has also presented concerns. These toxic metals enter your body through drinking, eating, inhaling, and skin and eye contact. Once in your body, they cause damage at the cellular level by initiating oxidative stress. This damage can contribute to the development of many diseases and health problems.


Mercury Toxins


Mercury is highly toxic to your health and can be found in thermometers, dental fillings, seafood, and more. Mercury can be inhaled or consumed from tainted food. When it enters the body, it is stored in the kidneys, blood, spleen, brain, liver, bones and fatty tissues. Frequently, mercury is a danger to those who work in industrial settings and coal power plants. Vaccine production also involves mercury.


Your body has no use for mercury, exposure at any amount is toxic. Mercury can seriously affect the nervous system and lead to violent muscular spasms and even death. Pregnant and nursing women should also be cautious as mercury can contaminate breast milk.


Mercury Concentration in Commercial Fish


Lowest ConcentrationMedium ConcentrationHighest Concentration

  • Anchovies

  • Butterfish

  • Carp

  • Catfish

  • Clam

  • Cod

  • Crawfish

  • Haddock

  • Herring

  • Mullet

  • Oyster

  • Perch

  • Salmon

  • Sardine

  • Scallop

  • Squid

  • Tilapia

  • Trout

  • Whitefish


  • Bass (Chilean, Saltwater, Black, Striped)

  • Bluefish

  • Sablefish

  • Scorpionfish

  • Buffalofish

  • Grouper

  • Halibut Lobster

  • Marlin

  • Orange Roughy

  • Sea Trout

  • Skate

  • Snapper

  • Tilefish (Atlantic)

  • Tuna


  • King Mackerel

  • Shark

  • Swordfish

  • Tilefish

Aluminum Toxins


Aluminum is ridiculously common; a component of foil, cans and cookware, antacids, nasal spray and processed cheese. When aluminum enters your body, it’s absorbed and can accumulate in the kidneys, brain, lungs, liver and thyroid. Aluminum exposure is common with some occupations like welding and mining. In these industries, vapors may be present and inhalation can result in a “super absorption” status. Aluminum is one of many toxic metals thought to cause brain problems. Alzheimer’s and Parkinson’s have been repeatedly examined for a relation to aluminum accumulation in the brain.


These Products May Contain Aluminum:


  • Antacids

  • Anti-diarrhea Medication

  • Antiperspirants

  • Astringents

  • Baking Powder

  • Buffered Aspirin

  • Cans

  • Cookware

  • Dentures


  • Fireworks

  • Foil

  • Hemorrhoid Medications

  • Lipstick

  • Nasal sprays

  • Processed Cheese

  • Toothpaste

  • Vaccines

  • Vaginal Douches

Lead Toxins


Lead has long been known to be hazardous. Drinking water, old homes, and tobacco smoke are all potential sources of toxic lead exposure. Dust and flakes from lead based paint have caused unbelievable public health nightmares but fortunately regulations have been able to reduce the problem. When lead enters the body, it goes into the bloodstream and starts depositing itself in the body- bones, soft tissue, and the brain. It’s harmful for children and it’s harmful for pregnant women, be extremely cautious of exposure to lead!


Products That May Contain Lead:


  • Antiques

  • Car batteries?

  • Cable coverings

  • Ceramics

  • Cigarettes

  • Crystal


  • Paints

  • Pesticides

  • PVC plastics

  • X-ray shields

  • Toys and products imported from China

Cadmium Toxins


The human body doesn’t need cadmium in any amount and even low levels are toxic. Exposure happens primarily through contaminated foods, however cigarettes and industry are also sources; as are nickel-cadmium batteries, hazardous waste facilities, and fertilizer. Cadmium is slow to exit the body and the negative effects of cadmium are disastrous, affecting the cardiovascular and reproductive systems, kidneys, eyes, and brain.


Foods That May Contain Cadmium:


  • Shelled seeds

  • Organ Meats

  • Cabbage

  • Potato Chips

  • Peanut Butter & Peanuts


  • French fries

  • Cookies

  • Celery

  • Potatoes


How Can I Protect Myself from Toxic Metals?


First, establish where you’re at. Toxic metal tests can be done by many chiropractors or natural healthcare practitioners using hair, blood or urine analysis. A sauna is great for heat therapy, which dissolves toxins in the blood and lets you sweat them out. Find a dentist who has experience and knowledge removing mercury fillings and have your mercury amalgam fillings removed immediately. Be cautious of antiperspirants, cookware and utensils that contain aluminum. Avoid food or drink in aluminum cans. Think twice about vaccinations for things that are no longer common.


Toxic metal poisons are all around us and you need to actively avoid toxic metal exposure. However, total avoidance can be a very tricky proposition- the stuff is everywhere. Detoxifying and cleansing your body is the next step to reducing the toxins that affect your health.


The post The Effects of Toxic Metals appeared first on The Sleuth Journal.

Monday, July 31, 2017

Gold & Silver Ratio could be creating very bullish pattern!

spinning top for kimble charting solutions metals post


Below looks at the Gold Futures/Silver Futures ratio over the past decade. The ratio bottomed in 2011 and started moving higher, sending a bearish message to both Gold & Silver. The ratio has rallied since the 2011 lows, where it could be creating a “topping pattern” over the past couple of years.


chart ratio of Gold futures silver futures kimble charting solutions


CLICK ON CHART TO ENLARGE


The long-term trend in the ratio remains up since 2011, which is hard on metals. Over the past couple of years, the ratio could be forming a head & shoulders topping pattern, with the head taking place at the highs back in 2008. The short-term rally of late, could have completed the right shoulder, of this pattern at (2).


If this would happen to be a topping pattern, what it does at (3) becomes very important for both Gold & Silver bulls. Metals bulls want to see this ratio break support at (3) and head lower. If the ratio would break support, historically Gold, Silver and Miners would attract buyers.


If staying on top of pattern in Gold, Silver, Copper and Miners is of interest to you, we would be honored if you were a Premium or Metals members, as charts like this are shared each week with these members.


from Kimble Charting Solutions.  We strive to produce concise, timely and actionable chart pattern analysis to save people time, improve your decion-making and results


Send us an email if you would like to see sample reports or a trial period to test drive our Premium or Weekly Research


Website: KIMBLECHARTINGSOLUTIONS.COM


Questions: Email services@kimblechartingsolutions.com or call us toll free 877-721-7217 international 714-941-9381

Monday, July 10, 2017

This mining stock much stronger than GDX!

weight lifter for kimble charting solutions Miners post


The past year has been rough for Gold Mining stocks, as Gold Miner ETF (GDX) has declined over 30%, in the chart below. Below compared GDX to Freeport Mcmoran (FCX) over the past year, reflecting a large difference in performance.


fcx vs gdx miners for kimble charting solutions post


CLICK ON CHART TO ENLARGE


Over the past year, GDX has been a good asset to avoid from a buy and hold basis and our members have. The chart below looks at the FCX/GDX ratio over the past 5-years.


FCX/GDX ratio for kimble charting solutions post


CLICK ON CHART TO ENLARGE


Since the start of 2016, the ratio has created a series of higher lows. Rising support was hit of late and turned higher again. The ratio is now attempting a breakout above falling resistance at (1). This move higher continues to reflect that FCX is acting stronger than Gold Miners (GDX).


The Power of the Pattern likes the idea of owning Gold and Copper miners when prices suggest to do so. At this time Premium and Metals members like the pattern FCX is presenting at this time and are long FCX.


This information is coming to you from Kimble Charting Solutions. This is the home of the Power of the Pattern where we provide concise, timely and actionable chart pattern analysis and commentary so in very little time you know the pattern at hand and action to take.   We are honored by your interest in our chart pattern analysis.  


 Send us an email if you would like to see sample reports or a trial period to test drive our Premium or Weekly Research


Website: KIMBLECHARTINGSOLUTIONS.COM


Questions: Email services@kimblechartingsolutions.com or call us toll free 877-721-7217 international 714-941-9381

Thursday, June 8, 2017

Doc Copper; Breakout test in play


Ole Doc Copper hasn’t done too well over the past 6-years, as it has created a series lower highs since 2011. Over the past 18-months, Doc has been attempting to create a series of higher lows in the chart below.


copper futures weekly kimble charting solutions


CLICK ON CHART TO ENLARGE


Copper appears to be creating these short-term higher lows inside of rising channel (1) and (2). Rising support channel (2) is being tested and short-term falling resistance is in play at (3), creating a short-term pennant pattern.


Below looks at Copper over the pat 30-years-


copper futures monthly kimble charting solutions


CLICK ON CHART TO ENLARGE


Copper has spent the majority of the past 30-years, inside of rising channel (1), where support was hit 18-months ago and the series of higher lows got started. It has spent 100% of the past 6-years inside of falling channel (2).


For the past 6-years, Doc Copper has let down the bulls, as it has peaked at falling resistance, as resistance is resistance until broken. To send a positive message to the bulls, it needs to breakout of falling resistance at (3). If it does breakout, I will look to be a buyer. This is where Copper has peaked year after year, will it be different this time?


If you would like to have Power of the Pattern chart analysis sent to you each week, we would be honored if you were a Premium or Metals member.


Website: KIMBLECHARTINGSOLUTIONS.COM


Blog:  KIMBLECHARTINGSOLUTIONS.COM/BLOG


Questions: Email services@kimblechartingsolutions.com or call us toll free 877-721-7217 international 714-941-9381

Tuesday, June 6, 2017

Gold- 6-year bear market ending here?

start button for kimble charting solutions gold ratio post


Is a new bull market in metals about to “Get Started?” Lets look at one indicator that is attempting to send a bullish signal, for the first time in 6-years.


Below looks at the Gold Futures/US Dollar ratio, since 1999 on a weekly basis-


Gold US dollar ratio kimble charting solutions


CLICK ON CHART TO ENLARGE


The Gold/King Dollar ratio broke above resistance in 2001 and a strong breakout took place. For a decade, Gold was much stronger than the US$ at (1). Gold, Silver and miners did very well in this time frame. Once the ratio broke rising support in 2011, the ratio turned lower. This is where the bear market in Gold, Silver and miners started.


Currently the ratio is attempting to do something it hasn’t in the past 6-years, which is a breakout at (2). A break above resistance is the first for the ratio since the highs back in 2011. If the ratio can keep moving higher and clear the highs of last summer, it would send the first longer-term bullish message to the metals space in years.


We would be honored to have you and a Premium or Metals member, if research in the Gold, Silver and Miners is of interest to you.


Website: KIMBLECHARTINGSOLUTIONS.COM


Blog:  KIMBLECHARTINGSOLUTIONS.COM/BLOG


Questions: Email services@kimblechartingsolutions.com or call us toll free 877-721-7217 international 714-941-9381

Friday, April 7, 2017

Gold Bugs breakout, very bullish says Joe Friday


Since the first day after Christmas last year (12/27/16), the metals space has been a great place to be. Below looks at performance of several metals assets compared to the S&P 500 since this date.


Gold Bugs


CLICK ON CHART TO ENLARGE


Premium and Metals members went long this sector by purchasing GDXJ on 12/27/16, due to an upside breakout. Even though the S&P is getting a ton of press about doing well and near all-time highs, its performance since 12/27/16 (Up 3.8%), is lagging the metals space by a large percentage!


Below looks at the Gold Bugs/S&P 500 Ratio-


HUI/SPY ratio


CLICK ON CHART TO ENLARGE


Joe Friday Just The Facts; A upside breakout above pennant pattern resistance at (3), would suggest continued out performance by Gold Miners is in play and should attract buying pressure to mining companies.


Full disclosure; Premium and Metals members own miners at this time.


Not a subscriber to our research products yet?  Email us for discount and trial offers to get started 


Website: KIMBLECHARTINGSOLUTIONS.COM

Tuesday, March 28, 2017

Silver bear market could end here!


Below looks at the performance of Silver, Gold and the S&P 500 year to date. Metals and miners are off to a good start in 2017. Even though the stock market has received a good deal of attention this year, metals have done even better. Is the performance in 2017 the start of something even bigger for Silver & Gold?


silver gold spx comparison


CLICK ON CHART TO ENLARGE


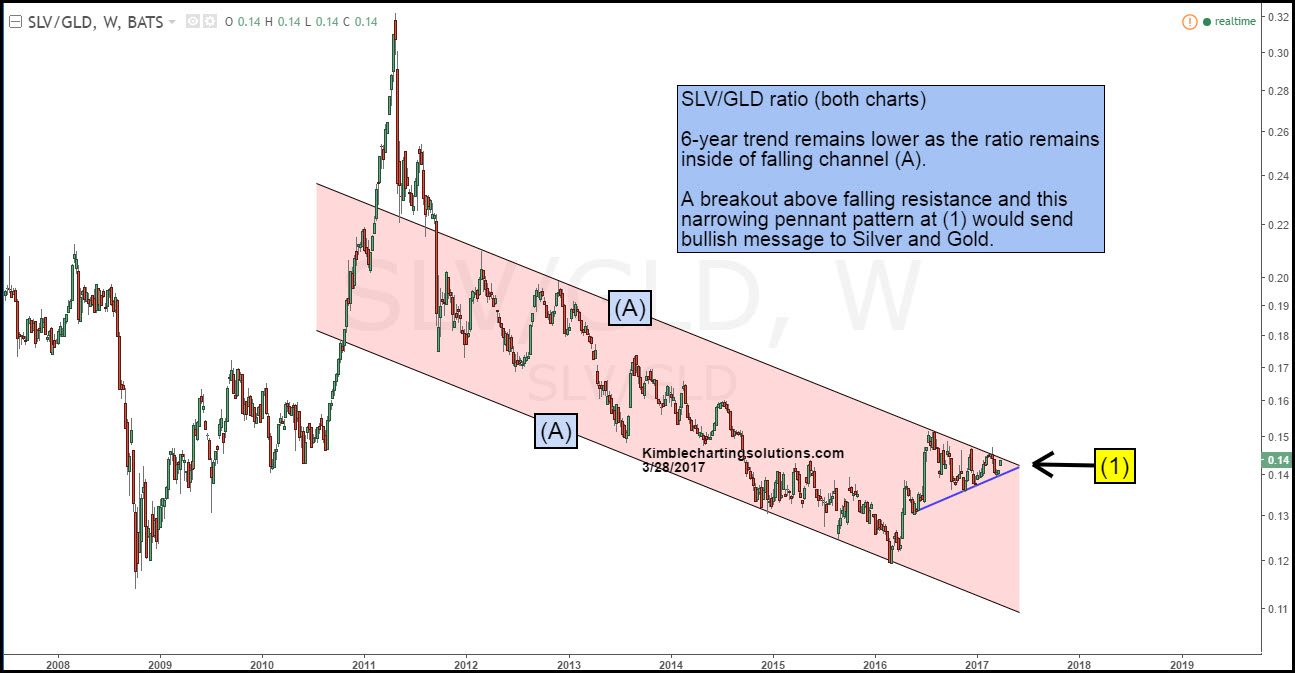
It’s been a long time since buy and holders have experienced a bull market in Silver. How long has it been? Silver has created a series of lower highs since 2011. The trend for Silver remains down and now it is being presented with a chance to break this important down trend.


Below looks at the Silver/Gold ratio over the past 10-years. Last summer the ratio hit the top of falling channel (A) and failed to breakout. When this ratio failed to breakout, Gold, Silver and Miners turned weak.


silver gold ratio


CLICK ON CHART TO ENLARGE


Over the past 9-months, the ratio has created a series of lower high and higher lows, creating a narrowing pennant pattern, that is nearing completion at (1). The end of this pennant pattern is taking place, with the top of the pattern being the top of the 6-year falling channel.


If the bear market is to end for Silver, keep a very close eye on what takes place at (1). Premium & Metals members have played miners to the long side since 12/27/16. Even though Gold & Silver have done well, miners have done even better.


GDX is nearing falling resistance, similar to the ratio above. Members are pulling up stops on our miners positions, as the ratio above is testing one of the most important resistance/breakout tests in years. If the Silver/Gold ratio would do something it has failed to do for 6-years (breakout), it would send a bullish message to Silver, Gold and Miners.


Blog:  KIMBLECHARTINGSOLUTIONS.COM/BLOG


Get our daily research posts delivered to your inbox here


Website: KIMBLECHARTINGSOLUTIONS.COM


Questions: Email services@kimblechartingsolutions.com or call us toll free 877-721-7217 international 714-941-9381

Thursday, March 23, 2017

Gold Bugs; Stellar performance stage set again


From 2001 to 2011, would you have rather owned the S&P 500 or Gold Miners (Gold Bugs Index/HUI)? If you answered the Gold Bugs index, you would be correct. The left chart below compares the performance of the Gold Bugs Index and the S&P 500. From 2001 to 2011, the Gold Bugs index out performed the S&P 500 by 1,400% (left chart below).


Since 2011, miners have been weaker than the S&P 500 by a large percent. Could the stage be for another period where the mining stocks are going to be stronger than the broad markets again?


Gold Bugs


CLICK ON CHART TO ENLARGE


Over the past couple of years, the Gold Bugs/SPY ratio could be forming a reversal pattern (bullish inverse head & shoulders). If the pattern read would happen to be correct (unproven at this time), the ratio needs to breakout at (1). If it does, it would reflect that miners are stronger than the S&P and it could attract buyers to this beat up sector.


Full Disclosure- Premium and Metals members started buying miners on 12/27/16 and sold into a rally. A couple of weeks ago members bought miners again.


Blog:  KIMBLECHARTINGSOLUTIONS.COM/BLOG


Get our daily research posts delivered to your inbox here


Website: KIMBLECHARTINGSOLUTIONS.COM


Questions: Email services@kimblechartingsolutions.com or call us toll free 877-721-7217 international 714-941-9381

Friday, March 3, 2017

Gold Miners; Bearish pattern at falling resistance this week!

The rally in the miners since the first of 2016, has the ratio testing the top of a 6-year rising channel of late.


To be long and strong mining stocks, one wants to see the ratio breakout of the red shaded falling channel.


The past three weeks, the ratio has created reversal patterns (bearish wicks) at falling resistance at (1). So far this week, the ratio is creating a large bearish reversal pattern. This is taking place just below 6-year falling resistance.


If weakness continues in the ratio and it breaks support at (2), it would be sending a risk off message to the mining sector.


Full Disclosure- Premium and Metals members bought GDXJ on 12/27/16 and sold into strength. No position at this time. Will be looking to short miners on a breakdown.


GDXJ/GDX Ratio


CLICK ON CHART TO ENLARGE