Showing posts with label Transition metals. Show all posts

Thursday, November 2, 2017

Nickel Price Surging As Hype Escalates During LME Week

It’s LME Week and there’s cause for celebration in metal markets. European mining stocks rose to a 4-year high as the nickel price surged more than 5% intraday to a two-year high and rose by the daily limit in Shanghai trading today. Metals used in electronic vehicles, like lithium, cobalt, copper and nickel, are hot right now and a focal point of discussion at the LME gatherings. As Metal Bulletin noted, the 2017 event has seen record attendance.


The annual LME Dinner week kicked off in a positive note, with record numbers gathering for the exchange’s keynote metals seminar on Monday October 30. “We have over 900 people over the day here…which is a record attendance,” London Metal Exchange chief executive officer (CEO) Matthew Chamberlain said.


Despite relatively high inventories, big miners and metal traders are becoming increasingly bullish on nickel’s prospects. According to Bloomberg...


Glencore Plc and Trafigura Group Pte are often at loggerheads, but one thing they agree on: the nickel market will be transformed by the rise of electric cars. Nickel sulphate, a key ingredient in lithium-ion batteries, will see demand increase 50 percent to 3 million metric tons by 2030, Saad Rahim, chief economist at Trafigura, said in an interview. While other battery metals like cobalt and lithium have more than doubled since the start of last year, nickel prices have been subdued because of large inventories.


"When you look structurally, we should start to get bullish now,” Rahim said.


“Are you going to be able to meet that demand when the time comes, given underinvestment in the supply side?”


Glencore, which was devastated by the downturn in nickel, is also optimistic, as are some of the analysts, as Bloomberg notes...


(Glencore) told analysts recently that nickel production would need to increase 1.2 million tons by 2030, equal to more than half of current global output, to keep up with demand from the battery industry. Prices are currently more than double what it costs Glencore to mine the metal. It’s a surprising mood change for a market with a disastrous reputation. Nickel was long a thorn for Glencore, which was saddled with unprofitable operations following its takeover of Xstrata. It sold an Australian nickel mine, which Xstrata bought in 2007 for $2.4 billion, for just $19 million in 2015.


“The nickel industry’s been a bit of a dog since about 2007,” Oliver Ramsbottom, a partner at McKinsey & Co. in Tokyo, said by phone.


The battery industry could revive the fortunes of miners more than a decade after nickel collapsed from a peak of $51,600 a ton in 2007


Despite the hype, Bloomberg cautions that there are still naysayers highlighting elevated inventories and the potential for supply to ramp-up faster than currently expected.


Still, some analysts are skeptical that the bullish scenarios will play out. Electric cars are still a niche industry and nickel oversupply remains a threat, with current stockpiles four times bigger than since the start of 2012.


Indonesia has authorized its largest producer to export more nickel ore. The Philippines has also discussed ending a ban on open-pit mining, raising concerns that supply will spike.


“For years, the market has completely dismissed the idea that something positive could happen in nickel,” Ingrid Sternby, senior research analyst at Blenheim Capital Management LLP, said in an interview in London. “With the recent announcements about Indonesia and the Philippines, it’s easy to see why the market is still scary enough for people not to want to be involved…


“You can see the tightness ahead in the nickel market, but my concern is that we’re going to see a lot of value destroyed along the way,” said Colin Hamilton, managing director for commodities research at BMO Capital Markets Ltd.


“If the miners really believe in the EV growth story, the thing to do would be to keep the nickel in the ground until the deficit arrives.”


When assessing the prospects for nickel, it is really two separate markets, nickel alloyed with iron and nickel sulphate used in batteries. Bloomberg expects the latter to progressively trade at a premium to the former.


About half of global nickel production is in the form of ferronickel or nickel pig iron, which is nickel alloyed with iron, making it suitable for stainless steel. Battery makers, instead, use nickel sulphate, produced by dissolving pure nickel metal in sulphuric acid. One hope is that the pricing of nickel pig iron and the high-grade nickel sulphate will diverge in the coming years, improving the fortunes of miners that can produce battery-quality material.


The global nickel market is heading for a deficit once above-ground stockpiles of battery-grade metal are consumed, according to Wood Mackenzie. The question for miners is how quickly the premium for top-quality nickel will emerge.


The nickel alloy versus nickel sulphate certainly adds complexity to analysing nickel. However, while the fundamentals for the latter seem very positive, it makes us slightly nervous when record numbers of participants gather at industry jamborees.


Still, politicians and automakers are increasingly counting on a future of electric cars, attracting traders such as Trafigura.


“Will we see a real breakout in next 12 months? That’s hard to see, but beyond that, structurally this looks to be going up,” Rahim said.


Wednesday, November 1, 2017

Doc Copper/Gold ratio breaking 10-year support


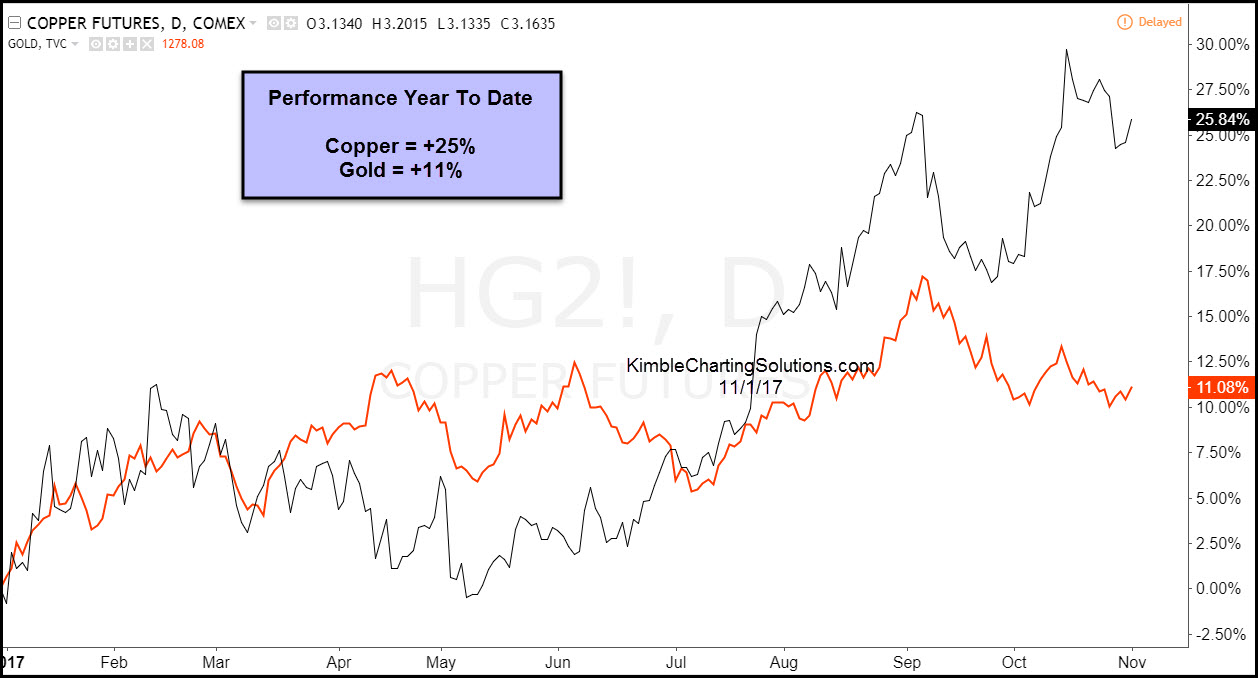
Doc Copper and Gold have both done well this year. Doc Copper has been the stronger of the two, reflected in the chart below-


CLICK ON CHART TO ENLARGE


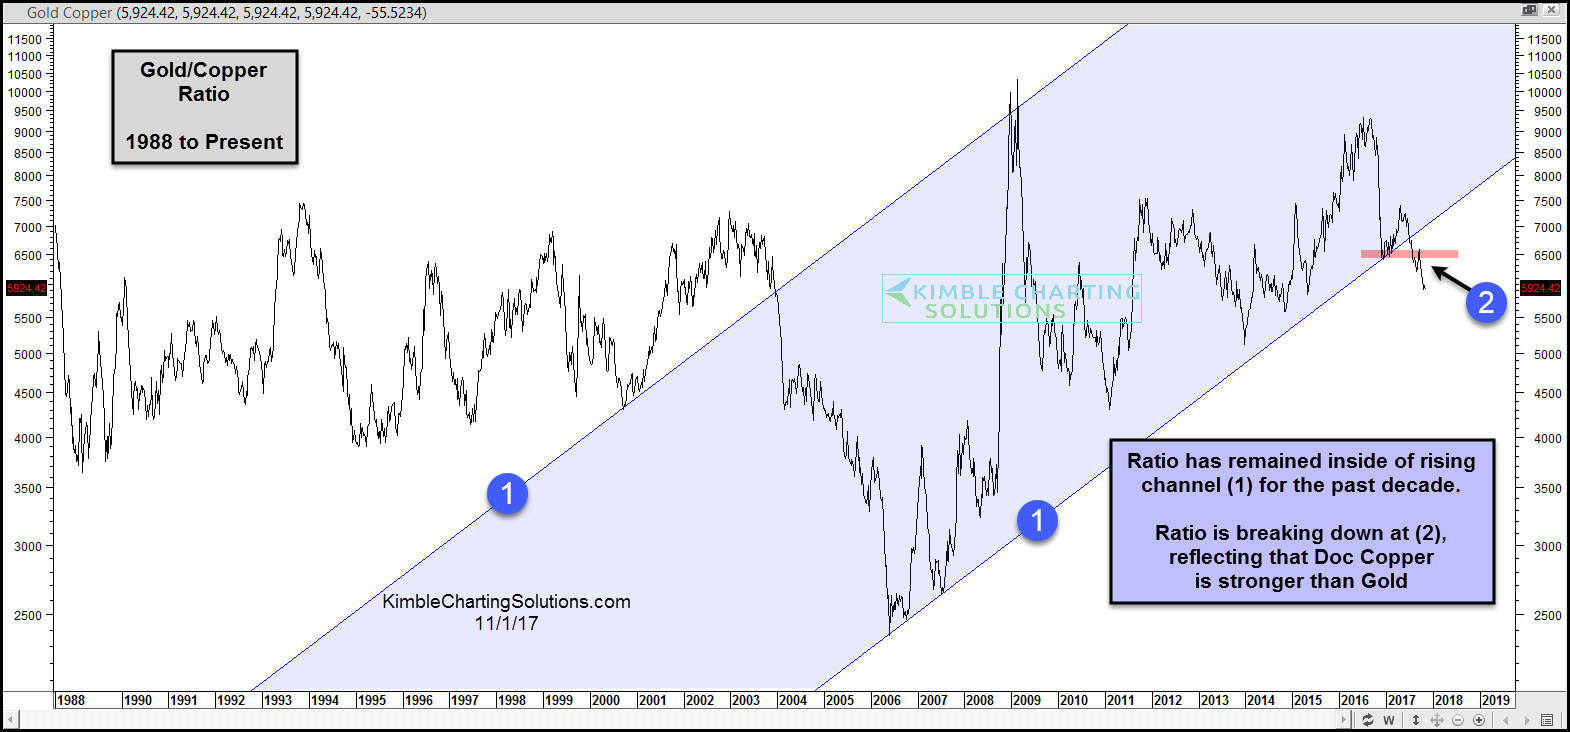
The strength in Doc Copper has the Copper/Gold ratio below doing something it hasn’t done in a long time!


CLICK ON CHART TO ENLARGE


The Doc Copper/Gold ratio has remained inside of rising channel (1) for the past decade. The ratio of late is now breaking below 10-year rising support at (2).


When attempting to decide on what metals to own, this break of 10-year rising support could be sending a very important message to the metals market and could be sending an important macro message as well.


Why you see chart pattern analysis with brief commentary:   There is a ton of news and opinions around markets and assets that make the decision-making process more difficult than it needs to be.   I believe the Power of the chart Pattern provides all you need to see what is taking place in an asset and determine the action to take.  This approach has worked well for me and our clients and I encourage you to test it for yourself.


Receive my free research posted on the blog daily here 


Or,  send an email if you would like to see sample research and take me up on a trial of my premium or weekly research where I provide actionable alerts on breakouts and reversals in broad market indices, sectors, commodities, the miners and select individual stocks 


Email services@kimblechartingsolutions.com  


Call us Toll free 877-721-7217 international 714-941-9381 


Website: KIMBLECHARTINGSOLUTIONS.COM 


Wednesday, August 16, 2017

Doc Copper breaking out again, gains are piling up!

wrists breaking out rope ties chris kimble post


Ole Doc Copper has struggled since 2011, as it created a series of lower highs. Over the past 90-days, Doc Copper has experienced some impressive upside action.


Below looks at Doc Copper Futures over the past 4-years-


Copper futures weekly


CLICK ON CHART TO ENLARGE


Doc Copper created a series of lower highs below line (1) over the past few years. Earlier this year it hit falling resistance again and backed off. Over the past 6-weeks, Copper has witnessed some bullish price action it hasn’t in the past few years, which is breaking above falling highs.


A few weeks ago Copper broke above falling resistance (1) and highs earlier this year at (2). The rally of late now has it testing 2015 highs at (3). A breakout above (3) would send a bullish breakout message to Copper, with the next key horizontal resistance coming into play at the $3.25 level, which was 2014 highs.


How are members playing Doc Copper strength? Buy owning Freeport McMoran (FCX). A position was taken in FCX, by Premium, Metals and Sectors members 90- days ago.


performance comparison FCX, copper, spy chris kimble post


CLICK ON CHART TO ENLARGE


Doc Copper weakness over the past few years seemed to have little impact on the broad market. Will Doc Copper’s strength over the past few months and breaking above multi-year falling resistance, have a positive impact on the broad market and suggest that some economic strength is around the corner? In our humble opinion it is too early to tell. The Power of the Pattern did share that an opportunity was in play to make some decent Pocket Change 90-days ago and so far that message has not changed. as gains continue to pile up.


from Kimble Charting Solutions.  We strive to produce concise, timely and actionable chart pattern analysis to save people time, improve your decision-making and results


Send us an email if you would like to see sample reports or a trial period to test drive our Premium or Weekly Research


Website: KIMBLECHARTINGSOLUTIONS.COM


Questions: Email services@kimblechartingsolutions.com or call us toll free 877-721-7217 international 714-941-9381

Friday, July 14, 2017

Gold & Silver; 16-year bull market support test in play, says Joe Friday

Gold & Silver; 16-year bull market support test in play, says Joe Friday kimble charting solutions


Below compares the performance of Gold, Silver and the S&P 500 since July of 2001. Why compare the performance of the three starting in 2001? This is when Gold & Silver created a series of higher lows, starting a new bull market that lasted the following decade. From 2001 until 2011, Gold & Silver both outperformed the S&P 500 by more than 500% each! 


chart comparing Gold silver and S&P 500 kimble charting solutions


CLICK ON CHART TO ENLARGE


No doubt it paid to own Gold & Silver over the S&P 500 from 2001 to 2011. As we all know at this time, the performance between the three has done the exact opposite over the past 6-years, as it has paid to own the S&P and avoid Gold & Silver.  Is in now time to consider that Gold & Silver could be ending the 6-year bear market in metals?


Below looks at only Gold & Silver since the late 1990’s and why the price point in Gold & Silver are testing what could be historically important levels.


monthly chart of gold and silver, kimble charting solutions


CLICK ON CHART TO ENLARGE


The above chart reflects that Gold & Silver on a monthly basis are both testing 16-year rising support at this time. Despite Gold & Silver being lower over the past 6-years, this reflects that both are in long-term rising trends, where support is being tested.


Joe Friday Just The Facts; Support is Support until broken and both are testing long-term support at this time. What both do at this support test should send very important long-term messages about the metals space and will lead to wonderful opportunities.


If you would like to receive Power of the Pattern charts in the metals sector, you can receive them by being a Premiumor Metals member.


This information is coming to you from Kimble Charting Solutions.  We strive to produce concise, timely and actionable chart pattern analysis to save people time, improve your decion-making and results


Send us an email if you would like to see sample reports or a trial period to test drive our Premium or Weekly Research


Website: KIMBLECHARTINGSOLUTIONS.COM


Questions: Email services@kimblechartingsolutions.com or call us toll free 877-721-7217 international 714-941-9381

Tuesday, June 6, 2017

Gold- 6-year bear market ending here?

start button for kimble charting solutions gold ratio post


Is a new bull market in metals about to “Get Started?” Lets look at one indicator that is attempting to send a bullish signal, for the first time in 6-years.


Below looks at the Gold Futures/US Dollar ratio, since 1999 on a weekly basis-


Gold US dollar ratio kimble charting solutions


CLICK ON CHART TO ENLARGE


The Gold/King Dollar ratio broke above resistance in 2001 and a strong breakout took place. For a decade, Gold was much stronger than the US$ at (1). Gold, Silver and miners did very well in this time frame. Once the ratio broke rising support in 2011, the ratio turned lower. This is where the bear market in Gold, Silver and miners started.


Currently the ratio is attempting to do something it hasn’t in the past 6-years, which is a breakout at (2). A break above resistance is the first for the ratio since the highs back in 2011. If the ratio can keep moving higher and clear the highs of last summer, it would send the first longer-term bullish message to the metals space in years.


We would be honored to have you and a Premium or Metals member, if research in the Gold, Silver and Miners is of interest to you.


Website: KIMBLECHARTINGSOLUTIONS.COM


Blog:  KIMBLECHARTINGSOLUTIONS.COM/BLOG


Questions: Email services@kimblechartingsolutions.com or call us toll free 877-721-7217 international 714-941-9381

Monday, April 10, 2017

Mea Culpa, Report 9 April, 2017

Dear Readers,


I owe you an apology. I made a mistake. I am writing this letter in the first person, because I made the mistake.


Let me explain what happened. I wrote software to calculate the gold basis and cobasis (and of course silver too). The app does not just calculate the near contract. It calculates the basis for many contracts out in the distance, so I can see the whole picture. I developed a model for the fundamental price, based on the basis. My software calculates this, too (spoiler alert: the reported fundamental prices were high).


I have long since debugged it. It works reliably. So reliably, that every day I pored over the results, but I no longer checked the inputs and intermediate steps of the calculation. Now, in retrospect, I realize that I should have.


The root cause is simple. For as far back as I have ever seen, the symbol for a future has been a two-letter code for the commodity + a one letter for the month and one digit for the year. For example, gold is GC. December is Z. And 2017 is 7. So the December gold contract is “GC Z7”. Silver is SI, so December silver is “SI Z7”.


I did not expect my realtime quote provider to change year codes for contracts in 2018 and beyond. No longer is it one digit for year—8 in this case. Now it requires two digits. So the December 2018 gold contract is “GC Z18”. Even now that I have looked, I do not find any announcement of this change. I am not even sure it is an official COMEX change, or just a quirk of one quote provider.


This error was compounded because my software was not programmed to notify me of a problem. In software, the only thing worse than a failure in a system that is used in production is a silent failure that goes unnoticed, and hence goes uncorrected. This failure was unnoticed.


Before I get to the impact, I want to discuss how we will make sure this does not happen again.


My team and I have been working hard on a new website, and the centerpiece will be our ongoing data science work in the precious metals markets. We will publish about 45 graphs, with daily updates. Obviously, this is driven by a much more sophisticated software system than my humble application.


The new software is developed by one of the best coders in the world (not me, I’m rusty after not coding full-time in almost 15 years). Rudy Mathieu worked for my last company, a software company called DiamondWare.


Rudy has built a hardened, enterprise-grade software system (now undergoing extensive testing), and when it encounters an error, it does not fail silently. It is constantly checking the status of all key components, and has a dashboard so we can monitor how the software and the server running it are doing. It emails us if anything goes wrong. It will instantly detect problems, such as a change in the year code or even the Spanish Inquisition, which nobody expects (sorry, just a bit of humor).


For years, I have been publishing a unique view into the markets. Our new site takes it a thousand times further. I expect that it will become an essential tool for anyone who uses or trades gold. We need to ensure it is as reliable as clockwork.


I promise to make it so.


Back to the question: what was the net effect? My software was not able to calculate a basis for gold or silver contracts maturing in 2018 or beyond. However, my fundamental price model relies on them. Its accuracy began to suffer starting around last August. This error continued to grow in magnitude. As of last week’s Report, the fundamental price of gold was overstated by about $175, and silver’s fundamental by $2.30.


The correct fundamental prices as of Friday March 31 were about $1,260 and $16.70.


Interestingly—and this is important—the gold-silver ratio fundamental was robust to this error. The value stated in last week’s report, 75.75, was almost perfect. It was off from the revised estimated fundamentals by 0.2. I say revised and estimated, because I went back over the time period where I have incomplete data and derived what I need. The result is good enough for horeshoes and hand grenades, as we say in America (but it has higher uncertainty).


There is a bigger lesson here. Monetary Metals focuses on the ratio (which we trade in our fund), because it is less error-prone, more accurate, and less risky than trading either metal against the dollar.


OK… The bottom line is that on March 31, the corrected gold fundamental was above the market price, though not nearly so far above as I had reported it. It was about 1.4% over the market price (I reported 15.6% last week).


As an aside, my friend Pater Tenebrarum at Acting Man blog wrote about the disparity between the fundamental drivers that he monitors, and the fundamentals I reported. He is right in thinking that demand for physical is not going ballistic yet.


Though as you will see in the graphs below, the fundamental price has indeed been rising since mid to late December (as I have been correctly reporting), from a low of around $1,115 to $1261 at the end of March.


The correct silver fundamental price is below the market price. My commentary actually stands up pretty well, in light of the correct data. Even while I erroneously reported a silver fundamental running up to about $19, I have not been enthusiastic about silver. I haven’t “trusted” it enough to encourage a big silver trade, nor called for a major price move. I think there were two reasons.


One, obviously, the nearer-term contracts which I monitor are accurate. They did not show the kind of moves I would expect to see if the market for physical metal was getting so tight. The error only occurred for contracts in 2018. Two, the fundamental gold-silver ratio was correctly calling for a higher market ratio.


Below, I include graphs of the fundamental prices for both metals. The correct values will be overlaid with the ones I have been calculating. So you can see where it went off the rails, and by how far it deviated.


There is one last thing, which I am reluctant to discuss now, before we are ready to launch. Yet it is germane.


Monetary Metals has licensed market data from Thomson Reuters. When the new charts go live, they will be based solely on this data. This data is of better quality than the data from the realtime quote provider I have been using. And we have developed some very sophisticated algorithms that allows us to extract the maximum signal with the least noise, far superior to what my little app does with the data from my current provider.


The new basis and fundamental prices will not line up perfectly with the old data series. One reason is that the bid-ask spread is tighter. By the nature of the math to calculate the basis, tighter spread means a higher basis and higher cobasis.


That said, I am confident of two things. One, the new data is more accurate. And two, the old data set has served well in showing the big picture (notwithstanding the error I corrected this week).


We will look at the only true picture of supply and demand in the gold and silver markets. But first, the price and ratio charts.


The Prices of Gold and Silver


Next, this is a graph of the gold price measured in silver, otherwise known as the gold to silver ratio. Last week, we asked if the downward-moving gold-silver ratio had hit a line of support. It seems it did, as it moved up sharply on Friday.


The Ratio of the Gold Price to the Silver Price


For each metal, we will look at a graph of the basis and cobasis overlaid with the price of the dollar in terms of the respective metal. It will make it easier to provide brief commentary. The dollar will be represented in green, the basis in blue and cobasis in red.


Here is the gold graph.


The Gold Basis and Cobasis and the Dollar Price


Not much change in the scarcity of gold (i.e. the red line, the cobasis) while the price moved up slightly. Our calculated fundamental price is up $30, to about $1,290.


Let’s take a look at two graphs. Both show enough time to see where the error began to creep in, and where it ends. They are May 3, 2016 through March 31, 2017.


The first is the continuous gold basis, with the erroneous line overlaid with the corrected. As you can see, the erroneous basis was lower (indicating, falsely, lower abundance) and the erroneous cobasis was higher (indicated higher scarcity).


The Reported and Corrected Gold Basis and Cobasis


The second is the market price of gold, overlaid with the erroneous and corrected fundamental prices.


The Reported and Corrected Gold Fundamental Prices


The erroneous one takes off for the stars. The corrected value is much closer to the market price, though a bit above.


Now let’s look at silver.


The Silver Basis and Cobasis and the Dollar Price


We switched from the May to the July contract, as the May contract is in the process of being rolled (where traders must close positions in May and if they want to keep their positions, open a July or farther-out contract).


There is a small decrease in the basis and increase in cobasis, along with a falling price this week. And our fundamental price is up 14 cents, to just under $16.85. Yes, alas, that is more than a buck under the market.


Here are the same extra two graphs for silver.


The Reported and Corrected Silver Basis and Cobasis


The Reported and Corrected Silver Fundamental Prices


You can see here that there are two salient features. One, the fundamental has been rising for about a month longer than gold, though from a much more volatile bottom ($12.39). Two, the fundamental is way below the market price.


© 2017 Monetary Metals

Thursday, March 9, 2017

Precious Metals Pounded Into European Close - Break Below Key Technical Levels

Precious metals are being pounded once again this morning as we head into the European close.


Gold has broken below the 50-day moving average and the key "maginot" line of $1200 - lowest since January. Silver, similarly, has broken below its key technical levels and is testing the $17 level.


For now they are findiong some support at these key levels...


As USDJPY fades


Notably Gold is once again outperforming Silver (back above 70x) with 68x seemingly support for this ratio...


Monday, February 27, 2017

Curious Gold-Silver Ratio That Did Not Fall, Report 26 Feb, 2017

This holiday-shortened week (Monday was President’s Day in the US), the price of the dollar fell. In gold, it fell almost half a milligram to 24.75mg, and prices in silver it dropped 30mg, to 1.7 grams of the white monetary metal. Flipped upside down, gold went up 23 notes from the Federal Reserve, and silver appears to go up by 41 cents.


Below, we will show the only true picture of the gold and silver supply and demand fundamentals. But first, the price and ratio charts.


The Prices of Gold and Silver


Next, this is a graph of the gold price measured in silver, otherwise known as the gold to silver ratio. It moved sideways again this week, which would normally be odd for a time when the prices of the metals are rising.


The Ratio of the Gold Price to the Silver Price


For each metal, we will look at a graph of the basis and cobasis overlaid with the price of the dollar in terms of the respective metal. It will make it easier to provide brief commentary. The dollar will be represented in green, the basis in blue and cobasis in red.


Here is the gold graph.


The Gold Basis and Cobasis and the Dollar Price


For a very long time, we would post graphs that looked almost the same. Oh, the specifics of month, price, and basis would be different. But they had a certain sameness. The price of the dollar (i.e. inverse of the price of gold, in dollar terms) would move along with the cobasis (i.e. scarcity of gold). So as the dollar would rise (i.e. the price of gold would fall), the scarcity would rise. And vice versa. This means changes in price were due to changes in behavior by speculators.


And now we have a clear picture of … the opposite. The dollar has been falling since mid-December. And for that same time, the cobasis (scarcity of gold) has been rising.


Yes, gold has been getting scarcer as it becomes pricier.


How could this be possible? Doesn’t the law of supply and demand work for gold? You know, the standard “X” graph from Econ. 101?


Gold has several unique properties. One is that it is not purchased for consumption, but for monetary reserves or jewelry (which in most of the world is monetary reserves). Contrast that to copper which is purchased by plumbing manufacturers to make pipe. It’s a competitive market, and if the price of copper plumbing goes up too much then home builders will switch to plastic. Demand drops as price rises. Also, the marginal copper mine will increase production. Supply rises as price rises. It is self-correcting.


Gold, not being bought to consume, does not have a limit to demand as price rises. If anything a rising price (i.e. a falling currency) signals to people that holding gold is a good thing. They were wise to get out of their falling paper currency, and should consider buying more gold.


Also, virtually all of the gold ever mined in human history is still in human hands. All of this gold is potential supply, at the right price and under the right conditions. Even if gold mining worked like copper mining, and miners could just produce more, changes in mine production at the margin are not material to the overall gold supply. By official estimates, the total inventory of gold would take over 70 years to be produced at current mine production rates (and we believe this is a low estimate).


Readers may object that this question is a bit unfair, as any commodity can experience rising tightness and that will accompany its rising price for a while until the market can correct itself. That is true, but what we are looking at in gold is not that at all. When the market corrects itself—which we think is very likely, we do not see Armageddon just yet—it will not be because gold miners have cranked up their outputs, nor because gold users have substituted another metal. There is no substitute for monetary reservation, particularly as paper currencies are in the terminal stages of failure.


Our calculated fundamental price is now up to almost $1,400.


Now let’s look at silver.


The Silver Basis and Cobasis and the Dollar Price


The trend of falling dollar (i.e. rising price of silver) and rising cobasis (scarcity) is here in silver, too, but it’s weaker.


Silver does not quite have the same stocks to flows ratio as gold, but it has far and away a higher ratio than copper or any ordinary commodity. That is why silver is the other monetary metal.


The fundamental price of silver is now up to about $18.70. While this is over the market price of the metal, it’s not nearly so much above as gold.


This is why we calculate a fundamental on the gold-silver ratio over 74.


© 2017 Monetary Metals

Tuesday, February 21, 2017

Don’t Short This Dog, Report 20 Feb, 2017

This week, the prices of the metals mostly moved sideways. There was a rise on Thursday but it corrected back to basically unchanged on Friday.


This will again be a brief Report, as yesterday was a holiday in the US.


Below, we will show the only true picture of the gold and silver supply and demand fundamentals. But first, the price and ratio charts.


The Prices of Gold and Silver


Next, this is a graph of the gold price measured in silver, otherwise known as the gold to silver ratio. It moved sideways this week.


The Ratio of the Gold Price to the Silver Price


For each metal, we will look at a graph of the basis and cobasis overlaid with the price of the dollar in terms of the respective metal. It will make it easier to provide brief commentary. The dollar will be represented in green, the basis in blue and cobasis in red.


Here is the gold graph.


The Gold Basis and Cobasis and the Dollar Price


The price was unchanged, but the basis is up slightly and cobasis is down (i.e. gold became slightly more abundant). This is not the news dollar shorters (i.e. those betting on the gold price) want to see.


Our calculated fundamental price is all but unchanged around $1,360.


Now let’s look at silver.


The Silver Basis and Cobasis and the Dollar Price


In silver, the basis is basically unchanged but the cobasis went up a bit. The silver market got just a bit tighter, and our calculated fundamental price is up more than 30 cents to about a quarter above the market price. Not exactly “bet the farm with leverage territory”, but definitely not “short this dog” either.


Watch this space. We have some exciting data science to reveal soon.


© 2016 Monetary Metals