Showing posts with label Auto Sales. Show all posts

Thursday, December 14, 2017

Stockman Slams "Bubble Finance And The Era of No-See-Um Recessions"

Authored by David Stockman via Contra Corner blog,


Today"s single most dangerous Wall Street meme is that there is no risk of a stock market crash because there is no recession in sight. But that proposition is dead wrong because it"s a relic of your grandfather"s economy. That is, a reasonably functioning capitalist order in which the stock market priced-out company earnings and the underlying macroeconomic substrate from which they arose.


Back then, Economy drove Finance: You therefore needed a main street contraction to trigger tumbling profits, which, in turn, caused Wall Street to mark-down the NPV (net present value) of future company earnings streams and the stock prices which embodied them.


No longer. After three decades of monetary central planning and heavy-handed falsification of financial asset prices, causation has been reversed.


Finance now drives Economy: Recessions happen when central bank fostered financial bubbles reach an asymptotic peak and then crash under their own weight, triggering desperate restructuring actions in the corporate C-suites designed to prop up stock prices and preserve the collapsing value of executive stock options.


Accordingly, you can"t see a recession coming on Janet Yellen"s dashboard of 19 labor market indicators or any of the other "incoming" macroeconomic data---industrial production, retail sales, housing starts, business investment---- so assiduously tracked by Wall Street economists.


Instead, recessions gestate in the Wall Street gambling parlors and become latent in carry trades, yield curve and credit arbitrages and momentum driven excesses. Eventually, these latencies---central bank fostered bubbles-----erupt suddenly and violently. So doing, they spew intense, unexpected contractionary impulses into the main street economy via the transmission channel of C-suite "restructuring" actions.


Within weeks of a bubble implosion, therefore, a No-See-Um Recession is born and goes rampaging across the economic landscape. But it comes as a shock to economists and especially the Keynesian apparatchiks at the Fed because they are focused on the macroeconomic externals rather than the coiled spring internals of the financial markets.


In this context, it can be said that the Great Recession was the first major business cycle contraction that reflected the new regime of central bank driven Bubble Finance.


What happened was that a garden-variety macroeconomic slowdown which incepted in 2007 went rogue when it was monkey-hammered by the Lehman bankruptcy and the related crash of fundamentally insolvent Wall Street gambling houses thereafter.


This is evident in much of the macroeconomic data, but the snapshot of retail sales below aptly illustrates the case.


From July 2006 through August 2008 (the ninth orange bar in the shaded area) the US economy oscillated along a flatline of weak and inconsistent retail sales growth. Although in its wisdom the NBER dated the recession as incepting in December 2007, the retail sales pattern during the first nine months of the downturn was not appreciably different than during the 17 months just prior.


But in September 2008 retail sales went into free fall----coterminous with the Wall Street meltdown and the desperate Washington interventions via the massive Fed liquidity injections and the TARP bailout.  During that month, retail sales plunged at a 21% annualized rate-----followed by 50% annualized rates of collapse in November and December and nearly a 30% rate of shrinkage in January 2009.


As demonstrated more fully below, those four months were ground zero of the Great Recession. They constituted a macroeconomic air pocket ignited by panic on Wall Street and in the corporate C-suites---exacerbated by the frenzied sky-is-falling machinations of Treasury Secretary Paulson and Ben Bernanke.


Stated differently, the violently collapsing Greenspan mortgage, credit and Wall Street gambling bubbles triggered four to eight months of macroeconomic freefall that no one saw coming. As late as July, the Fed minutes denied that a significant downturn was even likely in 2008, while the Wall Street stock peddlers were insisting that the goldilocks economy was alive and well.


The clueless Keynesian monetary central planners in the Eccles Building had thus fostered the first big No-See-Um Recession, but remained ignorant as to why it suddenly happened; and, consequently, doubled down on Bubble Finance policies that were destined to generate a future replay of the same.


Needless to say, that"s where we are now. The Wall Street casino has again become a coiled spring of excesses, deformations and unsustainabilities---that is, recession latencies waiting to burst.


For instance, there is no other way to describe current razor thin credit spreads in the junk and investment grade sectors alike. Central bank financial repression has fostered a relentless scramble for yield among fund managers that has caused the high yield spread to contract by more than 700 basis points from its post-recession high.


Likewise, the investment grade BBB spread at 1.32% now stands at just 29% of its June 2009 level. And since then the massive explosion of investment grade corporate debt has been concentrated in the BBB tranche of the bond market (one notch above junk), where it now comprises 50% of outstandings compared to just 25% a decade ago.


Needless to say, cheap high yield and BBB debt has had but a single major application since the post-recession recovery of the corporate bond market. To wit, it has funded trillions of financial engineering deals in the form of LBOs and levered recaps in the junk sector and massive stock purchases and dividends in the BBB sector.


So doing, these Fed-fueled financial engineering flows back into the casino have functioned to shrink the stock float and balloon the supply of speculative capital on Wall Street. At length, stock bubbles get aggravated and recession latencies intensified.


When the bond bubble finally implodes, of course, the overwhelmingly largest stock purchaser of the present bubble cycle---LBO shops and financial engineering addicted C-suites---will be forced to the sidelines. The coiled spring of financial engineering will thereupon unwind violently, triggering the next No-See-Um Recession.


And it will be self-reinforcing in a manner that is obvious, but to which the nation"s monetary central planners remain completely oblivious. That is, they continue to pronounce the "all clear" on financial instabilities and signs of incipient financial bubbles based on the alleged improved condition of bank balance sheets---especially the dozen largest mega-banks which account for 80% of deposits.


But the coiled spring this time is not in the mega-banks, but in the trillions of fixed income and high yield mutual funds and ETFs which have arisen to absorb the massive flow of corporate debt. And their liabilities are the ultimate "demand deposit", callable by investors on a moments notice and at the hint of a financial crash.


Nor is the $6.1 trillion corporate bond sector---double the $3.3 trillion outstanding in late 2007----the only coiled spring of recession latency lurking on Wall Street. The massive expansion of the ETF market since 2007 is probably even more potent as a bubble crash accelerant and therefore ignition channel for the coming No-See-Um Recession.


Outstandings have increased by 10X in the last decade and at more than $5 trillion are 3.3X the level  extant on the eve of the financial crisis. Yet in the context of a dramatic market break---whether triggered by a black, orange or red swan---they  will function as pure downside accelerants as fund managers are forced to dump their holdings in order to buy-in and liquidate the torrent of ETF shares which will be on offer.


Image result for images of the size of the ETF market


Then, too, the violent break in September 2008 occurred long before the massive "short vol" play of the present moment had metastasized in the trading pits. Yet today an estimated $1 trillion is invested in risk parity funds, double and triple inverse VIX ETFs and a menagerie of bespoke vol shorts concocted by Wall Street for its hedge fund customers.


Indeed, the current massive short vol trade is the ultimate coiled spring that will aggravate and accelerate the next bubble collapse, and thereby function as the mother of all recession latencies. Yet we are quite certain that our bubble blowing monetary central planners have given no consideration at all to this ticking time-bomb---even as they gum endlessly over the meaning of hairline noise in the BLS" latest (and useless) JOLTS report.


In this context, we do not profess to know the catalyst for the next bubble implosion, but we can readily identify the speed with which the post-Lehman collapse occurred in the stock market, and the manner in which that triggered massive restructuring actions, inventory liquidations and sweeping job cuts by the corporate C-suites.


What we do know, however, is that the financial market internals and their coiled springs of recession latencies are far more widespread and combustible than last time around. So it is worth specifying in more granular detail the recession transmission channel that operated through the corporate C-suites during the on-set of the Great Recession. The fall-winter dislocation of 2008-2009, in fact, is a roadmap for what comes next.


The S&P chart below is indexed to 100 as of September 1, 2008 and represents the eve of the Wall Street meltdown. By October 10, the S&P index was down 30% and by November 20 it closed at 58.7% of its September 1 level.


So in roughly 50 trading days the broad market lost 41% of its capitalization.


Again, that was the heart of the bubble implosion. Thereafter the market gyrated along the flatline until it hit a one-day capitulation low on March 9 at a 47% loss. So fully 90% of the capitulation low occurred during the first 50 days, and it was the speed and violence of this bubble collapse that triggered what amounted to mayhem in the C-suites.


Needless to say, the response of the corporate C-suites was swift and violent. The Challenger survey of monthly corporate layoff announcements accordingly surged during the 4-6 months that the stock market was establishing a bottom 50% below the November 2007 bubble peak.


But as will be further documented below from the BLS payroll employment data, this spree of excess payroll liquidations occurred in a very concentrated pulse and then reverted to low order clean-up until hiring growth resumed about a year after the stock market crash.


Image result for challenger monthly layoff announcement in 20o7-2009


Another measure of C-suite liquidation activity is represented by corporate restructuring charges. The latter not only capture severance expense associated with job terminations but also plant and store closures, charge-offs for bad debts and excess/obsolete inventories and numerous other categories of asset write-downs.


But it all shows up on the true bottom line---GAAP net income---which plunged to negative $15 per S&P 500 share in Q4 2008.


As shown below, that represented a negative $34 per share swing from the level of Q4 2007 and more than a 40% drop from Q4 2006. Still, the housecleaning was relatively short lived and confined to the period of maximum C-suite panic over company stock prices and option values.


Related image


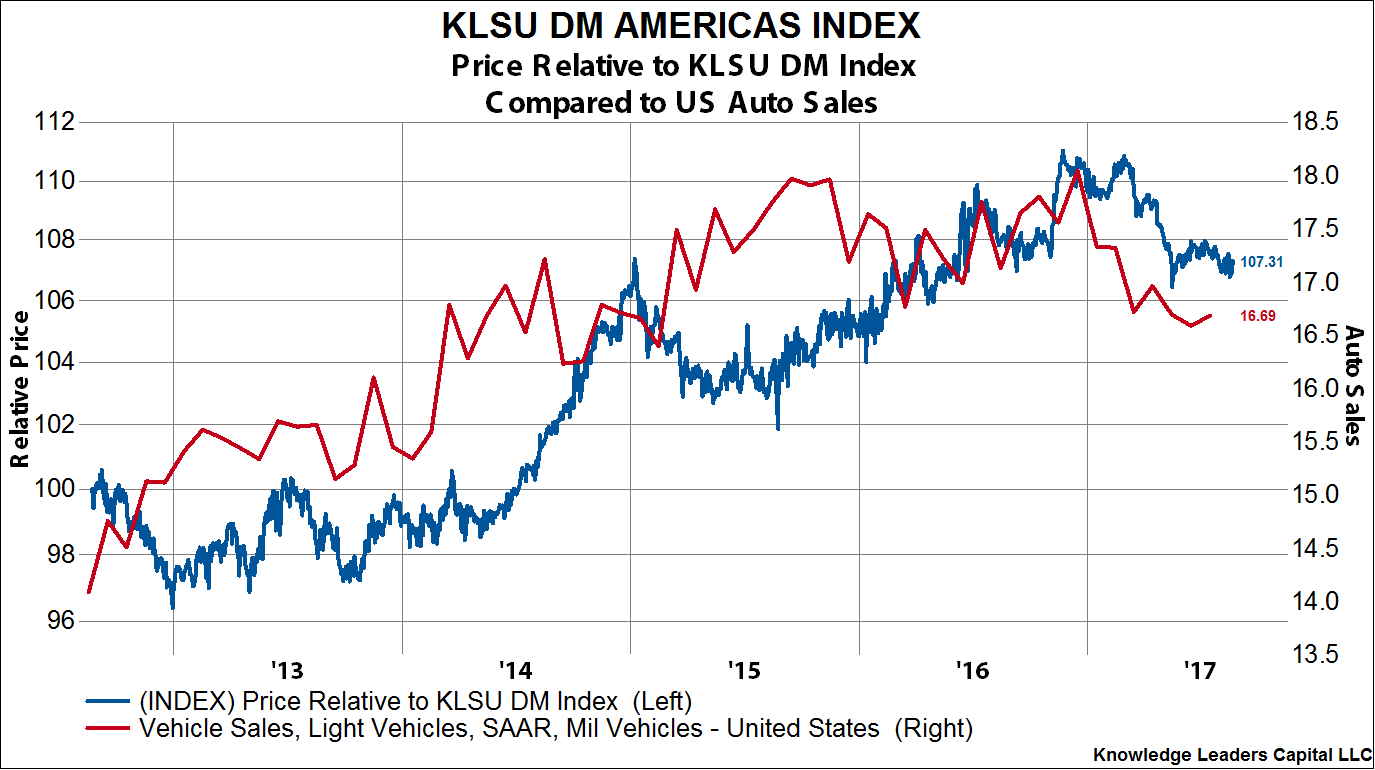
The panic in the C-suites was aggravated substantially by a household sector buying strike----especially on high price tag durables and automobiles.


In fact, the drop in auto sales was spectacular: After drifting steadily lower earlier in the year, dealer sales took a further sharp plunge after August 2008. Altogether, the dollar value of sales off the dealer lots contracted by a stunning 33% before hitting bottom in March 2009.


Needless to say, the above plunge of dealer sales occurred at a time when their lots were already bulging with excess vehicle inventory. Accordingly, the production cut back at domestic assembly plants was downright brutal----with the seasonally adjusted assembly rate dropping from 9.1 million units in July 2008 to just 3.6 million units at the January 2009 bottom.


Indeed, that staggering 60% drop in six months-----which also sent GM and Chrysler into Chapter 11---represented anything but your grandfather"s economy. This was a collapsing Wall Street bubble ripping through the main street economy with malice aforethought.


The recession transmission channel through the C-suite liquidation process is starkly evident in the business inventory data and the BLS data on payroll employment change. As to the former, the chart below makes clear that business inventories had continued to build through the spring and summer of 2008, reaching a peak level of $1.54 trillion in July.


Eventually, $225 billion of that inventory (15%) was liquidated before restocking commenced in November 2009, but the key point is that more than 60% of the destocking occurred during the concentrated period of stock market collapse between September and March. The C-suite was desperately attempting to lighten the load.


Finally, the payroll data surely leaves nothing to the imagination. Nearly 5.5 million jobs were liquidated during eight months stretching from September 2008 through April 2009. That represented nearly 65% of all job losses during the entire Great Recession.


Stated differently, desperate to appease the Wall Street casino via "restructuring" actions to increase ex-items earnings,  corporate America essentially embarked on a scorched earth policy of shooting jobs first and asking questions later.


In short, there can be little doubt that Finance drives Economy in the world of monetary central planning, and that the only place to look for the next recession is in the coiled springs of Bubble Finance.


Needless to say, you can once again find them metastasizing rapidly from one end of the casino to the other; and you will also find not a single word about them in today"s swan song by our Keynesian School Marm.


Then again, Janet Yellen"s cluelessness is also why Wall Street is telling you that the macroeconomic dashboard shows nary a sign of recession, and that its safe to plunge into the casino at 110X the Russell 2000 and 280X AMZN"s miserly earnings.


Call that misdirection like never before. But also know that another No-See-Um Recession is coming right at you.


Saturday, November 11, 2017

Next Phase Of Carmageddon: The Banks

Authored by Wolf Richter via WolfStreet.com,


Banks have started to tighten lending standards for prime and subprime borrowers, and it shows...


Banks are further tightening their lending standards for prime and subprime auto loans. This process started in Q2 2016, when auto lending had reached the apogee of loosey-goosey underwriting that had boosted sales of new and used vehicles to record levels and had ballooned auto loan-balances outstanding to the $1-trillion mark. It also boosted risks for lenders. Inevitably, subprime auto loans started running into trouble in 2016, and it was time to not throw the last trace of prudence into the wind entirely.


The chart below - based on data from the Fed’s Senior Loan Officer Survey on bank lending practices for the third quarter - shows the net percentage of banks tightening lending standards. The negative percentages below the red line signify net easing. It shows how loan officers have gradually, in fits and starts, dialed back their easing before Q2 2016 and ratcheted up their tightening after Q2 2016:


During Q3 2017, 10% of the banks tightened underwriting conditions, compared to the prior quarter, but 0% loosened underwriting conditions. In other words, the tightening is proceeding gradually, on a bank-by-bank basis, and the easing has stopped entirely.


“Banks reportedly tightened most terms surveyed for auto loans,” the report says. Specifically, here are some of the terms the banks tightened in Q3, which adds to the banks that tightening in prior quarters:


  • 7% net tightened conditions on minimum required down payments.

  • 5% net tightened conditions on credit scores

  • 8% net tightened granting loans to customers that did not meet credit scoring thresholds

In a set of special questions, the October survey asked why banks were changing credit standards or terms for prime and subprime borrowers “this year.” The reasons were nearly the same for both prime and subprime borrowers, but subprime is clearly the bigger concern. Here is what banks said about their reasons for tightening lending standards for subprime borrowers:


  • Less favorable or more uncertain economic outlook: 50% somewhat important; 30% very important.

  • Deterioration or expected deterioration in the quality of your bank’s existing loan portfolio: 30% somewhat important; 40% very important.

  • Reduced tolerance for risk: 30% somewhat important; 50% very important.

  • Less favorable or more uncertain expectations regarding collateral values [used vehicle values]: 40% somewhat important; 40% very important.

  • Lower or more uncertain resale value for these loans in the secondary market: 33% very important; 0% somewhat important.

Some of this tightening is already showing up in the data. For example, the average maturity of new-vehicle loans peaked in Q1 2017 at 67.4 months, according to Federal Reserve data. The data for Q3 is not yet available, but by Q2 the average maturity dropped to 66.5 months, the first major drop since 2011.


Note on the left side of the chart how the average maturity plunged during the Financial Crisis as credit was freezing up and as auto sales collapsed, and it was hard to get anything financed:


But the tightening hasn’t yet shown up in total auto loan balances outstanding, which jumped by $19 billion during the third quarter, likely boosted by the first batch of replacement sales from the hurricanes.


What has shown up is a massive adjustment of the data going back to Q4 2015. Since I keep the old data, I overlaid the prior unadjusted data (red line) and the current adjusted data (blue columns) in the chart below. The adjustment retroactively wiped out $39 billion in auto loan balances in Q4 2015. By Q1 2017, the adjustment had wiped out $41 billion:


Adjustment of data happens all the time. These are estimates that can be off, and occasionally, adjustments are made to try to put them back on track. But it does show that auto loans did not suddenly plunge in Q4 2015, as the chart based on the blue columns alone would have otherwise indicated.


That banks are tightening their auto-lending standards ever so gradually is another headwind the auto industry is facing. The hurricanes, by destroying or damaging a few hundred thousand vehicles, created some temporary replacement demand for new and used vehicles, some of it financed by insurance companies.


This replacement demand is now papering over the underlying problems of the industry that are constraining demand:


  • Too much auto debt

  • Too much “negative equity” in vehicles after years of loosey-goosey lending, which makes trading difficult

  • New vehicle prices that have moved out of reach

  • And incomes that have been stagnating for a large part of the population.

And these headwinds will still be there after the replacement demand from the hurricanes settles down.


Carmageddon for Tesla, Fiat Chrysler, Hyundai, and Kia. But not for all automakers. Read…  Pickup Sales Boom, Cars get crushed, Tesla Deliveries Plunge


Monday, October 30, 2017

100 Billion Dollar Babies

While there is no official measurement of a market bubble, Gadlfy"s Stephen Gandel notes that one could be the speed and force of the rise.


Dot-com stocks rose 680% from the beginning of 1996 to the end of March 2000. Bitcoin has risen over 800% in the past year alone, to $6,300 at its peak today...


In that run, it has added roughly $90 billion in value, crossing above $100 billion for the first time on Friday.. and bigger than Goldman Sachs...


But it has taken Bitcoin far lass time than others to join the $100 billion club...


Still, as Gadlfy"s Stephen Gandel writes, compared with other asset classes, like real estate or stocks, bitcoin is a pimple, which is why some people have convinced themselves that bitcoin can"t be in a bubble.


New York City real estate alone is worth more than $1 trillion. There is $8 trillion worth of gold in the world, nearly $15 trillion in Treasury bonds and more than $25 trillion in the U.S. stock market. Bitcoin"s mere $100 billion, by comparison, is small.


But that"s only part of the equation. New York City real estate is worth 10 times bitcoin, but it didn"t pass the $100 billion mark, adjusted for inflation, until the late 1970s, or roughly 310 years after the territory was renamed after the Duke of York. U.S. auto sales didn"t reach $100 billion for 60 years. Apple did it in a sprightly 31 years, but that was still four times slower than bitcoin, which clocked in at about seven years. But Apple, unlike bitcoin, produces significant earnings and holds $260 billion in actual cash.


And the bitcoin universe has now drawn in investors in so-called initial coin offerings, chip manufacturers and technology investors in general. If the bitcoin bubble does pop, the value of a lot more than just the cryptocurrency could vanish.


Sunday, October 29, 2017

"The World"s Largest Sovereign Wealth Fund Is Investing With No Valuation Model"

There are several quotable observations in Eric Peters" latest Weekend Notes, in which the One River Asset Management CIO looks at last week"s melt-up euphoria in markets...


Hope all goes well… Abe wins landslide, Nikkei soars to 21yr high. Xi Jinping is named in China’s constitution, cementing his place alongside Mao, equities jump. House Republicans pass $4trln budget resolution, lifting hopes for a $1.5tlrn tax cut/reform. Despite devastating hurricanes, US Q3 GDP expands 3%, S&P 500 hits record high. VIX 9.80. Biggest Nasdaq 100 daily gain in 2yrs. Bezos becomes world’s richest man, +$10bln on Friday to a $93bln net worth. Such a stunning rise, a synchronized global triumph, unrecognizable from the 2008 cataclysm that produced so many waves.


.... muses on Albert Einstein"s philosophy of happiness, observes the dilemma facing Elon Musk when it comes to auto sales in China, but most notable is his take on modern capital allocation and investing by the $14 trillion pool of 401(k)s and IRAs, which he calls "the world"s largest sovereign wealth fund", and which finds itself forced to invest in such assets as Tajikistan and Iraqi bonds because the traditional framework preached by the MPT is no longer applicable, and as a result "the largest SWF on earth is investing with no valuation model but for the rear-view mirror."


Here is the full excerpt:


Fallujah


“It’s a monolith,” he said. “It essentially operates as a single investor, like a sovereign wealth fund,” he continued.


“In fact, the US 401k and IRA savings is collectively the world’s largest SWF.” From the 1978 creation of the 401k, that pool has grown to $14trln. The early adopters were baby boomers, and their holdings dwarf all others; a combination of decades of contributions and capital gains.


“The firms that help Americans invest their retirement savings use the same models. They all utilize the same inputs, and produce the same outputs.”


“Walk into Schwab, or any competitor, and ask for your target asset allocation,” he said. “You’ll discover that the dominant input is your age. It’s a robo-advisor style of investing.”


The older you become the more bonds you should own relative to stocks. “They boast thousands of portfolio simulations, stress tests.” They explain how the methodology is scientifically proven and based on Modern Portfolio Theory.


“But MPT requires that you build a robust framework for estimating future asset class returns and correlations. And they have no such framework.”


“Without a robust framework for estimating future returns, these 401 advisors turn to the past to estimate future returns,” he explained.


“Do you want to know why money is flowing into emerging market bond funds?” And I nodded. “Because the machine tells retirees that they return 13% a year.”


Grandpa tucked a little Tajikistan into his portfolio last month (10yr bonds auctioned at 7.12%).


Grandma loaded up on Fallujah (Iraq auction yielded 6.75%).


“The largest SWF on earth is investing with no valuation model but for the rear-view mirror.”


Saturday, October 28, 2017

Rental Nation: Unique "Solution" Emerges To Address Flood Of Off-Lease Vehicles...Lease Them Again

We"ve written frequently of late about the coming wave of off-lease vehicles that threatens to flood the used car market with excess supply, crush used car prices and simultaneously wreak havoc on the new car market as well. 


As we recently noted (see: "Flood Of Off-Lease Vehicles" Set To Wreak Havoc On New Car Sales), the percentage of new car "sales" moving off dealer lots via leases has nearly tripled since late 2009 when they hit a low of just over 10%.  Over the past 6 years, new leases, as a percent of overall car sales, has soared courtesy of, among other things, low interest rates, stable/rising used car prices and a nation of rental-crazed citizens for whom monthly payment is the only metric used to evaluate a "good deal"...even though leasing a new vehicle is pretty much the worst "deal" you can possibly find for a rapidly depreciating brand new asset like a car...but we digress.


Of course, what goes up must eventually come down.  And all those leases signed on millions of brand new cars over the past several years are about to come off lease and flood the market with cheap, low-mileage used inventory.  By the end of 2019, an estimated 12 million low-mileage vehicles are coming off leases inked during a 2014-2016 spurt in new auto sales, according to estimates by Atlanta-based auto auction firm Manheim and Reuters.


So, what do you do when you"re industry is being threatened with a massive oversupply situation that could wipe out all pricing power for years to come?  Well, since reducing production is simply not tenable, one group of used car dealers in Wisconsin has an alternative solution...delay the problem for as long as possible by starting up a new used car leasing program. Per Ward"s Auto:


In a pioneering move, the 10-store Van Horn Group now leases used cars.


The 10-store dealership group in Plymouth, WI, began doing it to serve more customers and expand its pre-owned vehicle inventory, says Mark Watson, vice president-variable operations.


Used-car leasing is something of a rarity. But more and more dealers – such as George Glassman of the Southfield, MI-based Glassman Automotive Group – say it’s a good idea whose time has come and manufacturers should get behind it to help remarket waves of vehicles coming off-lease. That number is approaching 4 million a year.


“We are trying to create with used vehicles a unique position, one that allows us to put the client into more vehicle at a lower payment through a lease,” he says.


“Used car leases are an additional revenue opportunity and keep relationships strong with the bank,” says Tonya Stahl, Wisconsin Consumer Credit’s vice president-operations. “It helps us exceed customer expectations by providing flexible finance options for a successful and continual business relationship.”


Of course, while Van Horn"s used car leases provide a great opportunity for him to "double-dip" by effectively selling his used car inventory twice, it does very little to address the underlying problem of oversupply aside from marginally expanding the pool of potential buyers by lowering monthly payments.


Moreover, as Wards notes, used car leasing is not necessarily a new phenomenon as it has historically popped up during previous economic cycles when the auto industry faced similar problems.  That said, in past cycles at least, the concept was quickly scrapped after banks realized it"s nearly impossible to accurately underwrite the risk on a used vehicle when you have absolutely no idea how badly the car may or may not have been abused by it"s first owner.


Used-car leasing is not a new idea, although in the past it has been promoted sporadically, at best.  Could used-car leasing now become more mainstream, with a combination of the right new technology and, to put it bluntly, the renewed motivation to forestall a residual-value crisis?


Back when I was in auto retail, some banks did used-car leasing, as some captives do now, and some retailers did well with it, but it was not sustained by financial institutions.


Used-car lease retailers were hard to find, and not that well promoted. Worse, if trying to calculate a new-car lease back then was difficult (we are talking 1980s and 1990s), cyphering a used-car lease was pretty much impossible.


Unlike a new car, every used vehicle is unique, with a unique payment and residual (and forecasting wasn’t as sophisticated back then). Of course, we didn’t have automated vehicle-history reports (so some finance institutions were the victims of fraud on occasion, which no doubt led to the demise of used-vehicle leasing programs.


In the end, of course, this just moves most Americans one step closer to eternal financial hardship as profits are increasingly consolidated into the hands of monopolistic financial institutions who are all too happy to make you think that lower monthly payments are a "great deal" for you when in fact they only serve to insure that you never build any wealth and you never actually own any assets.


Sunday, October 8, 2017

I Know What the Economy Did Last Summer Part 2: The Real Estate Rollover

A global 2017 housing bubble may be ready to collapse.

In fact, I knew what the economy did last summer before summer even began. Since the beginning of the year, I have been writing that it appeared housing was reaching a new bubblicious peak and that the real estate market was getting ready to roll over. Just before the start of the summer, I confirmed that prediction by saying that it looked like that process had begun. I anticipate it will be a slow turnover at first, just as it was in 2007, which did not reach free fall until late in 2008. Likewise, I anticipate the present decline will not reach free fall until 2018.

While housing played out about as I expected this summer (see below), the more obvious collapse right now is developing in metropolitan commercial real estate, particularly in retail space due to the retail apocalypse. Even longtime commercial real-estate mogul Sam Zell warned last week that he would not consider investing any capital in retail real estate. In Zell’s words, the real estate landscape looks “like a falling knife.”


“An area that’s in this much disarray, with so many weak players, is not an area where I would want to deploy capital at this time. And I’m generally a contrarian, and I generally rub my hands together at the opportunity for serious dislodgment, but I think what we’re dealing with here is very significant… It’s going to be very hard to take that shopping center land and redevelop it with all of these competing people having rights.” (Newsmax)


Zell sees retail’s mortal throes as a violent struggle that is going to take a few years to play out.


A second problem the commercial real estate bubble faces (and Zell describes it as a bubble in that there is way too much space dedicated to retail in the US compared to other nations), is that Chinese investors are being forced to exit, and they have been a major support to that space. In Manhattan, for example, Chinese investors have made half of all commercial real estate purchases. The Chinese government decided this summer to squeeze that dry in order to stop the flow of yuan out of the country. In London and Australia, Chinese buyers accounted for about a quarter of commercial real-estate purchases. The Chinese government is pressuring Chinese banks to stay away from these deals.


Morgan Stanley estimates that China overseas direct property investment could plunge by 84% in 2017 and another 15% in 2018. (Business Insider)


After a seven-year boom, commercial real estate prices peaked this year with July showing the first year-over-year decline. Transactional volume also declined 8% in the first half of 2017 with the second quarter turning out to be the third consecutive quarter to see year-on-year declines. Without the Chinese bellows pumping a lot of oxygen into the fire, it looks like the flame is going out.


The second US housing bubble in a decade started showing several signs of topping this summer


Exactly as predicted on this blog…


U.S. homebuilding unexpectedly fell in July amid broad declines in single- and multi-family home construction, suggesting the housing market was struggling to rebound after slumping in the second quarter. Housing starts declined 4.8 percent. (Newsmax)


While it was “unexpected” to economists, who couldn’t even see the Great Recession coming, it certainly wasn’t unexpected here. I pointed out during the second quarter that the slump back then looked like the beginning of a rollover in housing that would become more evident in the summer. July added momentum to spring’s decline; at which point, June also also got revised downward. The concurrent decline in building permits indicated the deteriorating condition of the housing market would persist.


Housing is now falling at its steepest pace since 2010. New-home sales fell even harder in July than new-home construction, crashing a whopping 9.4% month on month. That amounted to an 8.9% plunge year on year and established a seven-month low. (Economists had actually expected a 0.3% gain! I can only wonder how they came by their lame prediction.)


Then homebuilding fell again in August when a rebound in single-family home construction was more than offset by persistent weakness in multi-family home construction and when the number of permits issued for new single-family homes took yet another drop, while the permits for multi-family homes went up. In all, a mixed month.


Likewise, pending sales dropped in August, backtracking 2.6% (YoY) to their lowest since January of last year to which the chief economist of the National Association of Realtors said the housing market has been drained of all of its past year’s momentum. He attributed this in large part to home prices having risen far above incomes.


The continual decline in sales (number of houses sold) means that housing prices have to start falling again, which so far they have resisted, in order for homes to start to become affordable under rising interest rates. Affordability based on the slight rise in income over the huge rise in prices since the Great Recession is at the lowest it has been since 2008, so buyer pessimism about ever being able to afford a house is rising quickly.


With another bump in interest from the Federal Reserve anticipated by nearly everyone in December, a price decline is now inevitable as there are very few potential buyers left at current prices. Each hike reduces the number of qualified potential buyers unless prices drop or wages rise. Of course, falling prices will also mean homes start to go underwater on their mortgages. Then defaults will start to rise as a result because adjustable rates will go up some, and people who bought to flip will be underwater; everyone will be less able to refinance. The math is the same as in 2007.


The summer plunge, therefore, shouldn’t have surprised any economist, given that rising interest rates are certain to force people out of the market when wages are not rising and prices have risen a lot in many regions. Immigration is also tightening, thereby reducing the number of first-time buyers. One has to wonder how economists missed all of this. How are house-warming parties not going to come to an end when the cheap booze is taken away? Apparently economists learned nothing from the situation that created the Great Recession. Nor did politicians, for we are right back where we were in the fall of 2007.


In fact …


U.S. consumers slowed their borrowing in August to an annual pace of 4.2 percent — a pullback from a pace of nearly 7 percent over the past three years.(Newsmax)


Of course they did. How could they not? While those figures do not include mortgages, the same forces are at work in both credit markets.


Moreover …


Economists and financial markets monitor the consumer borrowing report for insights about consumer spending, a category that represents about 70 percent of U.S. economic activity.


So, how could a 40% slowdown in the annual expansion of consumer borrowing (compared to the previous three years) not be indicative of an economy that is showing some major cracks, as I had said we’d see emerge this summer?


The hurricanes’ helping hand for housing construction strikes a blow to banks and insurance


As noted in other articles, the recent hurricanes are bound to help the housing construction market, as a massive number of new homes will have to be rebuilt and old homes will have to be repaired; but economically, that doesn’t really help the economy overall (as also noted earlier). As with auto sales, the hurricanes shift the hurt from one part of the economy to another as insurance companies, banks, and the national debt all take major hits. (Banks were not fully covered by insurance on these mortgages because not all homes were in areas that required flood insurance to get a loan.)


According to Black Knight Financial Services, of the 1 million or so mortgaged homeowners in the [Hurricane Harvey] disaster area, more than 75,000 will become delinquent within two months, and 45,000 are at risk of becoming seriously delinquent or even face foreclosure inside a four-month period. (Newsmax)


[As assessments of damage continued, Black Knight updated its figures to 300,000borrowers in the vicinity of Houston (and adding Florida) could become delinquent on their loans and 160,000 could become seriously delinquent, or more than 90 days past due. And the count for Irma is still unfolding.]


If the latest figures prove out, it will amount to, at least, a 25% increase in nationwide foreclosures just from Hurricane Harvey! $700 billion in mortgage balances are at some level of increased risk in those two hurricane areas. That means the reconstruction after Hurricanes Harvey, Irma and Maria (and now unfolding … Nate) will be happening at a time when banks will be less able to make loans or, at least, lest likely, as they are entering a period of intensified strains.


I would also expect some lag between the loss of housing construction that was already underway before Harvey and the pickup in housing that will come in its aftermath. That’s because debris has to be cleared out of the way, infrastructure repaired, materials brought in, permits issued, plans made, qualified labor hired, etc.


All of this is likely to make prices rise even higher because of labor shortages and material shortages. Labor shortages, however, may mean a lot of reconstruction has to wait for a long time. (All good news if you’re a carpenter, plumber, electrician, etc.; but not if you’re not.) The downward effects of the hurricanes are likely to be far greater in the near term than any lift from reconstruction:


“With the pace of housing starts in July and August retreating, and a likely depressed September, we now anticipate that housing starts will fail to expand much, if at all, in the third quarter,” said Kristin Reynolds, a U.S. economist at IHS Markit in Lexington, Massachusetts. (Reuters)


Overall, growth in construction in the US dropped this summer to its lowest level since 2011, matching the growth level it held just before the financial crisis in the fall of 2007 — a common theme in Summer’s data.


And this last week brought another piece of data in common with that theme of reverting back to the mean of Great Recession statistics:


Wall Street was completely clueless ahead of today’s payroll, with most expecting a small positive print but two brave forecasters went so far as to predict that the recent hurricanes would result in a negative print, and sure enough, moments ago the BLS reported that in September, the US economy lost 33,000 hurricane distorted jobs, the first payrolls decline since September 2010. (Zero Hedge)


The hurricanes forced the first decline in jobs since the tail end of the Great Recession. While that’s an anomaly, it’s an anomaly that is starting to sound like a new statistical trend toward reversion.


Non-farm payroll change chart


As anticipated, none of this stopped the Federal Reserve from commencing with its great QE unwind this month.


So, three major cracks that I have been predicting all showed up this year on schedule:


  1. A significant decline in auto sales and prices and accompanying rise in auto loan defaults.

  2. A major decline in retail sales, resulting in rising defaults and mall and store closures.

  3. The start of a rollover in real estate.

(See “I Know What the Economy Did Last Summer Part 1 : Carmageddon and the Retail Apocalypse.”)


I’ll close with a summary of the summer from Jeffrey Snider that isn’t very summery:


We can’t pretend as if the economy was cooking before Mother Nature interfered. It wasn’t. If one thing has become absolutely clear about the economy in 2017, it is that it has fallen off dramatically when compared to the last half of 2016. This is the opposite of what was supposed to happen, what most people and all Economistswere expecting. The rebound off the early 2016 trough was only the first part of bigger things, or so it may have seemed. For reasons beyond the mainstream grasp, however, the farther into 2017 we go the farther away that dream seems to get.(TalkMarkets)


In my next article, I’ll review the stock market where I said I anticipate a crash sometime between the start of summer and January of 2018. While a stock-market crash has not yet begun, I allotted myself a broader window for that one, noting that central banks could easily hold the market up well beyond the start of summer now that stocks are entirely rigged by central banks … even to the point of CB’s directly purchasing certain companies that are most notably driving the market up.

Wednesday, October 4, 2017

Hurricane Harvey Surge-Nado: Auto SAAR Soars To 30-Year High On Hurricane Replacements

Last month, when we reported auto sales data, we noted that this month would be all about replacement demand from Hurricane Harvey and thus largely irrelavant.  Fast forward 30 days and that appears to be exactly what has happened as annualized auto sales for the month of September suddenly surged to a 30-year high of 18.5mm units, up 15.2% sequentially from a 16.0mm run-rate last month.


SAAR


That is, of course, unless you believe CNBC"s Phil LeBeau who took to the airwaves earlier today to argue that a substantial portion of the sudden surge in auto sales was not necessarily attributable to the fact that a couple hundred thousand cars were destroyed in last month"s hurricanes but rather just a reflection of an abrupt rebound in consumer demand after months of weak data...


...once you"re done with the laughing fit we can continue to review this month"s auto data...


Not surprisingly, almost every OEM, with the exception of Fiat Chrysler, managed to post a significant YoY increase in sales courtesy of Hurricane Harvey.  The only surprising takeaway was just how wrong wall street was in their estimates for the quarter.


Meanwhile, per the charts below from Stone McCarthy, the transition from cars to trucks continued during September with car sales dropping 2.8% YoY versus and 8.1% increase in truck sales. 


All of which likely contributed to Ford"s announcement after the close today suggesting, among other things, a shift in future capital allocation to increased production of SUVs and trucks away from cars...which should be complete right about the same time that oil prices spike back to $100 per barrel rendering those SUVs/Trucks completely unaffordable again.  Here are the highlights from Ford"s press release:


Accelerating the introduction of connected, smart vehicles and services customers want and value. By 2019, 100 percent of Ford’s new U.S. vehicles will be built with connectivity. The company has similarly aggressive plans for China and other markets, as 90 percent of Ford’s new global vehicles will feature connectivity by 2020.


Rapidly improving fitness to lower costs, release capital and finance growth. Ford is attacking costs, reducing automotive cost growth by 50 percent through 2022. As part of this, the company is targeting $10 billion in incremental material cost reductions. The team also is reducing engineering costs by $4 billion from planned levels over the next five years by increasing use of common parts across its full line of vehicles, reducing order complexity and building fewer prototypes.


Allocating capital where Ford can win the future. This starts with the company reallocating $7 billion of capital from cars to SUVs and trucks, including the Ranger and EcoSport in North America and the all-new Bronco globally. Ford also has plans to build the next-generation Focus for North America in China, saving capital investment and ongoing costs. Further, Ford is reducing internal combustion engine capital expenditures by one-third and redeploying that capital into electrification – on top of the previously announced $4.5 billion investment.


Of course, with this non-recurring, one-time surge in demand helping to offset the industry"s pesky inventory crisis (per table below GM was able to reduce inventory MoM by over 70,000 units), the question now becomes whether OEMs will maintain some discipline and restrict production to reflect a normalized SAAR environment or if they"ll just flood dealer lots all over again...we have a guess.


Of course, while today"s results were largely just noise, shareholders still loved the headlines...


Sunday, September 10, 2017

China Warns Trump: "We Will Back North Korea If The US Strikes First"

All day Saturday, South Korea braced for a possible new missile test by North Korea as the provocative northern neighbor marked its founding anniversary, just days after its sixth and largest nuclear test rattled global financial markets and further escalated tensions in the region. Throughout the week, South Korean officials warned the North could launch another intercontinental ballistic missile, in defiance of U.N. sanctions and to further provoke the US. As Reuters reports, Pyongyang marks its founding anniversary each year with a big display of pageantry and military hardware. Last year, North Korea conducted its fifth nuclear test on the Sept. 9 anniversary.


Ultimately, September 9 came and went, and North Korea did nothing, perhaps signalling its eagerness to de-escalate. Or perhaps not, and Kim is simply looking to surprise his adversaries with the ICBM launch date. Experts have said the rogue, isolated regime is close to its goal of developing a powerful nuclear weapon capable of reaching the United States, something Trump has vowed to prevent.


Celebrating its founding anniversary, a front-page editorial of the Saturday edition of North Korea’s official Rodong Sinmun said the country should make “more high-tech Juche weapons to continuously bring about big historical events such as a miraculous victory of July 28.”. The July date refers to the intercontinental ballistic missile test (Juche is North Korea’s homegrown ideology of self-reliance that is a mix of Marxism and extreme nationalism preached by state founder Kim Il Sung, the current leader’s grandfather).


* * *


Meanwhile, South Korean nuclear experts, checking for contamination, said on Friday they had found minute traces of radioactive xenon gas but that it was too early to link it to Sunday’s explosion. The Nuclear Safety and Security Commission (NSSC) said it had been conducting tests on land, air and water samples since shortly after the North Korean nuclear test on Sunday. There was no chance the xenon “will have an impact on South Korea’s territory or population”, the agency said.


What is more concerning, however, is a Friday report on NBC, according to which Trump is readying a package of diplomatic and military moves against North Korea, including cyberattacks and increased surveillance and intelligence operations, after the nation"s sixth and largest nuclear test.


Trump"s top national security advisers walked him through a range of options over lunch in the White House on Sunday, just hours after North Korea"s latest test, officials said.


According to NBC, Trump is also seriously considering adopting diplomatically risky sanctions on Chinese banks doing business with Pyongyang and upgrading missile defense systems in the region, administration officials said. In addition, the administration is not ruling out moving tactical nuclear weapons to South Korea should Seoul request them, a White House official said, though many consider such a move a nonstarter. It would break with nearly three decades of U.S. policy of denuclearizing the Korean Peninsula.


U.S. officials have also made the case to China that if Beijing doesn"t take stronger steps against North Korea, such as cutting off oil exports, South Korea and Japan are likely to pursue their own nuclear weapons programs and the U.S. won"t stop them, the official said. "It"s more a message for China than North Korea," the official said.


The U.S. has adopted sanctions aimed at Chinese entities that conduct business with North Korea, but has so far held back on broadly targeting China"s banking system. China has told U.S. officials it would protest such a move diplomatically and retaliate, according to the senior administration official.


So what happened on Sunday? According to NBC, Trump"s national security advisers presented him with U.S. military options, including pre-emptive strikes, and nuclear capabilities should America be called on to abide by its treaty obligations in the region, White House and defense officials said.


The president"s advisers have made the case, however, that military strikes on North Korea could have serious repercussions, senior defense officials said, and the most glaring among these is that China has told administration officials that if the U.S. strikes North Korea first, Beijing would back Pyongyang, a senior military official told NBC.


This is not the first time China has warned the US not to escalate: on August 11, Beijing, through the state-owned media, cautioned the US president on Friday that it would intervene (militarily) on North Korea’s behalf if the US and South Korea launch a preemptive strike to “overthrow the North Korean regime,” according to a statement in the influential state-run newspaper Global Times.


"If the U.S. and South Korea carry out strikes and try to overthrow the North Korean regime and change the political pattern of the Korean Peninsula, China will prevent them from doing so," it said.


At the same time, the Chinese regime made it clear that its preferred outcome would be a continuation of the status quo, warning Kim Jong Un, or perhaps Trump, that it would "remain neutral if North Korea were to strike first."


As we said almost one month ago:


"not surprisingly, analysts have compared the standoff between the two nuclear powers (the North is a recent, if untested, member of this club) to a modern day Cuban Missile crisis.  "This situation is beginning to develop into this generation"s Cuban Missile crisis moment," ING"s chief Asia economist Robert Carnell said in a research note. "While the U.S. president insists on ramping up the war of words, there is a decreasing chance of any diplomatic solution."


Since then, the potential risks, mutual threats and near-hostilities have grown exponentially. China - which is by far North Korea’s biggest trading partner, accounting for 92% of two-way trade last year, and also provides hundreds of thousands of tonnes of oil and fuel to the impoverished regime - has only dug in deeper, explaining repeatedly that it wants a peaceful de-escalation and that it would not side with the US in case of a military conflict.


* * *


What happens next? Well, on one hand, after today"s lack of launch, there is hope that things will indeed de-escalate. A headline that just hit from Yonhap may accelerate this:


  • SOUTH KOREA SEES NO SIGNS OF IMMINENT ADDITIONAL PROVOCATIONS BY NORTH KOREA THAT COULD LEAD TO ANOTHER MISSILE OR NUCLEAR TEST: YONHAP

On the other hand, what the US does next may be a sufficient provocation to force Kim to lob another ICBM. Earlier today, Reuters reported that the USS Ronald Reagan aircraft carrier left its home port in Japan for a routine autumn patrol of the Western Pacific, a Navy spokeswoman said. That area included "waters between Japan and the Korean peninsula." North Korea vehemently objects to military exercises on or near the peninsula, and China and Russia have suggested the United States and South Korea halt their exercises to lower tension.


Another imminent escalation is due on Monday.


That"s when the United States told the U.N. Security Council that it intends to call a meeting to vote on a draft resolution establishing additional sanctions.  U.S. ambassador to the United Nations Nikki Haley said last Monday that she intended to call for a vote on Sept. 11 and then the United States circulated a draft resolution to the 15-member council on Wednesday.


The United States wants the Security Council to impose an oil embargo on North Korea, ban its exports of textiles and the hiring of North Korean laborers abroad, and to subject Kim Jong Un to an asset freeze and travel ban, according to a draft resolution seen by Reuters on Wednesday.


It was not immediately clear how North Korean allies China and Russia would vote, but a senior U.S. official on Friday night expressed scepticism that either nation would accept anything more stringent than a ban on imports of North Korean textiles. Chinese officials have privately expressed fears that imposing an oil embargo could risk triggering massive instability in its neighbor. 


Meanwhile, tensions are also growing between China and South Korea. The two countries have been at loggerheads over South Korea’s decision to deploy the U.S. THAAD anti-missile system, which has a powerful radar that can probe deep into China. Shares in South Korean automaker Hyundai Motor and key suppliers slid on Friday on worries over its position in China after highly critical Chinese state newspaper comments. Recently Hyundai auto sales in China have crashed as local suppliers and potential customers have shied away from the company due to nationalistic prerogatives. The military section of China’s Global Times newspaper on Thursday referred to THAAD as “a malignant tumor”.


The good news, for markets, is that this Saturday"s widely anticipated ICBM launch from North Korea did not take place; the bad news is that said launch was at best delayed, and if and when it comes, the US will have to choose: do nothing again, and appears increasingly weak on the global diplomatic arena, or retaliate, and risk dragging China into the conflict, potentially precipitating the appearance of mushroom clouds around the globe.

Saturday, September 2, 2017

Palladium Suddenly Spikes To 16-Year Highs

Amid hope for reinvigorated auto production (after Hurricane Harvey"s destruction) and yesterday"s escalation in US-Russia tensions (Russia being the world"s largest producer), spot Palladium is spiking today, hitting its highest since record highs in January 2001.


While the entire gamut of industrial and precious metals have been rising recently (the latter on the back of Chinese demand hype), Palladium prices exploded today out of nowhere (biggest jump in 7 months).


Pushing the precious metal to its highest in 16 years...


There appear to be a few catalysts for the recent trend and today"s spike...


1. China"s commodity panic-buying trend


There just appears to be blind panic-buying momentum from China in any and every industrial metal and along with gold prices surging amid North Korea and debt ceiling drama, we suspect Palladium is catching a bid on the back of that.


2. Renewed hopes for growth in the auto sector


As Bloomberg notes, approximately 67 percent of palladium produced is used in catalytic converters, which convert up to 90 percent of the harmful gases in automobile exhaust to less noxious substances. Global auto sales, up 4 percent for the year, are driven by a global increase in SUV sales, the ongoing shift from diesel to gasoline engines in Europe (diesel engines alternatively use platinum), and tightening emission legislation.


Sales of autos fueled by petroleum have been particularly strong in China and India. According to Jeffrey Christian, managing partner of CPM Group, car sales in China have been “borrowed” from future years through the offering of rebates and tax cuts. In the first half of the year, auto sales in China rose 4.3 percent, to 13.4 million units, from a year earlier.


US Auto sales just collapsed though...


ZH: And the recent devastation caused by Hurricane Harvey is prompting companies like Ford to discuss increasing production once again.


3. Tighter supply due to Russian sanctions


Russia is the world"s largest supplier...


Source


Bloomberg notes that on Aug. 2, Congress passed a bill approving new sanctions on Russia in response to its interference in the 2016 U.S. presidential election, as well as its human rights violations, annexation of Crimea, and military operations in eastern Ukraine. The measure substantially reduces the president’s power to waive or ease certain sanctions without congressional approval.


The bill lists 12 types of sanctions that can be imposed on people and entities that, for example, conduct “significant” transactions with Russian defense and intelligence agencies and invest or facilitate the investment of $10 million or more in the privatization of any state-owned asset that unfairly benefits government officials or their associates.


So far, Russia has been able to maintain stable palladium supplies in the face of international political issues. Yet since 2014, a bloc of nations -- including Switzerland, Japan, Australia and Canada, as well as the European Union -- has imposed sanctions against Russia.


Norilsk Nickel, a public joint stock company, is the world’s leading producer of palladium and nickel. Its key shareholders are two powerful Russian oligarchs: Vladimir Potanin’s Interros and Oleg Deripaska’s Rusal. Each reportedly owns more than 25 percent of shares. Interros Group is one of the largest private investment companies in Russia. Deripaska has close ties to President Vladimir Putin and a connection to the American political consultant Paul Manafort, whom Deripaska employed from at least 2005 to 2009.


Norilsk Nickel reported that its palladium production fell 2 percent in the first half of the year from a year earlier, to almost 1.3 million metric tons. CPM’s Christian indicated that Norilsk’s stockpiling in the first quarter likely contributed to the tight market in May and June.


Although markets are fairly balanced, showing a small surplus, Norilsk said palladium consumption is expected to reach an all-time high of 10.8 million ounces, and is forecasting a deficit this year of more than 1 million ounces.


ZH: And additionally yesterday saw an escalation in tensions between US and Russia as the state department ordered the San Francisco consulate closed... prompting angry responses from Moscow - and perhaps retaliation.


*  *  *


We suspect the latter two are the most critical factors for today"s spike.

Thursday, August 24, 2017

Why Is North America's Equity Market Underperforming?

Authored by Steven Vanelli via Knowledge Leaders Capital blog,


On a relative basis, compared to the developed world, North American stocks peaked on November 23, 2016, and have since underperformed by about 4% (in USD).


In the charts below, we compare the relative performance of our KLSU North America Index to various economic variables. Our KLSU North America Index captures the top 85% of the market cap in North America, is a market cap weighted index and USD based. Our KLSU DM Index captures the top 85% of the market cap of all 22 developed countries. It also is a market cap weighted index and USD based.


1. Auto sales have rolled over recently, having peaked at 18.05 million units in December 2016. The current run rate is 16.69 million units.


2. New house sales have stalled out. New house sales peaked in March at 638,000 units. July figures were released today showing sales have fallen to a level of 571,000 units.


3. Core inflation has slipped significantly lately, dropping from an annualized rate of 2.26% in January to a current level of 1.7%.


4. Driving the drop in inflation is the recent lower revision to compensation, which in turn caused a big revision down in corporate unit labor costs.


5. The US budget deficit is rolling over and beginning to widen again. After peaking at 2.21% of GDP in February 2016, the annualized budget deficit is now over 1% wider at 3.32% of GDP.


6. Lastly, it appears consumer confidence is waning, helping explain the weak retail figures we’ve seen.


*  *  *


ZH: But apart from that, BTFD!

Tuesday, August 15, 2017

One Analyst Throws Up On Today's Retail Sales Data: Here's Why

Two weeks ago we reported that July auto sales were a disaster: recall sales for bloated with inventory GM were down 15% YoY, Ford off 7% and Chrysler down 11% - despite record incentive spending - as overall auto sales declined and disappointed for yet another month. And yet, according to this morning"s retail sales report from the Census Bureau, sales for "motor vehicle & parts stores" rose much more robustly than anyone had anticipated, rising 1.2%, the fastest pace since December.


This number was so bizarre, and so out of context with recent sales data, that SouthBay Research threw up all over it in its morning note today. Here"s why:


  • Retail Sales m/m: 0.6%

  • Retail Sales ex Autos m/m: 0.45%

  • Retail Sales ex Autos & Amazon m/m: 0.3%


Consumer Retail Spending was Actually Mild, As Expected


  • Auto Sales growth unbelievable

  • Amazon Prime Day juiced the results

Don"t believe the auto sales data.  Per the BEA, unit sales were flat m/m (+90K).  Meanwhile, per JD Power, July average retail prices were $950 lower than June"s as auto dealers struggled to make sales and incentives averaged $3.9K, the highest on record and $100 higher than June.


  • Hmmm, no rise in auto sales per the real world and the BEA.  Coupled with a fall in net prices. But in fantasy land, the Census Bureau announces a $1.2B m/m jump in sales and a 7%+ y/y rise.

Amazon Prime Day Was Huge...and will Cut August Sales


  • Nonstore Retail Sales jumped $700M m/m.  That"s the Amazon Prime Day effect. I modeled it lower and that"s the source of my miss this month

Reasons for Caution: Government Data is Overstating Reality


  • The Retail strength does reinforce my view that macro data favors the US in 2H and that the dollar is oversold. But the Retail headline figure is wrong and analysts were correct: consumer spending as captured by Retail is sluggish.  The fact that reality is badly captured by the Retail figures is concerning insofar as it affects the Fed"s decision making. 

The opportunity is to recognize that consumer spending in the real world will pull back and it will also be missed by the official data.  With Consensus unprepared for the pull back, it will deliver a greater shock.


Meanwhile, here"s a quick look at SouthBay"s proprietary "Vice Index."


For those who are unfamiliar, the vice index tracks US consumer spending on alcohol, marijuana, prostitution and gambling, Vices are a special form of discretionary spending that is highly sensitive to near-term
economic conditions: i) Cash based: depends on free cash flow; ii) Luxury spending: wants not needs; iii) Significant dollar amount: not pricey but not cheap. Vice spending is broadly representative of the US consumer: i) Broad-based: Every socioeconomic and demographic group participates; ii) High-volume transactions: Over 100M discrete events per year.


The reason why this index is of particular interest, is because vices predict retail spending with a 4-month lead. Luxury spending is the 1st thing to be affected by changes in household finances.


This is what the index shows:


Friday, August 4, 2017

This One Chart Perfectly Explains Why The Auto Market Is Doomed

Earlier today Bloomberg posted the following chart comparing new vehicle sales in the United States to scrappage rates of old clunkers.  Now, what should immediately catch your eye (even without the huge red circle we felt compelled to add), is the fact that new car sales have been massively outstripping scrappage rates for the past 5 years.


Of course, as many of you will undoubtedly note, there are plenty of legitimate reasons why new car sales may outstrip scrappage rates in certain markets.  We completely agree...but, unfortunately, none of them apply to the U.S. automotive market.


One reason could be that the market is simply under-penetrated.  That said, with a fleet of ~265mm light vehicles on the road today vs. a driving age population of only ~255mm people, or just over 1 car per person, we would say the market is fairly penetrated. 


Another possible explanation for this phenomenon could be population growth.  Taking a look, we find that new car sales outstripped scrappage by about 5 million units in 2016 which, on a base of 265 million vehicles, implies population growth of 1.9%.  Unfortunately, the U.S. population is growing at exactly one-half that rate...


Which leaves us with one remaining explanation: a massive debt and lease-fueled auto bubble that has been sparked by a ridiculous buying spree courtesy of everyone with a pulse suddenly rushing out to trade in their 10-year-old Maxima for a brand new BMW....because you can "afford" it so long as you can get approved for a 0% interest, 8-year loan which pegs your monthly payment at that magical $400 mark...


So what is a more "normalized" auto SAAR for the US market?


Well, as we mentioned above there are roughly 265mm light vehicles registered in the U.S. today compared to only 255mm driving age people, or just over 1 car per driver...which seems somewhat reasonable. 


Now, putting aside population growth and other metrics for a moment, if only 13 million cars are getting scrapped each year, that implies a 20-year average useful life and a "normalized" annual SAAR of 13 million...not that complicated but somewhat inconvenient for the auto OEMs.


The problem is that the useful life of cars has actually improved dramatically over the past 20 years which only makes the "normalized" number even worse.  Per data from the Bureau of Transportation, the average age of vehicles has increased at a CAGR of 1.6% per year over the past two decades...more than enough to offset population growth. 


Autos


Just to illustrate why that is a problem, the following table shows the implied U.S. auto SAAR based on varying useful life assumptions....each 1 year expansion in a vehcle"s useful life cuts about 1mm out of required annual sales.


Autos


Said another way, in order to maintain the 18mm annual selling rate of vehicles that the US obtained in 2016, each driving age person would have to own 1.4 vehicles.  Now, while we fully understand there are a minority of "super users" of almost any product, we"re pretty sure the average user only needs 1 car at a time.


Autos


In conclusion, with full penetration rates, increasing vehicle useful lives and the threat of autonomous vehicles increasing utilization rates, it"s difficult to see how "normalized" auto sales aren"t substantially lower than the current run-rate.  Moreover, with interest rates starting to rise and auto buyers extremely sensitive to monthly payments, we suspect the auto SAAR game is reaching the end of it"s useful life.