Showing posts with label Gross Domestic Product. Show all posts

Sunday, December 24, 2017

China Admits To Fake Data (Again) - Hidden Debt & Inflated Revenues

It"s not the first time (and it won"t be the last), but a recent nationwide audit found some local governments inflated revenue levels and raised debt illegally, once again crushing China"s credibility on the global stage when it comes to economic performance.


As Bloomberg reports, ten cities, counties or districts in the Yunnan, Hunan and Jilin provinces, as well as the southwestern city of Chongqing, inflated fiscal revenues by 1.55 billion yuan ($234 million), the National Audit Office said in a statement on its website dated Dec. 8.


The inspection, which covered the third quarter, also found that five cities or counties in the Jiangxi, Shaanxi, Gansu, Hunan and Hainan provinces raised about 6.43 billion yuan in debts by violating rules, such as offering commitment letters.


The findings are a blow to China’s bid to rein in data fraud, which has been widespread in some of the poorer provinces where officials were incentivized to inflate the numbers as a way of advancing their careers.


Concern from investors wanting to be able to trust data out of the world’s second-largest economy led to the government trying to crack down on the practice, with President Xi Jinping saying in March that data fraud “must be throttled,” according to the state-run Xinhua News Agency.


While historically investors would rapidly shrug this news off and buy more stocks, with Chinese sovereign bond yields near their Maginot Line of 4.00%, losing credibility could be critical.


A new supervisory body was set up within China’s statistics office in April to bolster and ensure data authenticity and quality.


The country is also shifting to the latest United Nations-based statistical standard and using computers -- rather than local reports -- to calculate provincial gross domestic product, the chief economist said in September.


Wednesday, December 13, 2017

How GDP Became A Joke, In One Chart

For all the rhetoric about above-trend US growth, one month ago UBS shattered the narrative of surging GDP by showing just one chart, which revealed that excluding contributions from energy investment, which are about to hit a brick wall now that the price of oil has peaked and is reverting lower once again, US growth for the past 2 years has been slowing.


On the other hand, things get even more complicated thank to a chart released yesterday by UBS" global chief economist Paul Donovan who makes a point we have repeatedly underscored over the past decade, namely that economic data is largely worthless, and any instant snapshot reveals more about the political and "goalseeking" climate of the agency releasing the "data" than about the underlying economy itself.


As Donovan shows, here are the no less than 6 answers one gets to the question of "how fast was the US growing at the start of 2015?."


By way of context, recall that this was the quarter when the US was blanketed by deep snow, and when every "expert" was rushing to convince those who bothered to listen that the economy would suffer a sharp slowdown as a result of the weather and nothing but the weather (and yes, that included UBS). And when the number was first reported, that was indeed the case: with Q1 2015 GDP reportedly growing only 0.2%. The problem is that within just over a year, that 0.2% initial GDP print turned to -0.7%, before subsequently surging to 2% and ultimately 3.2%!


Here is the sarcastic take of UBS" own chief economist on this GDP travesty, which is even more sarcastic  - and ironic - considering his entire job is to predict the exact number associated with said travesty:


Economic data is not very precise. Economists are trying to hit a target that is moving rapidly. Economic data is being revised more often, and the revisions are larger than in the past. The following chart shows annualized US GDP growth in the first quarter of 2015.


Growth was initially reported very weak, below consensus and barely moving. Then the data was revised to show the US economy was shrinking – and shrinking a lot (the number was –0.7% annualized). Then it was revised to show the economy was shrinking a bit. Then it was revised to show the economy was growing, but a long way below trend growth.


The growth number was then revised to be basically in line with trend growth. Now, US growth at the start of 2015 is thought to be 3.2%.


So which number in the range of –0.7% to 3.2% is the economist supposed to be forecasting? An economist predicting 3.2% growth when the data was first released would have been ridiculed. According to the latest information we have, that economist would have been right.


In other words, that terrible weather which at the time was used to justify why the economy ground to a halt - when in reality it was all a function of China"s credit impulse crashing - would eventually serve as a the catalyst to grow the economy at a pace that has been recorded on just a handful of occasions in the past decade.


No wonder then economists - especially those who work at the Fed but all of them really - their predictions and their analyses have become the butt of all jokes; and by implication, no wonder traders and algos no longer respond to economic "data."


Monday, December 4, 2017

America"s Military-Industrial Addiction

Authored by JP Sottile via ConsortiumNews.com,


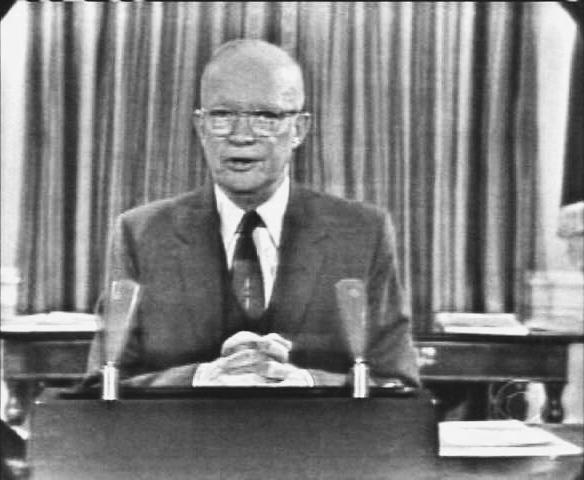
Polls show that Americans are tired of endless wars in faraway lands, but many cheer President Trump’s showering money on the Pentagon and its contractors, a paradox that President Eisenhower foresaw...


The Military-Industrial Complex has loomed over America ever since President Dwight D. Eisenhower warned of its growing influence during his prescient farewell address on Jan. 17, 1961. The Vietnam War followed shortly thereafter, and its bloody consequences cemented the image of the Military-Industrial Complex (MIC) as a faceless cadre of profit-seeking warmongers who’ve wrested control of the foreign policy. That was certainly borne out by the war’s utter senselessness … and by tales of profiteering by well-connected contractors like Brown & Root.


Over five decades, four major wars and a dozen-odd interventions later, we often talk about the Military-Industrial Complex as if we’re referring to a nefarious, flag-draped Death Star floating just beyond the reach of helpless Americans who’d generally prefer that war was not, as the great Gen. Smedley Darlington Butler aptly put it, little more than a money-making “racket.”


The feeling of powerlessness that the MIC engenders in “average Americans” makes a lot of sense if you just follow the money coming out of Capitol Hill. The Project on Government Oversight (POGO) tabulated all “defense-related spending” for both 2017 and 2018, and it hit nearly $1.1 trillion for each of the two years. The “defense-related” part is important because the annual National Defense Authorization Act, a.k.a. the defense budget, doesn’t fully account for all the various forms of national security spending that gets peppered around a half-dozen agencies.


It’s a phenomenon that noted Pentagon watchdog William Hartung has tracked for years. He recently dissected it into “no less than 10 categories of national security spending.” Amazingly only one of those is the actual Pentagon budget. The others include spending on wars, on homeland security, on military aid, on intelligence, on nukes, on recruitment, on veterans, on interest payments and on “other defense” — which includes “a number of flows of defense-related funding that go to agencies other than the Pentagon.”


Perhaps most amazingly, Hartung noted in TomDisptach that the inflation-adjusted “base” defense budgets of the last couple years is “higher than at the height of President Ronald Reagan’s massive buildup of the 1980s and is now nearing the post-World War II funding peak.” And that’s just the “base” budget, meaning the roughly $600 billion “defense-only” portion of the overall package. Like POGO, Hartung puts an annual price tag of nearly $1.1 trillion on the whole enchilada of military-related spending.


The MIC’s ‘Swamp Creatures’


To secure their share of this grandiloquent banquet, the defense industry’s lobbyists stampede Capitol Hill like well-heeled wildebeest, each jockeying for a plum position at the trough. This year, a robust collection of 208 defense companies spent $93,937,493 to deploy 728 “reported” lobbyists (apparently some go unreported) to feed this year’s trumped-up, $700 billion defense-only budget, according to OpenSecrets.org. Last year they spent $128,845,198 to secure their profitable pieces of the government pie.


The Pentagon, headquarters of the U.S. Defense Department, as viewed with the Potomac River and Washington, D.C., in the background. (Defense Department photo)


And this reliable yearly harvest, along with the revolving doors connecting defense contractors with Capitol Hill, K Street and the Pentagon, is why so many critics blame the masters of war behind the MIC for turning war into a cash machine.


But the cash machine is not confined to the Beltway. There are ATM branches around the country. Much in the way it lavishes Congress with lobbying largesse, the defense industry works hand-in-glove with the Pentagon to spread the appropriations around the nation. This “spread the wealth” strategy may be equally as important as the “inside the Beltway” lobbying that garners so much of our attention and disdain.


Just go to U.S. Department of Defense’s contract announcement webpage on any weekday to get a good sense of the “contracts valued at $7 million or more” that are “announced each business day at 5 p.m.” A recent survey of these “awards” found the usual suspects like Raytheon, Lockheed Martin and General Dynamics. The MIC was well-represented. But many millions of dollars were also “won” by companies most Americans have never heard of … like this sampling from one day at the end of October:


  • Longbow LLC, Orlando Florida, got $183,474,414 for radar electronic units with the stipulation that work will be performed in Orlando, Florida.

  • Gradkell Systems Inc., Huntsville, Alabama, got $75,000,000 for systems operations and maintenance at Fort Belvoir, Virginia

  • Dawson Federal Inc., San Antonio, Texas; and A&H-Ambica JV LLC, Livonia, Michigan; and Frontier Services Inc., Kansas City, Missouri, will share a $45,000,000 for repair and alternations for land ports of entry in North Dakota and Minnesota.

  • TRAX International Corp., Las Vegas, Nevada, got a $9,203,652 contract modification for non-personal test support services that will be performed in Yuma, Arizona, and Fort Greely, Alaska,

  • Railroad Construction Co. Inc., Paterson, New Jersey, got a $9,344,963 contract modification for base operations support services to be performed in Colts Neck, New Jersey.

  • Belleville Shoe Co., Belleville, Illinois, got $63,973,889 for hot-weather combat boots that will be made in Illinois.

  • American Apparel Inc., Selma, Alabama, got $48,411,186 for combat utility uniforms that will be made in Alabama.

  • National Industries for the Blind, Alexandria, Virginia, got a $12,884,595 contract modification to make and advanced combat helmet pad suspension system. The “locations of performance” are Virginia, Pennsylvania and North Carolina.

Sharing the Largesse


Clearly, the DoD is large enough, and smart enough, to award contracts to companies throughout the 50 states. Yes, it is a function of the sheer size or, more forebodingly, the utter “pervasiveness” of the military in American life. But it is also a strategy. And it’s a tactic readily apparent in a contract recently awarded to Raytheon.


On Oct. 31, 2017, they got a $29,455,672 contract modification for missions systems equipment; computing environment hardware; and software research, test and development. The modification stipulates that the work will spread around the country to “Portsmouth, Rhode Island (46 percent); Tewksbury, Massachusetts (36 percent); Marlboro, Massachusetts (6 percent); Port Hueneme, California (5 percent); San Diego, California (4 percent); and Bath, Maine (3 percent).”


Frankly, it’s a brilliant move that began in the Cold War. The more Congressional districts that got defense dollars, the more votes the defense budget was likely to receive on Capitol Hill. Over time, it evolved into its own underlying rationale for the budget.


As veteran journalist William Greider wrote in the Aug. 16, 1984 issue of Rolling Stone, “The entire political system, including liberals as well as conservatives, is held hostage by the politics of defense spending. Even the most well intentioned are captive to it. And this is a fundamental reason why the Pentagon budget is irrationally bloated and why America is mobilizing for war in a time of peace.”


The peace-time mobilization Greider referred to was the Reagan build-up that, as William Hartung noted, is currently being surpassed by America’s “War on Terror” binge. Then, as now … the US was at peace at home, meddling around the world and running up a huge bill in the process. And then, as now … the spending seems unstoppable.


And as an unnamed “arms-control lobbyist” told Grieder, “It’s a fact of life. I don’t see how you can ask members of Congress to vote against their own districts. If I were a member of Congress, I might vote that way, too.”


Essentially, members of Congress act as secondary lobbyists for the defense industry by making sure their constituents have a vested interest in seeing the defense budget is both robust and untouchable. But they are not alone. Because the states also reap what the Pentagon sows … and, in the wake of the massive post-9/11 splurge, they’ve begun quantifying the impact of defense spending on their economies. It helps them make their specific case for keeping the spigot open.


Enter the National Conference of State Legislatures (NCSL), which notes, or touts, that the Department of Defense (DoD) “operates more than 420 military installations in the 50 states, the District of Columbia, Guam and Puerto Rico.” Additionally, the NCSL is understandably impressed by a DoD analysis that found the department’s “$408 billion on payroll and contracts in Fiscal Year 2015” translated into “approximately 2.3 percent of U.S. gross domestic product (GDP).”


And they’ve become a clearinghouse for state governments’ economic impact studies of defense spending. Here’s a sampling of recent data compiled on the NSCL website:


  • In 2015, for example, military installations in North Carolinasupported 578,000 jobs, $34 billion in personal income and $66 billion in gross state product. This amounts to roughly 10 percent of the state’s overall economy.

  • In 2014, Coloradolawmakers appropriated $300,000 in state funds to examine the comprehensive value of military activities across the state’s seven major installations. The state Department of Military and Veterans Affairs released its study in May 2015, reporting a total economic impact of $27 billion.

  • Kentuckyhas also taken steps to measure military activity, releasing its fifth study in June 2016. The military spent approximately $12 billion in Kentucky during 2014-15. With 38,700 active duty and civilian employees, military employment exceeds the next largest state employer by more than 21,000 jobs.

  • In Michigan, for example, defense spending in Fiscal Year 2014 supported 105,000 jobs, added more than $9 billion in gross state product and created nearly $10 billion in personal income. A 2016 study sponsored by the Michigan Defense Center presents a statewide strategy to preserve Army and Air National Guard facilities following a future Base Realignment and Closure (BRAC) round as well as to attract new missions. 

Electoral Impact


But that’s not all. According to the DoD study cited above, the biggest recipients of DoD dollars are (in order): Virginia, California, Texas, Maryland and Florida. And among the top 18 host states for military bases, electorally important states like California, Florida and Texas lead the nation.


President Trump speaking at a Cabinet meeting on Nov. 1, 2017, with Secretary of State Rex Tillerson to Trump’s right and son-in-law Jared Kushner seated in the background. (Screen shot from whitehouse.gov)


And that’s the real rub … this has an electoral impact. Because the constituency for defense spending isn’t just the 1 percent percent of Americans who actively serve in the military or 7 percent of Americans who’ve served sometime in their lives, but it is also the millions of Americans who directly or indirectly make a living off of the “defense-related” largesse that passes through the Pentagon like grass through a goose.


It’s a dirty little secret that Donald Trump exploited throughout the 2016 presidential campaign. Somehow, he was able to criticize wasting money on foreign wars and the neoconservative interventionism of the Bushes, the neoliberal interventionism of Hillary Clinton, and, at the same time, moan endlessly about the “depleted” military despite “years of record-high spending.” He went on to promise a massive increase in the defense budget, a massive increase in naval construction and a huge nuclear arsenal.


And, much to the approval of many Americans, he’s delivered. A Morning Consult/Politico poll showed increased defense spending was the most popular among a variety of spending priorities presented to voters … even as voters express trepidation about the coming of another war. A pair of NBC News/Survey Monkey polls found that 76 percent of Americans are “worried” the United States “will become engaged in a major war in the next four years” and only 25 percent want America to become “more active” in world affairs.


More to the point, only 20 percent of Americans wanted to increase the troop level in Afghanistan after Trump’s stay-the-course speech in August, but Gallup’s three decade-long tracking poll found that the belief the U.S. spends “too little” on defense is at its highest point (37 percent) since it spiked after 9/11 (41 percent). The previous highpoint was 51 percent in 1981 when Ronald Reagan was elected in no small part on the promise of a major build-up.


So, if Americans generally don’t support wars or engagement in the world, why do they seem to reflexively support massive military budgets?


Frankly, look no further than Trump’s mantra of “jobs, jobs, jobs.” He says it when he lords over the sale of weapon systems to foreign powers or he visits a naval shipyard or goes to one of his post-election rallies to proclaim to “We’re building up our military like never before.” Frankly, he’s giving the people what they want. Although they may be war-weary, they’ve not tired of the dispersal system that Greider wrote about during Reagan’s big spree.


Ultimately, it means that the dreaded Military-Industrial Complex isn’t just a shadowy cabal manipulating policies against the will of the American people. Nor is the “racket” exclusive to an elite group of Deep State swamp things. Instead, the military and the vast economic network it feeds presents a far more “complex” issue that involves millions of self-interested Americans in much the way Eisenhower predicted, but few are willing to truly forsake.


Sunday, December 3, 2017

Iceland"s New Government Has Cunning Plan Of Tapping Banks To Boost Growth, Improve Infrastructure

We like Iceland, we’ve never been there, but that doesn’t matter. Besides the outstanding natural beauty, Iceland, unlike the US, UK and practically everywhere else, holds bankers accountable. Last time we checked, 29 had been jailed. As we discussed, it also holds its leaders accountable (partially – see below) when they are complicit in exonerating convicted child rapists. Such an event brought down Iceland’s government in September.


Last week, it emerged that Prime Minister Bjarni Benediktsson knew of attempts by his father, Benedikt Sveinsson, to have the Ministry of Justice grant “restored honor” to a convicted child rapist. Benediktsson kept this secret as the rapist, a friend of his father’s was essentially exonerated.


Restored honor is the controversial process by which convicted criminals can have their crimes expunged and return to society with all rights and privileges restored. It requires that the convicted person serve between two to five years of their sentence on their best behavior and that they have multiple letters of recommendation. Sveinsson provided one such letter.


Iceland held new elections on 28 October 2017 and a new coalition government came in to power this week. Iceland’s economy has been booming, in part due to the influx of tourists visiting its thriving capital city, Reykjavik, along with the Geysir geyser and the Gullfoss waterfalls. On any given day, tourists are likely to account for about 10% of the island’s population. However, as the FT explains, Iceland is paying a price for its success.


These challenges include everything from the poor quality roads and overburdened infrastructure to a lack of accommodation and simmering popular discontent over how tourism is being handled. At Geysir and Gullfoss in central Iceland, dozens of buses and cars park at both attractions for free before disgorging tourists who pay no entrance fee. The roads across Iceland are under intense strain from hire cars and a tourist died just after Christmas in a head-on collision on a single-track bridge.


“What are we sacrificing when we don’t put a levy on tourists? The roads here are dangerous,” says Asta Helgadottir, an MP for the anti-establishment Pirate party…Accommodation is also a problem. Cranes everywhere in Reykjavik attest to the surge in hotel construction but the increase in rooms still lags behind the growth in tourism.


However, all is not lost. The new government has a plan…which involves Iceland’s banks and tapping their excess capital. According to Bloomberg.


Iceland’s new left-right coalition government is gearing up for a spending drive to fix the nation’s dilapidated infrastructure after years of austerity and it could tap its banks for the some of needed cash.


Iceland got a new government on Thursday, in a coalition between the Left Greens, the Progressive Party and the conservative Independence Party. The parties have pledged to spend more on roads and other infrastructure to catch up on an estimated 400 billion kronur ($3.9 billion) in missing investments.


Even in Iceland, it seems, discredited politicians can bounce back into public life almost immediately, which is precisely what’s happened in the case of Bjarni Benediktsson, usually known as “Bjarni Ben”.


Bloomberg spoke to the man himself, “According to Finance Minister Bjarni Benediktsson the government has an ace in the hole that can help finance the spending: the excess equity in its three largest banks, Arion Bank hf, Landsbankinn hf and Islandsbanki hf. The banks have leverage ratios in the 16 percent to 18 percent range at the end of June, far above the 3 percent minimum, according to Iceland’s central bank.


“We have hundreds of billions of kronur, way more than any other European nation, tied up in financial institutions,” said Benediktsson, a former prime minister who will now take over at the Finance Ministry, in an interview on Thursday “And we in the three parties are ready to shake loose this capital to use it toward an infrastructure build up.”


With a plan like that, the government must have considerable leverage over Iceland’s major banks...and it does.


The government owns most of Landsbankinn and all of Islandsbanki and has a stake in Arion. The banking assets were acquired after the 2008 collapse when the government stepped in to save the financial industry. The crisis is now largely in the rear-view mirror and the new government is being handed a booming economy.


The government will now put together a white paper on the financial system and have a broad discussion in parliament.


We hadn’t fully appreciated how rapidly Iceland’s economy has been growing - last year it grew faster than China (6.7%) and even faster than India (7.1%). However, the growth rate is declining rapidly, so the coalition government’s plan might be timely, if it can be executed.


There are signs that the economy may be cooling after growing at a whopping 7.4 percent last year. Economist surveyed by Bloomberg are forecasting gross domestic product growth at 4.2 percent this year, while the central bank recently lowered its forecast for 2018 to 3.4 percent from 5.5 percent.


Despite the differing left-right ideologies in the new coalition government, Bjarni Ben and the new prime minister are cautiously confident, especially the former.


Internally, the government may find it hard to reconcile the policies of its two biggest party’s, the Left Greens and the Independence Party. But both party leaders on Thursday insisted they would make it work.


“The outer circumstances are working in our favor in forming this government,” Benediktsson. “We are the European nation that is growing at one of the fastest rates — we have no unemployment in Iceland to speak of, we have a budget surplus since 2014 and forecasts predict continuing growth, a great increase in tourism next year.”


Taking over as prime minister will be Left Green leader Katrin Jakobsdottir, the first time the party holds the top spot after emerging as the second biggest group in October’s election. While she faced some internal party turmoil for joining with the Conservatives, she is now “optimistic but realistic” that she can make it work.


Having cratered the economy during the crisis, it would be poetic justice if the major Icelandic banks were its saviour as we head towards the next one.


Wednesday, November 29, 2017

What Americans Spent The Most Money On In The Third Quarter

One month ago, when the BEA released its first estimate of the hurricane-impacted economy during the third quarter (which came in at a stronger than expected 3.0%)  we were surprised to report that according to the Department of Commerce, in the third quarter the biggest driver of marginal spending was car sales (technically Motor Vehicles and Parts), which increased by $15.6 billion to $463.5 billion. Which, as we said at the time and considering recent US and global automakers data, was paradoxical in light of the ongoing decline in overall sales in the second half of 2017, and it was far too early to expect the post-hurricane spending spree. It was also surprising because as Americans splurged on cars, they pulled back on gasoline purchases, which was the single biggest detractor to spending, subtracting a marginal $3.5 billion in PCE, to $283.6 billion.


In any case, we concluded by saying that "we now await for the revisions to this initial estimate over the coming two months, because something tells us that the auto spending spree will be thoroughly revised well lower."


One month later, when the BEA released its second Q3 GDP estimate, it appears we were right: the contribution from motor vehicles was indeed revised lower, but not nearly as dramatically as we expected, only from a marginal increase of $15.6 million to $13.5 million.


And yet, many other line items did see a downward revision, which means that something had to increase sharply to compensate for the downward revisions among other spending components. Sure enough, something did: the old faithful "plug" which has saved the US economy every quarter for the past 4 years: Healthcare, or as it is better known, Obamacare, because with Trump failing to repeal Obama"s signature health law, it means that Healthcare will merrily "contribute to GDP" for years to come, by being the single biggest marginal spending item for the foreseeable future.


Finally, for a comparison of how dramatically the contribution of "Healthcare" was revised higher, here is a chart showing side by side the change in spending among all key line items. One can almost hear the orders "from above" to make GDP 3% or higher at any cost when looking at this chart.


Tuesday, November 28, 2017

As Australia"s Housing Bubble Bursts, Optimism For The Year Ahead Crashes To Record Low

Zero Hedge readers might have noted our increasingly bearish tone on all things Australian – economic that is, since the cricket team just whipped the English in the first test match in Brisbane. The focal point of our concern is the housing market and, earlier this month, we discussed how the world’s longest-running bull market – 55 years – in Australian house prices appears to have come to an end. We followed this up with “Why Australia’s Economy Is A House Of Cards” in which Matt Barrie and Craig Tindale described how Australia’s three decades long economic expansion had mostly been the result of “dumb luck”.


As a whole, the Australian economy has grown through a property bubble inflating on top of a mining bubble, built on top of a commodities bubble, driven by a China bubble.


Last week, in "The Party"s Over For Australia"s $5.6 Trillion Housing Market Frenzy", we highlighted some scary metrics for Australia’s housing bubble cited by Bloomberg. In particular, we showed how the value of Australian housing is more than four times gross domestic product. This is higher than other western nations, like New Zealand, Canada and the UK, which are experiencing their own housing bubbles. The ratio of house values to GDP in the US seems positively tame in comparison.


It seems that it’s nor just us and other market commentators who are becoming progressively more pessimistic on Australia’s outlook. Australians are coming round to the same opinion, as Australia"s Domain.com explains (note: Roy Morgan is an Australian market research company).


The number of Australians optimistic about the year ahead has dropped to a never-before-seen low as mortgage holders eye a combination of record-high household debt and the possibility of interest rate hikes in 2018.


According to a Roy Morgan survey taken in mid-November, 31 per cent of people think 2018 will be “better” than 2017 – the lowest figure recorded since the survey began in 1980.


Along with a slide in positivity, the survey showed a spike in active negativity, with 30 per cent expecting next year to be “worse” than 2017 and 39 per cent saying it will be “the same”. Younger Australians are more positive than older generations, with almost half (46%) of 18-24-year-olds expecting next year to be better, while just 20 per cent of over 65s feel that way. In fact, a noticeable drop in optimism can be seen as Australians age.


AMP notes that the greater level of optimism among younger Australian’s is probably due to them being saddled with less debt.  Their older countrymen are becoming fearful that a rise in interest rates could lead to a housing crash.


“(Older Australians) have the debt,” AMP Capital chief economist and head of investment strategy Shane Oliver told Domain. “There’s a growing problem in Australia where a lot of people might own their home by the time they’re 65 but they still have a lot more debt than previous generations.


“If you were going to worry about a property price collapse, you wouldn’t be as worried about it if you were a younger Australian – they might actually see an opportunity. If you’re an older Australian with a lot of debt it might be more of a worry for you.” Households are sitting on record high debt, above 190 per cent of income, which is why talk of interest rate hikes have been hitting confidence.


While the Australian central bank sees a rate hike as unlikely in the “near-term”, Domain.com notes that the next move is likely to be up.


Reserve Bank governor Philip Lowe reiterated last week he sees the next move from the central bank as being upwards, and while most economists expect those hikes in late 2018 or even 2019, ANZ is hanging onto its call that two rate hikes await next year.


While Australian citizens are the second most-indebted in the world, the country’s banks are the most exposed to housing debt.


They are also potentially in the firing line for a government enquiry as AMP’s Shane Oliver tells Domain.com.


Meanwhile, confidence in the institutions to which Australians are so deeply indebted has scarcely been lower, with scandals and the threat of a royal commission a part of the landscape.


“The bank questions seem to keep coming – it seems to have a life of its own,” Dr Oliver said. “This idea of the royal commission or commission of inquiry… putting aside the should we or shouldn’t we… that constant talk that there’s some sort of problem with the banks is probably affecting people as well.”


This was Australia’s ABC News earlier today.


The calls for a full inquiry have been relentless for years, emanating from a broad section of the community — from farmers, small business and households, jaded and disillusioned with the industry"s rampant profiteering, fee gouging and blatant disregard for the law. How many times can a Commonwealth Bank chairman sincerely apologise for a yet another breach of trust? What, pray tell, will be the cause of next year"s?


But the overwhelming reason for an inquiry rests on just one principle — accountability. What has been forgotten in the endless round of scandals in recent years is that the Australian banking sector is a taxpayer subsidised industry. It"s an industry that pays ridiculously bloated salaries to its leaders; that showers itself with massive bonus payments when profits are soaring but instantly demands taxpayer protection and support when the tide turns.


Having resolutely opposed a formal enquiry, the Australian government may have its hand forced as Liberal National Party Senator, Barry Sullivan, is threatening a to put a motion to the senate, possibly as early as this week. This might undermine confidence in Prime minister, Malcolm Turnbull. Furthermore, as ABC News notes, the banks have also taken the usual, and likely misguided step, of appealing to their biggest critics.


Senior Coalition members are terrified, having been forced for so long to walk the tightrope between hauling bankers into line and staunchly opposing an inquiry. If the motion gets up, it would be a major loss of face for Mr Turnbull and the Government, with serious ramifications for his grip on leadership.


In a show of desperation, the banks have opted to go straight to the public, the area where they possibly have the least support, with a multi-million dollar propaganda campaign on free to air television and newspapers. And the fight is likely to get ugly.


With pessimism on the part of Australian public already at record low levels, we suspect that a messy political confrontation between politicians and the banking sector could only be an additional negative for the popping of Australia’s housing bubble. AMP’s Shane Oliver is not optimistic, as Bloomberg notes.


And the general sense of “malaise” could be here to stay, according to Shane Oliver.


“It seems the old days of ‘she’ll be right, mate died off with the Holden Ute,” he said.


For those unfamiliar with the Australian vernacular, a Holden Ute is an iconic pick-up truck. Sales hit record lows last year and the Adelaide manufacturing plant is being shut at the end of this year.


Saturday, November 25, 2017

The Party"s Over For Australia"s $5.6 Trillion Housing Frenzy

Early this month, we discussed whether the world’s longest running bull market – 55 years – in Australian house prices had come to an end. This was UBS’s view following the October 2017 monthly report on Australian house prices from CoreLogic suggested that measures to tighten credit standards and dissuade overseas buyers (especially Chinese in Sydney and Melbourne) have finally begun to bite. As CoreLogic’s summary table shows, Sydney prices fell in October, for the second month running, and poised to lead national prices lower.


We followed up that discussion with “Why Australia’s Economy Is A House Of Cards” in which Matt Barrie and Craig Tindale described how Australia’s three decades long economic expansion had mostly been the result of “dumb luck”.


As a whole, the Australian economy has grown through a property bubble inflating on top of a mining bubble, built on top of a commodities bubble, driven by a China bubble.


Now Bloomberg has followed UBS in calling the end of the bull market, while showing some of the frankly scary metrics for Australian housing versus the country’s GDP.


The party is finally winding down for Australia’s housing market. How severe the hangover is will determine the economy’s fate for years to come. After five years of surging prices, the market value of the nation’s homes has ballooned to A$7.3 trillion ($5.6 trillion) -- or more than four times gross domestic product. Not even the U.S. and U.K. markets achieved such heights at their peaks a decade ago before prices spiraled lower and dragged their economies with them.


Australia’s obsession with property is firmly entrenched in the nation’s economy and psyche, fueled by record-low interest rates, generous tax breaks, banks hooked on mortgage lending, and prime-time TV shows where home renovators are lauded like sporting heroes. For many, homes morphed into cash machines to finance loans for boats, cars and investment properties. The upshot: households are now twice as indebted as China’s.


One thing which should slow Australian property prices on the way down is that the Governor of the Reserve Bank of Australia (RBA), Philip Lowe, is still in no rush to raise rates. However, his hands are tied…and he knows it…as Australia’s New Daily reported.


“In striking the appropriate balance in our policy setting we have paid close attention to trends in household borrowing given the already high levels of debt.”


Over the past four years, household borrowing has increased at an average rate of 6.5 per cent while household income has increased at an average rate of just 3.5 per cent, he said. An area of particular concern for Dr Lowe is the slow growth in household incomes. Over the past four years, nominal average hourly earnings have grown at the slowest rate in “many decades”.


“This means that borrowers haven’t been able to rely on rising incomes to reduce the real value of the debt repayments in the way they used to,” he said.


Here’s Bloomberg on the same theme.


Aussie households have racked up record private debts and aren’t getting the pay rises to help service them. That’s a core concern for the RBA and frequently cited as a deterrent for hiking interest rates. Macquarie Bank has said such debt levels mean any hikes will have triple the impact on consumers than tightening cycles in the mid-1990s. With retail sales looking grim and wage growth near record lows, debt will likely vex policy makers for years.


Of course, as Bloomberg notes, the RBA is pointing out the resilience of the Australian financial system should it be hit by any shocks...somewhat reminiscent of Ben Bernanke prior to the sub-prime crisis.


So far, the Reserve Bank of Australia has relied on banking regulators to apply the brakes with lending curbs. It reckons the financial system is well-placed to withstand any shocks, but isn’t so confident on consumers.


The banks didn’t fare so well in the 2008 crisis, nor will they in an Australian housing crisis. Bloomberg continues.


On one hand, the dizzy valuations reflect a desirable location and strong population growth. But they also reflect the massive liabilities that are now tied to these assets. “The risk is that it leaves the Australian economy extremely exposed, and a minor shock could become far more significant,” said Daniel Blake, an economist at Morgan Stanley in Sydney.


The increasing treatment of housing as a financial commodity has seen borrowers rush into a byzantine maze of mortgage-related products. That’s made banks very profitable, but very exposed. While the RBA is satisfied that lenders have adequate buffers to cope with any downturn, banks may find it harder to value their collateral in a falling market as investors look to consolidate their portfolios of multiple homes, said Blake.


Meantime, aside from tighter lending standards and fewer overseas buyers, the major Australian cities are poised to see a wave of new supply, especially apartments – as this chart shows.


As you’d expect, even that is not something that will change the rhetoric from the central bank, as Bloomberg notes.


While cranes dot the Sydney skyline for miles, the central bank remains confident that population growth will eventually fill all those new apartments. Its worries about a Melbourne glut have eased off recently, with the main concern in the Brisbane market, where peak completion is expected this year, capping a three-year period in which the number of apartments has increased by more than a third. Overseas buyers comprise up to 15 percent of new dwelling purchases nationwide, according to the RBA.


Having called the end of Australia’s housing boom, UBS notes.


“The cooling may be happening a bit more quickly than even we expected.”


Monday, November 13, 2017

FX Weekly Preview: Is The USD Correction Done Yet?

Submitted by Shant Movsesian and Rajan Dhall MSTA of fxdailyterminal.com


USD correction done yet?


After a number of weeks of painfully tight ranges, there is little on the horizon which looks potent enough to warrant a break out.  Has the apathy in global stocks spread into FX? It looks like it, especially when looking at the carry trade.  Watching USD/JPY has been nothing short of tortuous as we currently remain hemmed into a 113.00-115.00 range.  We have been getting used to watching EUR/USD as the benchmark rate to spark off fresh activity across the currency spectrum, but despite the open "ended-ness" of the APP come Jan 2018, the pair is now in a fresh stalemate as bids in the mid 1.1500"s have only served to limit the correction which was so evidently needed once we had reached the first objective at 1.2000.  For USD/JPY, the market is pinning hopes for tax reform to take off, but the chinks are starting to show again with the corporate rate tax cut to 20% set to be delayed until 2019.  As we saw in the aftermath of president Trump"s victory, there seems to be little concern over how these tax cuts are going to be paid for and perhaps move significantly greater concern as to how much they will add to GDP if/when implemented.


Scepticism set in earlier this year once we had pushed above the 116.00 mark, and while the extension stretched into the 118.00"s, calls for 120.00 soon fell flat.  After the move down into the 107.00"s, we have since moved back into the upper end of the 2017 range, but still looking for a move above 115.00.  There was little data to feed off in the US last week, but we have inflation and consumer data in the week ahead which will shed more light on whether the USD run is truly exhausted or not.  Little correlation with rates at the moment, with the 10yr US benchmark backing off 2.50% in recent weeks, but to little effect, but 2.30% has held since then.  


In Europe, as the turmoil in Spain calms down, divisions inside the ECB flare up again, with Germany calling for firmer guidance towards signalling an end to QE.  President Draghi and a number of his fellow members are keen to keep the Euro recovery from fizzling out, so keeping the APP open ended at this stage offers them room for manoeuvre as well as containing another impulsive EUR rally.  On the latter, they have succeeded, but in the mid 1.1500"s, strong buying last week underlined the focus on a longer term recovery.  Little prospect of a surge back up to 1.2000 at this stage, but that is partly down to the USD.  


All the big names from the ECB are due to speak next week - again - but in the steady flow of rhetoric nothing will impact the near term consolidation in the EUR other than a firmer commitment towards and "end date".  Inflation is tailing off again as we are expected to see in the final Oct reading on Thursday, but on Tuesday we get the second reading on Q3 GDP which will need to stick at 0.6% at the very least to underpin the tentative hold in the single currency.  Flash GDP in Germany also out, and mixed readings in factory orders could seen this slip back towards 2.0% annualised.  Italy is closer to 1.5%, but Portugal and Holland are over 3% for comparison, but all from a lower base remember. 


It will be an interesting start to the week for the Pound, as we wait to see how the market reacts to news that around 40 MPs are ready to sign a letter of no confidence in Theresa May.  The PM is really struggling to get a break at the moment, in a government which we should not forget, still hasn"t got majority.  As if fending off the hard Brexiteers and the "remainers", is not hard enough when negotiating exit from the EU, recent departures from her cabinet and constant in-fighting makes here position untenable by the day, and this will continue to weigh on GBP, if not, then when we push on to higher levels, which we did at the end of last week.  


The Brexit talks offered nothing now, indeed perhaps more to be concerned about as Michel Barnier effectively gave the UK a few more weeks to commit to the divorce bill which some papers have suggested will be raised in order to get progress onto the next stage of trade talks.  Optimistic or opportunistic, the longer the EU talks, the more business investment will suffer, so arguments for buying GBP at these levels based on valuation lose credibility by the day.  Were Cable down at 1.2000 or 1.2500, this would carry more weight, but inside 1.3000-1.3500, buyers must be looking for 1.4000+ at the very least, and few can justify that with the rate perspective also dashed after the previous week"s dovish hike by the BoE.  


EUR/GBP is more likely to be range bound in the meantime, but we have continued to test sub 0.8800 with little progress, but 0.9000+ is equally lethargic at this stage.  


Plenty of data though next week, with the latest inflation print on Tuesday, employment on Wednesday and retail sales on Thursday.  Notable are some of the concerns over the UK high street at the moment.  CPI above 3.0% is expected, but the BoE believe it will top out at 3.2% - lets see.  


In Australia, rising employment has been the economic saviour which keeps the hopes of wage inflation alive - as it has in the US.  We get the Oct report on Thursday.  Despite the strong gains in industrial metals price, the AUD has been clearly faltering in recent weeks, and we are not convinced that 0.7600-25 is the low just yet.  What happens when commodity prices adjust, or if the Chinese data fades again?  If the AUD cannot recover at this time, then we cannot rule out a move on 0.7500 just yet, with the market focusing on softer inflation which has seen the yearly rate slip below the 2-3% RBA range, and set to fall further after the CPI re-weighting. 


Industrial production in China is due out on Thursday, but the yoy rate is currently above 6.0%, so expectations for a drop off from 6.6% to 6.3% will likely be dismissed at this stage.  


Nothing of note for NZ however, so focus here will be on any fresh policy announcements from the new government.  RBNZ mandate reform is set to bring full employment into policy considerations, but as we have seen in the Q3 numbers, job gains are moving the right way, so any dovish implications will be held back for now. Indeed, last week"s RBNZ statement was pretty positive on the outlook, with NZD softness of late also welcome.   0.7000 capping the NZD/USD rate for now though, and as with the AUD/USD rate, the base at 0.6815-20 does not fill us with confidence as yet.  


In Canada, we have to wait until Friday to get any top tier data, which will be Oct CPI.  BoC gov Poloz was focusing on this last week, in what looked to be another turnaround in policy sentiment, focusing on the inflationary impact of reaching full capacity and output.  The central bank have done well to contain the rate pricing euphoria which took the 10yr rate up to 2.20%, and USD/CAD down into the mid 1.200"s, but with long end rates back below 2.00% and the spot rate back under 1.2700, the gov can afford to be a little more neutral.  1.2500-1.2700 looks to be fair value in the meantime, so expect to see rallies above 1.2900 sold into (if we test back here again) as we have seen from late Oct.  


For Norway we have Q3 GDP next week, while in Sweden it is inflation time also, but NOK/SEK is starting to threaten the upside again, which is not unsurprising given where Brent Oil is trading at the moment.   EUR rates look more congested at the present time, but looking at the weekly spot charts, we can see further USD progress has been rejected for now.   


Sunday, November 12, 2017

How Economics Failed The Economy

Authored by Umair Haque via Eudaimonia blog,


When, in the 1930s, the great economist Simon Kuznets created GDP, he deliberately left two industries out of this then novel, revolutionary idea of a “national income”: finance and advertising.


Don’t worry, this essay isn’t going to be a jeremiad against them, that would be too easy, and too shallow, but that is where the story of how modern economics failed the economy? - ?and how to understand how to undo it? - ?should begin.


Kuznets’ logic was simple, and it was not mere opinion, but analytical fact: finance and advertising don’t create new value, they only allocate, or distribute existing value? - ?in the same way that a loan to buy a television isn’t the television, or an ad for healthcare isn’t healthcare. They are only means to goods, not goods themselves.


Now we come to two tragedies of history.


What happened next is that Congress laughed, as Congresses do, ignored Kuznets, and included advertising and finance anywaysfor political reasons? - ?after all, bigger, to the politicians’ mind, has always been better, and therefore, a bigger national income must have been better. Right? Let’s think about it.


Today, something very curious has taken place.


If we do what Kuznets originally suggested, and subtract finance and advertising from GDP, what does that picture? - a picture of the economy as it actually is? - ?reveal? Well, since the lion’s share of growth, more than 50% every year, comes from finance and advertising? - whether via Facebook or Google or Wall St and hedge funds and so on? - ?we would immediately see that the economic “growth” that the US has chased so desperately, so furiously, never actually existed at all.


Growth itself has only been an illusion, a trick of numbers, generated by including what should have been left out in the first place. If we subtracted allocative industries from GDP, we’d see that economic growth is in fact below population growth, and has been for a very long time now, probably since the 1980s -  and in that way, the US economy has been stagnant, which is (surprise) what everyday life feels like.


Feels like. Economic indicators do not anymore tell us a realistic, worthwhile, and accurate story about the truth of the economy, and they never did?—?only, for a while, the trick convinced us that reality wasn’t. Today, that trick is over, and economies “grow”, but people’s lives, their well-being, incomes, and wealth, do not, and that, of course, is why extremism is sweeping the globe. Perhaps now you begin to see why the two have grown divorced from one another: economics failed the economy.


Now let us go one step, then two steps, further. Finance and advertising are no longer merely allocative industries today. They are now extractive industries. That is, they internalize value from society, and shift costs onto society, all the while, creating no value themselves. The story is easiest to understand via Facebook’s example: it makes its users sadder, lonelier, and unhappier, and also corrodes democracy in spectacular and catastrophic ways. There is not a single upside of any kind that is discernible? - ?and yet, all the above is counted as a benefit, not a cost, in national income, so the economy can thus grow, even while a society of miserable people are being manipulated by foreign actors into destroying their own democracy. Pretty neat, huh?


It was because finance and advertising were counted as creative, productive, when they were only allocative, distributive that they soon became extractive. After all, if we had said from the beginning that these industries do not count, perhaps they would not have needed to maximize profits (or for VCs to pour money into them, and so on) endlessly to count more. But we didn’t. And so soon, they had no choice but to become extractive: chasing more and more profits, to juice up the illusion of growth, and soon enough, these industries began to eat the economy whole, because of course, as Kuznets observed, they allocate everything else in the economy, and therefore, they control it. Thus, the truly creative, productive, life-giving parts of the economy shrank in relative, and even in absolute terms, as they were taken apart, strip-mined, and consumed in order to feed the predatory parts of the economy, which do not expand human potential. The economy did eat itself, just as Marx had supposed? - ?only the reason was not something inherent in it, but a choice, a mistake, a tragedy.


Again, that is just a story? - ?so let us extract the key principle, which is the main mistake, the way in which economics failed the economy. Economics? - ?let me be careful here, and say American economics? - ?made the grave mistake of supposing that whatever could be traded should be traded, and then counted as a benefit, always, to the economy. But that is patently foolish. You and I can buy guns, and while guns might help a few people hunt for food, mostly, they only help people kill. One only has to take a cursory glance at America’s off-the-charts murder rates and killing sprees. And so the net cost of guns is life itself. What can be traded isn’t always what should be traded, and even less so should what should be traded be counted only and always as a pure benefit to the economy.


I have said that the US is, ironically, the new Soviet Union, its precise mirror image. Here you see what I mean in the purest and truest way. In the Soviet Union, trade of any kind was strictly forbidden, because it was seen to always be a bad, a liability, and therefore, only the government should allocate goods. American economics made precisely the mirror image of the same mistake: trade was alwaysassumed to always be a good, in nearly every possible circumstance and case (except those against which moral crusades were launched, like sex and drugs), and was and is always counted as a benefit, even when it shouldn’t be, just as in my tiny examples of finance and advertising (and therefore, only markets can allocate resources to society’s benefit).


Do you see how both are precise mirror images of one another? Here we have two forms of exactly the same kind of extremism: one assumes that trade is always bad, the other, that it is always good, but both assume, and assume similarly totalist positions. And in that way, economics went Soviet, and so now the West is trapped in an ideological bubble, just like the Soviet Union, caught fast like a helpless fly in a web of dead theories that fail utterly to explain its own decline and stagnation, and so mystified pundits and theorists prattle on, but nothing much seems to change, or even to be understood any better than it was last year, or the year before that, even though each year the toll of those very failures mounts and mounts.


Yet the truth is simply this. Reality, like life, is messier, subtler, more complicated than saying a thing is all good or all bad. To say that a thing is always good or bad is to commit the same error: to suppose that there is no room for negotiation, for investigation, for innovation, for this difficult project that we call society to need to be, to evolve, or to grow, at all. Society can only really exist when the boundaries of what is good and bad must constantly be renegotiated, rediscovered, reimagined, and understood anew. In precisely that way, the good in society grows, and the bad, perhaps, if not shrinks, then at least doesn’t grow along with the good. And that is how prosperity truly happens.


The good is only, to the limited extent that we can see it, for human are always blind, whether life is flourishing, growing, and developing, or not. Yet life expectancy is falling, people don’t expect the next generation to do better, there are regular mass killings, and so forth, in America. Life is not flourishing, growing, or developing in a single way that I or even you can readily identify or name. And yet, the economy appears to be growing, because purely allocative and distributive enterprises like Uber, Facebook, credit rating agencies, endless nameless hedge funds, shady personal info brokers, and so on, which fail to contribute positively to human life in any discernible way whatsoever, are all counted as beneficial. Do you see the absurdity of it?


And so. It’s not a coincidence that the good has failed to grow, nor is it an act of the gods. It was a choice. A simple cause-effect relationship, of a society tricking itself into desperately pretending it was growing, versus truly growing. Remember not subtracting finance and advertising from GDP, to create the illusion of growth? Had America not done that, then perhaps it might have had to work hard to find ways to genuinely, authentically, meaningfully grow, instead of taken the easy way out, only to end up stagnating today, and unable to really even figure out why yet.


And yet, perhaps, you and I can learn from that very mistake. In the societies, economics, corporations, cities, towns that we build tomorrow, we must learn to consider the good in more sophisticated, subtle, and most important of all, more authentic ways than we did yesterday. Economics failed the economy by telling us that everything that could be traded should be traded, since trade is always beneficial to humankind, even though even a child can see that people are fleeced and hoodwinked into buying every kind of foolish device, from guns to immortality potions, every day since time itself began. They are really buying the same thing: a salve for the desperation of lives that have gone nowhere.


If we really wish to help them, the answer is not simply assuming the problem away, as both the Soviet Union and then America, ironically, following in the footsteps of its mortal enemy, did, by saying any kind of human activity is all bad, or all good - for then we have done nothing more than pretended to solve a problem, which is the most foolish blindness of all. Problems that we have pretended to solve will only have the freest license of all to grow, just as advertising and finance, by being imagined to be productive when they were only allocative, soon turned extractive, being given free rein when they should have been if not reined in, then at least set to pasture. To genuinely stretch, become, develop, and grow is the same for economies as it is for lives as it is for societies, too: doing the difficult work of reckoning imperfectly with the good, and the bad, that dwell together, somehow, in each and every human heart.


Monday, October 30, 2017

The "Iron Coffin Lid": Why The Euphoric Surge In Japanese Stocks Is Coming To An End

Last week, Japan"s Nikkei 225 index enjoyed its longest winning streak in history which eventually ending after 16 consecutive days of gains, only to resume rising after a brief one day hiatus. And, as foreign investors once again flood the Japanese stock market, chasing the momentum which has pushed local stocks to levels not seen since 1996, the question on everyone"s lips is how much longer can this continue?


Offering a decidedly downbeat outlook on Japan"s market exuberance, Shannon McConaghy - portfolio manager at what we have in the past dubbed the world"s most bearish hedge fund, Horseman Capital Management - believes that the euphoria is about to end. The reason: the ominously sounding "Iron Coffin Lid."


In a note released late last week, McConaghy writes that there has been a lot of excitement over Japanese equities of late, with hyperbole from the sell-side, and others interested in promoting Japanese equities, becoming extreme. However, he cautions that "there is not a lot of discussion around the risks to Japanese equities from current elevated levels" and adds that "one observation I would make is that Japan has risen to these levels on a number of occasions over the last 25 years, only to fail spectacularly each time against what is referred to, by some in the Japan markets, as the “Iron Coffin Lid”. History suggests it is far better to be short Japanese equities from these levels than to be long."


So what is this Iron Coffin, why does it have a lid, and what happens next?


Below is a visualization of this "Iron Coffin Lid" effect: it shows the key resistance level in the Topix beyond which the index has failed to progress every time in the past quarter century.


There"s more than just a chart however: here is Horseman"s take on why this latest rally in Japanese stocks is also set for disappointment.


For those unwilling to outright short, I would point out that historically Japan has had meaningful underperformance following past bursts of outperformance. In these periods it is particularly appealing to short against longs in higher growth areas. Japan also provides amplified short returns during global down turns. As such it can be a low cost but high return hedge to risk-off impacting long positions elsewhere. One way to identify when Japan is about to provide its greatest periods of underperformance is when its market capitalisation exceeds its Gross Domestic Product (GDP). Again, on this measure history suggests it is far better to get short Japanese equities at current levels than to get long.


One way to think about Japan’s persistent underperformance is that past market rallies have been quickly frustrated by structurally weaker GDP growth, as opposed to other markets with more sustainable growth. Japan’s GDP only grew +1.7% over the last 10 years, a CAGR of +0.169%. It grew even less in the 10 years prior. It is no mere coincidence that the market has failed to break out during decades of weak economic activity. Once again the market is pricing in significant economic expansion to come in Japan but its demographics, the key reason for past structural weakness, are only getting worse. I expect the euphoric hope held by many in the market, that “this time is different” in Japan, will once again be crushed by the “Iron Coffin Lid” that is Japan’s structurally weak economy. Long positions in Japan will likely be buried alive again while short opportunities thrive. Yes, Japan’s GDP growth rate has been higher since 2012, during what I would consider a recovery phase. But the drivers of growth in the three largest components of GDP growth are unsustainable, exhausted and now showing clear signs of reversing. Our market views to be released over coming days will look into these three major components of recent GDP growth in more detail.


Originating from Horseman Capital, hardly known for its optimistic outlook, here is the fund"s take on why Japan is set for more pain once the current euphoria fades, and how to capitalize on this imminent decline:


As a short preview, Japan faces immense risks to its economic system from;


  1. Declining private consumption as the number of households in Japan starts to decline. Nowcast data also shows a marked decline in household consumption in recent months.

  2. A precipitous decline within the financial sector, an often forgotten component of GDP. With the Japan Financial Services Agency now reporting that most regional banks have become loss making in core businesses.

  3. A roll-over in the real estate sector as residential oversupply hits, vacancy rates rise, rents fall, prices decline in some areas and contract ratios indicate more price cuts are coming.

  4. Net export growth, which has been driven by a weak Yen and weak oil prices, faces a risk of the Yen strengthening 22% back to the long run real effective exchange rate, as well as continued oil price rises.


Short opportunities in regional banks, real estate developers, Real Estate Investment Trusts (REITs) and mid-size retailers are particularly appealing. The first three of these sectors, about which we have written over the last two years, have been noticeably weak but still offer significant downside. The retail sector, about which we have only recently began to write, has yet to turn down but was a notably weak performer in the last years of the last global  credit cycle. Importantly we believe that shorting these sectors does not require an end to the global credit cycle, but they would likely generate amplified short returns in that environment and hence afford excellent hedges to other longs elsewhere.


Finally, it"s worth recalling that as of one month ago, the BOJ already owned three quarters of all Japanese ETFs: a number which is now certainly higher, and is a non-trivial reason why Japan"s stocks have enjoyed the recent surge. Of course, with ETF supply declining rapidly and the BOJ soon to be locked out of further purchases, the question is what will stoke further "flow" into risk assets (and frontrunning of central bank purchases), and will the BOJ expand its mandate further to buy single name stocks next in the name of "price stability?"