Showing posts with label Interest rate. Show all posts

Monday, December 11, 2017

A Gift From The Oldies

By Chris at www.CapitalistExploits.at


I bumped into a friendly bloke at my local gym last week. Jim is his name.


Jim tells me he just started because, and I quote, "my doctor says I"m going to die unless I do something".


Now, I assure you it doesn"t take a doctor to figure this out.


One glance in Jim"s direction and you can tell that underneath all that weight there"s a big struggling heart in there... just ready to explode. He was surprisingly frank and tells me it"s so bad that he can only do little bits of exercise because if he pushes it too hard, there is a very serious risk that his ticker just says, "You know what... f*ck it," and gives up.


Jim"s 52, which is really a ripe old age and about normal life expectancy — if we lived in the 1700"s. But we don"t.


I feel for Jim, told him so, and naturally we all hope that he can bring himself back from the brink. But the fact is many people aren"t like Jim. As mentioned in a previous article on pensions, they"re living longer and stronger.


Years ago it seemed that when you hit 65 you’d retire, receive a gold watch, and proceed to spend your pension money on a rocking chair and pot plants. Ten years later you’d be in a box and, since pot plants are cheap, the cost of keeping you alive wasn’t prohibitive.


Not anymore. Today things are different. My wife belongs to a running club and there are a bunch of octogenarians there who put us both to shame. Nope, today you retire and spend your pension on kickboxing classes and second wives, with no plan of dying anytime soon.


Now, this second group (our kickboxing oldies) pose a grave problem.


You see, unlike Jim, these folks, who’ve spent their life exercising, go on and on and on.


70 is spring chicken young for them, and many make it well into their 80"s and 90"s when inevitably they need nappies, nursing care, accommodation, and mushy food to eat. And then finally machines on wheels need to be wheeled in and they end up with tubes in their noses. Don"t laugh. We"re all going to get there, unless we"re fortunate enough to just drop dead quick and fast. The point is this all costs a boatload of money.


Now, I"m aware that this topic isn"t rosy Friday red or shampoo advert fresh and clean, but there are some serious implications that I think you"ll thank me for so hear me out.


Demographics and Pensions


Demographics is an elephant in the room we shouldn"t ignore. It"s stomped around, defecated in the corner, and is now proceeding to knock over all the furniture. Ignore it at your peril. Rather, there are a number of ways to invest.


Let"s explore a few...


Old people (Mabel and Bob) pay for their retirements with pensions, and those pensions are held in pooled accounts at the DTC and managed by folks with pointy shoes and Tom Ford suits.


And because old Mabel and Bob are closer to the box than younger folks, the pointy shoed gents are extremely risk averse (as they should be), and this is where it gets exciting because you know what?


They"re presently engaged in the worst possible leveraged speculation you can think of.


Nope, it"s not Bitcoin.


First, to understand the insanity we have to take a step back and examine how these pointy shoed gents think.


They like fixed income because it"s far less volatile and ostensibly less risky than equities.


They hate small caps and frankly can"t invest in them due to their size, and they have a disdain for commodity markets. That volatility thing again...


In fact, volatility is like a barometer in their world by which everything else is measured.


The problem is with central banks shatbit crazy interest rate policies none of them have been able to make any money in a yield starved world and so they"re, wait for it, selling volatility.


Either through tailor made products from the investment banks or by buying any number of the low volatility ETPs out there.


Volatility isn"t even an asset.


In fact, the VIX is an index of volatility on 1 month to expiry ATM puts and calls on stocks in the S&P 500.


But now the geniuses on Wall Street have figured that they can actually package this animal, which as you can see, is a derivative of a derivative, and treat it like a bond. Fun, heh?


In all fairness, hats off to the asset managers who"ve had the balls to do this. They believed in the central banks" liquidity machine, and they backed their belief and for that they deserve to be paid. I sure wouldn"t have been able to do it.


Now, I"m not some miserable jealous git here to tell you that armageddon is coming and I"ve the answers.


God knows there"s enough of that nonsense in the financial publishing blogosphere for you to get your fill elsewhere. What we do know, however, is that this entire game: the selling of vol, the passive indexing — all of it is predicated on one thing. The central banks keeping rates low and pumping liquidity into the market. It"s why BTFD has become a meme.


The problem that I have with it, other than the distortions made, is that when so many are on one side of the boat like right now and that boat has many moving pieces, then I begin to wonder.


I"m reminded that markets change at the margin, where the slightest hiccup can act like a spark to light the fire of volatility, and these poor suckers who"ve managed to earn steady incomes selling puts find out what "unlimited risk" actually looks like as they"re forced to cover in a market that"s gapping the other way.


I"ve thought about this a lot and, in fact, we recently published how we are going "long vol" for members. And no, it"s not buying puts on VIX because that is, in my humble opinion... how do I say this politely, like begging to be stabbed in the eyes. repeatedly.


In any event that"s just one angle to this market. Here"s another.


Redemptions


I would be remiss in mentioning that as retirees retire, these pension funds will be drawn down.


It"s what Mabel and Bob do to pay for their mushy food, viagra, and bingo nights.


Now, I"m sure you"re all sharp enough to figure out what can happen to the assets these guys have been buying when they have to go from flat out full throttle, to stall, to reverse.


How big is this problem?


Well, for some context global institutional pension fund assets in 22 major markets stood at US$36.4 trillion at year end 2016, amounting to 62% of global GDP.


That is a staggeringly large amount of money.


Pension funds are big cumbersome dumb money. And they"re all allocated in equally dumb indexes, passive strategies, and bonds. So what happens when pensioners draw down on their funds?


You tell me...


Talking of staggeringly large amounts of money, the passive bubble grows bigger as I write this because this beast is fuelled not just by our pointy shoed friends but by Joe Sixpack himself.


Bloomberg just ran a piece:


BlackRock and Vanguard Are Less Than a Decade Away From Managing $20 Trillion


Two towers of power are dominating the future of investing.

Dominating indeed. Here"s how come the pointy shoed crowd can afford Tom Ford suits.


The article goes on to say:


Investors from individuals to large institutions such as pension and hedge funds have flocked to this duo, won over in part by their low-cost funds and breadth of offerings. The proliferation of exchange-traded funds is also supercharging these firms and will likely continue to do so.


Sometimes when everyone is zigging and you zag, you just get run over. But think about it...


We don"t need to go the other way. All we need to do is look where others are no longer.


These behemoths don"t do battle in the little unloved sectors or with stocks that don"t make it into an index. They can"t because they"re too big.


This means that there are a lot of orphans out there and here"s the good news. If it"s not in an index, passives aren"t buying it. And if passives aren"t buying it, it"s only active money that"s even looking at it.


Which brings me to the double helping of good news.


Here"s your competition in active with the accompanying passive.


Right now, it"s a mosh pit food fight to grab and create the next index or ETF so that more capital can be attracted, earning more fees, buying more suits.


This is all well and good.


Markets do what markets do, and I"m not here to grumble about it. I"m here to make money. And indeed if I was in the passive business, I"d be enjoying the steady stream of fees and hoping like hell the market keeps going up.


QE more? Yes, please.


But I"m not.


I"m a humble squirrel searching for nuts in the forest. And gosh, with all this moshing going on it"s wonderful how few other squirrels there are about. The same Bloomberg article makes a good point on this.


While bigger may be better for the fund giants, passive funds may be blurring the inherent value of securities, implied in a company’s earnings or cash flow.


Nah. You think?


Stocks in the index funds no longer trade on fundamentals but rather on asset flows, which sucks the oxygen out of the small guys who don"t make it into the indexes where brain dead passive money is playing.


It means we can gladly play in a sandpit with all the toys and there are very few we have to share them with.


The Cracks Have Already Appeared


Nothing lasts forever, and as I argued when discussing the impact of the incoming strong men on the global economy, there are 3 critical points worth thinking about:


  1. Political cohesion and stability can no longer be relied upon as politics becomes inward looking with everything from trade deals to central bank swap lines being renegotiated or cancelled altogether.

  2. Global coordinated central bank action. The era of global coordinated monetary policy which we’ve been experiencing since the GFC, especially with the three largest players (ECB, FED and BOJ), will be looked back upon with nostalgia by the current clutch of central bankers who muddy the halls of power. Policy will increasingly be driven with greater sensitivity to nationalist rather than international concerns, which brings me to…

  3. Liquidity in the financial system which has stemmed from easing monetary policy is already contracting. In a world where derivatives traverse borders, connecting financial systems like never before, a liquidity crisis presents enormous tail risk in a leveraged world.


Invest accordingly, and thank you for reading.


- Chris


“If you can’t take a small loss, sooner or later you will take the mother of all losses.” — Ed Seykota


--------------------------------------


Liked this article? Then you"ll probably like my other missives on


this topic as well. Go here to access them (free, of course).


-------------------------------------

Tuesday, November 28, 2017

Doug Casey On The New Fed Chair

Authored by Doug Casey via CaseyResearch.com,


Ahead of his confirmation hearing tomorrow, a few words are in order about the likely new Chairman of the Federal Reserve, Jerome Powell.


I don’t know the man personally. Not that it would make any difference; denizens of the swamp within the Beltway usually present well, and a brief meeting rarely allows you to penetrate someone’s social veneer. But I’m pretty confident that if we dined together it would be tense and unpleasant. We’d have no common ground, after the obligatory two minutes on the weather and the state of the roads.


He’s a lawyer, has been a Fed Governor for five years, and appears to be a “steady as she goes” so-called moderate Republican. He’s a lifelong Deep State player. But let’s not waste time psychoanalyzing this bureaucrat; he’s just a cog in the machine. And the machine, at this stage, has a life of its own.


Many of my friends in the alternative press deplore Trump’s appointment of yet another conventional money printer. They were hoping for a “hawk,” who would start liquidating the Fed’s $4.5 trillion balance sheet, and raising interest rates. And they’re right. That $4.5 trillion of super money has driven stock, bond, and real estate prices to insane levels. And today’s artificially low interest rates are discouraging saving, and encouraging people to live above their means.


In an ideal world there would be some radical changes. The best thing for the US in the (famous) long run is to go “cold turkey.” To abolish the Federal Reserve, fire its thousands of employees with their worthless PhDs. Return to 100% reserve banking with a strict separation of demand and time deposits. Depoliticize money by using gold, not Federal Reserve Notes. And default on the national debt, which is rewarding crony capitalists, and will turn future generations of Americans into serfs. And massively deregulate. And abolish the income tax, while cutting spending 90%. Etc. Etc.


The chances of that happening are exactly zero. So let’s talk, instead, about what is going to happen.


We’re going to have much higher levels of inflation. The new Fed Chair will open a monetary hydrant, at least if he doesn’t want to be hung from a lamppost by his heels. But I’m quite pleased Trump has appointed the guy. That may sound shocking. Let me explain why.


A sound economist would work to stop money printing and let interest rates find a market level. But that would precipitate a deflationary collapse after decades of monetary debasement. And the powers of darkness would again be able to paint sound policies and the free market as the cause for the problem, when actually it’s the only cure for economic problems.


From an economic point of view an inflationist like Powell is a disaster. It’s too bad he’s nominally a Republican, since for some reason they’re associated with the free market. As is Trump. Wearing our speculator hats, we’d likely be better off under Hillary - even more inflation, even more distortions to capitalize on. Even wearing our economist hats we might be better off under her, because if the whole rotten structure collapsed on her watch, it might discredit her ideas for at least a few years. But, as ever, I suspect I’m being too optimistic.


For decades - at least since I started following these things in the early ‘70s - free market economists have argued whether the Fed’s ever-increasing money printing would result in a deflationary depression, or a hyperinflationary depression.


As to why a catastrophic depression is inevitable - despite the fact most people try to produce more than they consume, and despite the fact science and technology are advancing exponentially - is beyond the scope of this brief article. I refer you to these pieces (here and here) I’ve done in the past on that topic.


It will be a deflationary collapse if the Fed doesn’t continue buying debt and creating new dollars. And a hyperinflation if they do.


If they stop printing, the banks would fail, and the public would lose a good portion of their deposits. The economy would slow down considerably, causing indebted corporations to default, unemploying their workers. Tax revenues would fall off, and governments wouldn’t be able to fund welfare programs. The stock, bond and real estate markets would collapse, wiping out the asset base of rich people.


It would be a huge social upset. But most of the real wealth in the world would still exist, it’s just that a lot of it would change ownership. And the dollar would still exist—there’d just be many fewer of them. Production and commerce could continue. At least until the cries go out for the government to “do something.”


But hyperinflation will be an even bigger disaster. And that’s what we’re going to get. Money will drop radically in value, making production and consumption much, much harder. Foreigners will dump trillions of them, sending them back to the US in exchange for real wealth. There’ll be even more unemployment than with deflation. But the profligate—those who’d borrowed a lot to live above their means—will be rewarded, while prudent savers will be punished. Shaky, overindebted corporations might survive, while productive ones with fat balance sheets will lose. Worse, governments will have their debts erased, and therefore might even grow in power. They’ll definitely “do something,” they always do in time of chaos. Stocks and real estate could first crash, then soar as people try to get out of dollars and into assets. This will benefit the rich, at least in relative terms.


At this late stage either type of depression will result in not just financial and economic, but in social and political chaos. It won’t be fun. In a depression everybody loses. The winners are just those who lose least. And a few speculators that get lucky. Hopefully we’ll be among them.


Given a choice—and they have a choice, based on whether they keep printing or not—the government and the Fed will definitely veer towards more inflation. Everyone in office just hopes to kick the can down the road for at least one more cycle.


Frankly, I was surprised that things didn’t go over a cliff in 2008 when we entered this most recent hurricane. And I’ve been surprised that things have held together as well as they have during the long “eye of the storm.” But governments and central banks around the world have already printed up scores of trillions of new currency units, and reduced interest rates to zero and below. What can they do when we go into the trailing edge of the hurricane?


My guess is that they’ll repeat their actions so far. Print more money and try to take interest rates even lower. The result will be hyperinflation, or close to it. And lots of new government controls of all types.


Why is this - strictly relatively speaking - good news for us? Because more money printing means more bubbles will be created. And while bubbles are the enemies of a sound economy, they’re the friend of the speculator. The current mania in Bitcoin and other cryptocurrencies is an example.


In particular, I’m looking forward to a bubble in commodities in general (most are down 50% from the previous peak in 2011), and precious metals in particular. And not just a bubble, but a hyper bubble in mining stocks.


So, if I’m right, in the next few years we could stand to make a fortune while the world is falling apart. I know - that sounds harsh to be eating caviar while the masses are forced to grub for roots and berries. But, as Ayn Rand said when asked what you should do about the poor: “Just make sure you’re not one of them.”


*  *  *


Every month, Doug shares his unique insights in The Casey Report, our flagship publication. If you sign up today, you’ll get complete access to all of our archived content, including recent essays by Doug on the Greater Depression, the migrant crisis, the crypto mania, technology, and much more. You’ll also receive specific, actionable advice to help you protect and grow your personal financial empire. You can sign up for a risk-free trial of The Casey Report right here.


Sunday, November 26, 2017

"When To Worry?": How Long After The Curve Inverts Does The Recession Begin

The recent (bear) flattening of the US yield curve to levels not seen since before the GFC, a move which has only accelerated in recent weeks as the stock market hit all time highs, has prompted some to question the strength of the US economic cycle, and others to ask outright how long before the curve inverts, signaling an imminent recession. Here, as Citi"s Jeremy Hale notes, just as "Dr. Copper" can sometimes be viewed as a stock market precursor, so "Professor Curve" (particularly when inverted or aggressively flattening) can be viewed as a signal of that policy is too restrictive relative to economic fundamentals (especially when using term premium suggests the curve should already be inverted). That said, during an expansion it’s generally normal for the curve to flatten, as the economy expands and the output gap closes, as shown in the chart below. This can be attributed to expectation of a higher Fed funds rate, but also a lower term premium, or more ominously, an inability to pass through inflation to the broader economy, leading to tighter financial conditions which ultimately manifest in an economic contraction.


Putting the recent 2s10s flattening in context (blue line on chart above), assuming this cycle started at the December 2013 steepness of 264bps, the curve has flattened for the past 60 months. On average, historic flattening cycles last for 2-2.5 years and flatten ~270bps from peak to trough. As Citi notes, we have flattened three quarters on the way there, or roughly 204bps so far in this cycle, therefore in comparison to previous episodes; perhaps this flattening dynamic is growing grey hairs... but it’s certainly not finished yet.


Indeed, if history repeats, then another 67 bps flattening is implied before we see an inversion of the curve. And while this cycle of curve flattening has been particularly slow, assuming a runrate of 40bps of flattening per year, then we could see a flat curve within 18 months (Figure 3, left). So "should we be worried?" Citi asks and answers that, rightly or wrongly, market participants with grey hairs would preach that all is well until the curve begins to invert. Ah yes, but that"s not the full story, as Citi explains below:


Sometimes inversion provides a timely signal for the economic cycle a la 2000, where Professor Curve predicted almost the ding-dong high in the SPX. However the 2006 episode of inversion dished up 7 months of pain for equity bears, with 18% further upside for the SPX. Ditto for the 1989 episode where equities continued to rally 22% into the 1990 recession (Figure 3, RHS). For now, we’re comfortable with the flattening dynamic with regards to other markets but would become increasingly cautious as the curve approaches zero.


In other words, once the curve inverts, it could either mark the top-tick of the market right there... or leave up to 22% more in equity upside before stocks finally crash.


Citi"s optimism - for now - aside, one notable distinction about the current flattening is that, unlike much of the curve move in 2016, this one has been driven by the front end, i.e. a bear flattening.  The front end of the US curve has significantly re-priced since September with the extension of the debt ceiling and the realization that fiscal easing could be achieved by the Trump administration.


Also worth noting is that while the short end has been driving curvature, the long end has been relatively rangebound, at least over the past year. What Citi finds particularly interesting is that even with ‘impending’ fiscal expansion in the US and balance sheet normalization by the Fed, term premia are actually still negative and suggest that the nominal 10y UST should trade closer to ~1.6% if the priced in forward short rate was at end pre-Election levels (Figure 6, LHS). This would suggest that there is, of course, a risk that the unusually low term premium - pushed to near record low levels by foreign central banks QE and NIRP, herding investors into long-term US duration - could suddenly rise; of note, perceived inflation risk could reverse its course quickly if inflation
suddenly trended up.


Some Fed estimates suggest that term premium is ~0.9% lower than it would be without the Fed’s large securities holdings, and that this term premium effect will gradually diminish with the reduction of the Fed’s balance sheet. But the Fed’s normalization has been well telegraphed; therefore the market has had the opportunity to anticipate this for several months (this goes back to another point made by Citi"s Matt King that the market has lost the ability to discount the future). In fact, the central bank depresses the term premium by limiting the uncertainty surrounding monetary policy. In short, Citi is skeptical of the material  impact that BSA may have on nominal yields given a relatively hawkish Fed. Furthermore, as the Fed continuing to tighten, it is possible the US economy is ‘locking in’ any gains that may be passed through to CPI. It is worth noting that in the last two cycles, US firms (and others) have had trouble - if not found it impossible - passing wage costs through to prices.


So even if a curve inversion does not spell imminent recession, what is next for the (shape of the) curve? Well, more of the same flattening it appears, as the curve takes more aggressive steps to flatten.


As Hale explains, the term premia and the forward curve suggests further flattening ahead (Figure 10 bottom LHS and top RHS). It’s also worth noting that in the past throughout Fed hiking cycles, the curve flattens on average between 100-125bps (Figure 10  bottom RHS), we’re currently around half way through on that basis assuming the Citi Fed call is right. But relative to other cycles at this stage, perhaps we have moved far enough for the time being. Citi"s fair value model using ACM term premium, the breakeven curve and a proxy for the r* also suggest flattening is close to fair value for now (Figure 10 top LHS).


But more medium term as the Fed keeps tightening, the curve will likely continue to flatten, and may even begin to bull flatten, should inflation expectations fall further. Ironically, Citi concludes, if the Fed wants higher long-term rates, and with them a steeper yield curve, it may need to hold back on further interest rate hikes until inflation surpasses the target/ backward driven inflation expectations rise.


Until then, however, expect people to keep talking about the flattening yield curve.


Friday, November 10, 2017

Consumer Confidence Unexpectedly Drops On Inflation, Rate-Hike Fears

UMich consumer sentiment declined from 100.7 to 97.8 in the preliminary November print, disappointing expectations of a small rise as anticipation of a pickup in inflation and higher interest rates weighed on the gauge.


Even with the decline, sentiment was the second-highest since January, reinforcing other reports that Americans remain optimistic about employment and the economy.


Other highlights include:


  • Consumers saw the inflation rate in the next year at 2.6 percent, up from 2.4 percent the prior month

  • Consumers expected an annual income gain of 2.1 percent for the second straight month, the best two-period average since 2008

  • Inflation rate over next five to 10 years held at 2.5 percent

  • Six in 10 consumers saw stock-market gains as likely in the year ahead

  • References to low mortgage rates fell to 32 percent in early November from 40 percent last month

Consumers (and policy makers) have four key concerns: prospective trends in jobs, wages, inflation, and interest rates. An improving labor market was spontaneously mentioned by a record number of consumers in early November, and anticipated wage gains recorded their highest two-month level in a decade. These favorable trends were countered by a slight rise in year-ahead inflation expectations and a growing consensus that interest rates will increase during the year ahead.


Americans are as exuberant about their wealth effect as they were at the peak ahead of the last crisis...


“While the majority judged current conditions in the economy favorably and consumers anticipated continued growth on balance, consumers judged the outlook less satisfactory, and were equally divided about whether the expansion would last another five years,” Richard Curtin, director of the University of Michigan consumer survey, said in a statement.


Thursday, November 9, 2017

Bond Bears & Why Rates Won"t Rise

Authored by Lance Roberts via RealInvestmentAdvice.com,


Here we go again…


Since June of 2013, I have been writing about the reasons why rates can’t rise much and why calls for the end of the “bond bull market” remain wrong.


Regardless, about every 3-months or so, there is a tick up in rates and you can almost bet that soon thereafter will be a litany of articles explaining why THIS time the “bond bull market” is really dead. For example, just from this past week:


What is the argument from low rates will rise?


It basically boils down to simply this – rates are so low they MUST go up.


The problem, however, is that interest rates are vastly different than equities. When people go to make a purchase on credit, borrow money for a house, or get a loan for a new car, they don’t ask what the level of the stock market is but rather “how much will this cost me?” The differentiator between making a purchase, or not, is based on the simple outcome of the interest rate effect on the loan payment. If interest rates rise too much, consumption stalls, and along with it economic growth, causing rates to go lower. If economic demand is robust, rates rise to meet the demand for credit.


The trend and level of interests are the singular best indicator of economic activity. As Doug Kass recently noted:


“The spread between the two- and ten-year U.S. notes has fallen to 68 basis points — that’s the lowest print in ten years and if history is a guide it is signaling a potential domestic economic slowdown.”


“The flattening in the yield curve is happening despite a likely continued Federal Reserve tightening and a rise back to December levels for overnight index swaps (OIS). It was back in 2004 — as the Fed started its tightening cycle (that concluded in Summer, 2006) — that both the curve flattened and the five year OIS rose. At the conclusion of the tightening in the middle of 2006, a deep recession followed by about fifteen to eighteen months later.”


In other words, “It’s the economy, stupid.”


Economic Growth Drives Rates


The chart below is a history of long-term interest rates going back to 1857. The dashed black line is the median interest rate during the entire period. I have compared it to the 5-year nominal GDP growth rate during the same period.


(Note: As shown, interest rates can remain low for a VERY long time.)

Interest rates are a function of strong, organic, economic growth that leads to a rising demand for capital over time.There have been two previous periods in history that have had the necessary ingredients to support rising interest rates. The first was during the turn of the previous century as the country became more accessible via railroads and automobiles, production ramped up for World War I and America began the shift from an agricultural to industrial economy.


The second period occurred post-World War II as America became the “last man standing” as France, England, Russia, Germany, Poland, Japan and others were left devastated. It was here that America found its strongest run of economic growth in its history as the “boys of war” returned home to start rebuilding the countries that they had just destroyed. But that was just the start of it.


Beginning in the late 50’s, America embarked upon its greatest quest in history as man took his first steps into space. The space race that lasted nearly twenty years led to leaps in innovation and technology that paved the wave for the future of America. Combined with the industrial and manufacturing backdrop, America experienced high levels of economic growth and increased savings rates which fostered the required backdrop for higher interest rates.


Currently, the U.S. is no longer the manufacturing powerhouse it once was and globalization has sent jobs to the cheapest sources of labor. Technological advances continue to reduce the need for human labor and suppress wages as productivity increases. Today, the number of workers between the ages of 16 and 54 is at the lowest level relative to that age group since the late 70’s. This is a structural and demographic problem that continues to drag on economic growth as nearly 1/4th of the American population is now dependent on some form of governmental assistance.


This structural employment problem remains the primary driver as to why “everybody” is still wrong in expecting rates to rise.


As you can see there is a very high correlation, not surprisingly, between the three major components (inflation, economic and wage growth) and the level of interest rates. Interest rates are not just a function of the investment market, but rather the level of “demand” for capital in the economy. When the economy is expanding organically, the demand for capital rises as businesses expand production to meet rising demand. Increased production leads to higher wages which in turn fosters more aggregate demand. As consumption increases, so does the ability for producers to charge higher prices (inflation) and for lenders to increase borrowing costs. (Currently, we do not have the type of inflation that leads to stronger economic growth, just inflation in the costs of living that saps consumer spending – Rent, Insurance, Health Care)


The chart above is a bit busy, but I wanted you to see the trends in the individual subcomponents of the composite index. The chart below shows only the composite index and the 10-year Treasury rate. Not surprisingly, the recent decline in the composite index also coincides with a decline in interest rates.


In the current economic environment, the need for capital remains low, outside of what is needed to absorb incremental demand increases caused by population growth, as demand remains weak. While employment has increased since the recessionary lows, much of that increase has been the absorption of increased population levels.


Many of those jobs remain centered in lower wage paying and temporary jobs which do not foster higher levels of consumption. To offset weaker organic consumption, artificially suppressed interest rates, though monetary policy, gives the appearance of economic growth by dragging forward future consumption which leaves a future “void” that has to be continually refilled.


Currently, there are few economic tailwinds prevalent that could sustain a move higher in interest rates. The reason is that higher interest reduces the flow of capital within the economy. For an economy that remains dependent on the generosity of Central Bankers, rising rates are not the outcome that “stock market bulls” should NOT be rooting for.


The Implications Of A Bond Bust


If there is indeed a bond bubble, a burst would mean bonds decline rapidly in price pushing interest rates markedly higher. This is the worst thing that could possibly happen. 


1) The Federal Reserve has been buying bonds for the last 9- years in an attempt to push interest rates lower to support the economy. The recovery in economic growth is still dependent on massive levels of domestic and global interventions. Sharply rising rates will immediately curtail that growth as rising borrowing costs slows consumption.


2) The Federal Reserve currently runs the world’s largest hedge fund with over $4 Trillion in assets. Long Term Capital Mgmt. which managed only $100 billion at the time nearly brought the economy to its knees when rising interest rates caused it to collapse. The Fed is 45x that size.


3) Rising interest rates will immediately kill the housing market, not to mention the loss of the mortgage interest deduction if the GOP tax bill passes, taking that small contribution to the economy away. People buy payments, not houses, and rising rates mean higher payments.


4) An increase in interest rates means higher borrowing costs which lead to lower profit margins for corporations. This will negatively impact the stock market given that a bulk of the “share buybacks” have been completed through the issuance of debt.


5) One of the main arguments of stock bulls over the last 9-years has been the stocks are cheap based on low interest rates. When rates rise the market becomes overvalued very quickly.


6) The massive derivatives market will be negatively impacted leading to another potential credit crisis as interest rate spread derivatives go bust.


7) As rates increase so does the variable rate interest payments on credit cards.  With the consumer are being impacted by stagnant wages, higher credit card payments will lead to a rapid contraction in income and rising defaults. (Which are already happening as we speak)


8) Rising defaults on debt service will negatively impact banks which are still not adequately capitalized and still burdened by large levels of bad debts.


9) Commodities, which are very sensitive to the direction and strength of the global economy, will plunge in price as recession sets in.


10) The deficit/GDP ratio will begin to soar as borrowing costs rise sharply. The many forecasts for lower future deficits will crumble as new forecasts begin to propel higher.


I could go on but you get the idea.


The problem with most of the forecasts for the end of the bond bubble is the assumption that we are only talking about the isolated case of a shifting of asset classes between stocks and bonds. However, the issue of rising borrowing costs spreads through the entire financial ecosystem like a virus. The rise and fall of stock prices have very little to do with the average American and their participation in the domestic economy. Interest rates, however, are an entirely different matter.


I won’t argue there is much room left for interest rates to fall in the current environment, there is also not a tremendous amount of room for increases. Since interest rates affect “payments,” increases in rates quickly have negative impacts on consumption, housing, and investment. This idea suggests is that there is one other possibility that the majority of analysts and economists ignore which I call the “Japan Syndrome.”


Japan is has been fighting many of the same issues for the past two decades. The “Japan Syndrome” suggests that while interest rates are near lows it is more likely a reflection of the real levels of economic growth, inflation, and wages.


If that is true, then rates are most likely “fairly valued” which implies that the U.S. could remain trapped within the current trading range for years as the economy continues to “muddle” along.


The irrationality of market participants, combined with globally accommodative central bankers, continues to push asset values higher and concentrate investors into the ongoing “chase for yield.” There isn’t much guessing on how this will end, history tells us that such things rarely end well.


Tuesday, October 31, 2017

BoE Expected To Vote 6-3 For Rate Increase And Signal Markets Underpricing Future Hikes

The last time the Bank of England raised rates was July 2007, when rates increased to 5.75%. Credit markets began to dislocate a month later (when LIBOR diverged from Fed Funds), equity markets peaked three months after the increase and things eventually got much worse.


So, the track record is not auspicious, but the alleged global macro narrative this time is one of synchronised global growth, notwithstanding Catalonia, North Korea and embryonic concerns about Chinese deleveraging. On the domestic front, UK inflation is a bit too warm, growth a bit too tepid and Brexit a bit too uncertain.


Nonetheless, the BoE is expected to vote 6-3 in favour of a rate hike from 0.25% to 0.50% on Thursday, as Bloomberg reports, not everyone at the Bank of England will be on board with raising interest rates.


While Nov. 2 may see the U.K.’s first rate increase in more than a decade, economists surveyed by Bloomberg say three out of nine officials on the Monetary Policy Committee will vote against the move. That’s based on the median estimate from 24 responses. Any divide within the BOE panel reflects the conflicting signals from the economy, which is seeing both a currency-driven inflation surge and weaker expansion. While for some officials, the economy may still be too fragile to endure a rate increase, Governor Mark Carney and others see Brexit reducing potential output, making the U.K. more vulnerable to overheating.


Two of the three likely dissenters are two of the three deputy governors no less, as Bloomberg notes...


Policy makers Dave Ramsden and Jon Cunliffe may be among those to dissent. Ramsden said this month he doesn’t yet see domestic inflationary pressures building, and Cunliffe said it’s an “open question” when the BOE should lift its benchmark rate from a record-low 0.25 percent.


Silvana Tenreyro, described as “neutral” on policy by Bloomberg Economics, has also hinted that she’ll proceed with caution. The overriding thinking on the committee, however, seems to be that above-target inflation and a shock to supply from leaving the European Union means a rate hike is warranted.


In the build-up to the decision on Thursday, some recent data may have emboldened the more hawkish policy makers. The economy expanded by 0.4 percent in the third quarter, more than economists expected, and inflation hit 3 percent last month, a full percentage point above the BOE’s target. The central bank will update its economic forecasts alongside the policy decision. Compared with August, economists see a chance of an increase in the bank’s inflation estimate for this year.


If a rate hike is forthcoming - and markets are pricing in an 88% probability of one - the more important question is the signal about future hikes. While many commentators believe that it will be a question of “one and done” (a “dovish” hike), Bloomberg believes that the “BOE may also say markets underestimating further hikes”, noting, even with a division on the MPC, economists forecast that the BOE will keep alive the prospect that further rate increases are on the cards. While another move may not come soon, more than half of those surveyed expect Carney to indicate that markets are still under-pricing the odds of future tightening.


Never mind further rate hikes, a substantial percentage of economists are against a rate increase this week. A Reuters poll published in the past week showed more than 70 percent of economists believe now is not the time to raise rates - though slightly more than that said it would happen anyway.


When Carney was appointed BoE Governor in 2012, then UK Chancellor of the Exchequer, George Osborne, described him as “the outstanding central banker of his generation.” While he might be outstandingly handsome (we’re told), the coming months will determine whether he lives up to that billing, or is seen as making a catastrophic policy error - like Jean Claude Trichet in 2008.


Wednesday, October 25, 2017

Interest Rates Testing 25-year breakout level


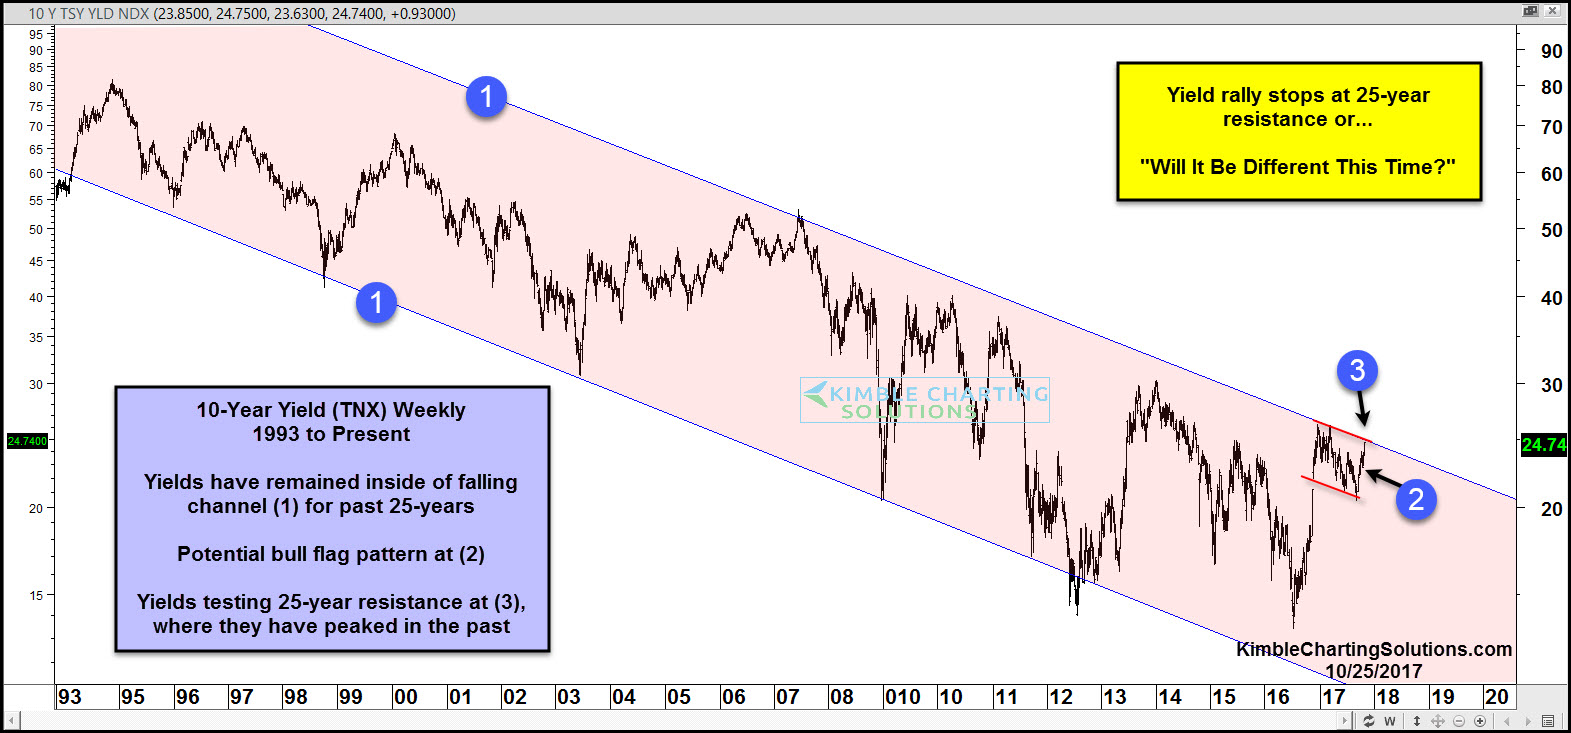
Interest rates based upon the 10-year yield (TNX) have been heading lower for years, more than 25-years actually. Below looks at the yield on the 10-year note and reflects that an important and rare test is in play.


CLICK ON CHART TO ENLARGE


Yields on the 10-year note have remained inside of falling channel (1) for the past 25-years. In the past, as rates have come near or touched the top of this channel, they were actually peaking.


At the start of this year, rates hit the top of the channel and backed off. Over the past 10-months rates could be forming a bull flag pattern, just under the top of falling channel (1). Of late rates have risen at (2), bringing yields up to test long-term falling resistance again at (3).


What rates do at (3) should be big-time important for bonds, banks, utilities and other interest rate sensitive assets.


Rates have peaked and headed lower when they have hit long-term resistance for years. The BIG question for investors in many assets classes is…“Will It Be Different This Time!”


Why you see charts with brief commentary:   There is a ton of news and opinions around markets and assets that make the decision-making process more difficult than it needs to be.   I believe the Power of the chart Pattern provides all you need to see what is taking place in an asset and determine the action to take.  This approach has worked well for me and our clients and I encourage you to test it for yourself.


Receive my free research posted on the blog daily here 


Or,  send an email if you would like to see sample research and take me up on a trial of my premium or weekly research where I provide actionable alerts on breakouts and reversals in broad market indices, sectors, commodities, the miners and select individual stocks 


Email services@kimblechartingsolutions.com  


Call us Toll free 877-721-7217 international 714-941-9381 


Website: KIMBLECHARTINGSOLUTIONS.COM 


Wednesday, October 4, 2017

What Few Expect: Inflation Will Surge, Destabilizing The Status Quo

Authored by Charles Hugh Smith via OfTwoMinds blog,


Few seem to ponder what global shortages in key commodities might do to prices.


If there is any economic truism that is accepted by virtually everyone, it"s that inflation is low and will stay low into the foreseeable future. The reasons are numerous: technology is deflationary, globalization is deflationary, central banks will keep interest rates near-zero essentially forever, and so on.


Just for laughs, let"s look at healthcare, almost 20% of America"s entire economy, as an example of low inflation forever. If being up over 200% in the 21st century is low inflation, I"d hate to see high inflation.


Here"s the official Consumer Price Index (CPI), which as many have noted, severely distorts real-world inflation by claiming big-ticket items such as college tuition and healthcare are mere slivers in household budgets.


Note the remarkably stable trend line in CPI over the past 40 years. This certainly doesn"t shout "inflation is near-zero and will stay low indefinitely."


Here"s the PCE, Personal Consumption Expenditures, the Federal Reserve"s favored measure of core inflation. Let"s put it this way: either the PCE is real and the CPI is false, or vice versa; they can"t both be accurate measures of real-world inflation.


Here"s a look at the annual rate of inflation. The go-go years prior to the Global Financial Meltdown of 2008-09 and the years of "recovery" 2010 to 2014 look very similar: some modest volatility between 1.7% and 2.5% annually.


But something changed in 2015-2017. The wheels fell off and then inflation turned up. Maybe it was nothing, maybe not. Let"s turn to a chart of asset inflation for a different perspective.


Courtesy of Goldman Sachs, here is a chart comparing asset inflation with real-world inflation. Note how assets have soared while real-economy measures have barely edged higher--commodities actually fell in price.


Now let"s look at where the gains of the "recovery" were concentrated: in the hands of the few in the top .5%. This chart depicts the unprecedented concentration of income gains in the very apex of the wealth-power pyramid. Needless to say, very little trickled down to the bottom 90%, and even the top 9.5% received mere crumbs.


So what do these charts tell us about future inflation prospects? To the conventional punditry, they suggest more of the same: higher asset valuations, low real-world inflation and near-zero interest rates (courtesy of central bank purchases of bonds and other financial assets).


I beg to differ. To me, these charts suggest real-world inflation is about to take off in the next 5 years, surprising everyone who expected more of the same. My reasoning is simple:


The leadership of the Status Quo has a simple choice: continue with more of the same, enriching the top .5% at the expense of everyone else, and face a political firestorm of upheaval, instability and insurrection, or start funneling the trillions of dollars, yen, yuan and euros that have been channeled into the hands of the few into the hands of the many.


The policy of funneling fresh cash into the hands of households has a number of variations: negative tax rates (lower income households get a hefty tax rebate annually), Universal Basic Income (UBI--every adult gets a monthly cash stipend), QE for the people (the central bank buys special government bonds that eliminate all student loan debt), and so on.


Where virtually all central bank monetary stimulus over the past 8 years went into assets, QE for the people would go right into household bank accounts where most of it will be spent in the real economy.


The incomes of the bottom 90% have gone nowhere for 8 long years. No wonder real world inflation has been capped outside of housing, healthcare and higher education. (Never mind these are the dominant expenses for the majority of households.)


So what happens when fresh trillions start flowing into the real world economy instead of into assets? If history is any guide, inflation picks up. Toss in some global shortages in key commodities and the fuel for inflation will be ready to ignite.


One part of the inflation will stay low indefinitely story is there"s an abundance of everything: grain, oil, natural gas, copper, bat guano--you name it, the world is awash in the stuff.


Few seem to ponder the possibility that this surplus of everything might be temporary, a brief run of extraordinary luck rather than a permanent abundance. Few seem to ponder what global shortages in key commodities might do to prices.


Whether you call soaring prices inflation or not, the result is the same: the purchasing power of currency declines. Every unit of currency buys less of whatever is no longer in surplus.


The funny thing about inflation is that it"s not a problem that can be solved by creating trillions more dollars, yuan, yen and euros out of thin air. Issuing mountains of new currency actually increases inflation.


Oops. Our only "fix" is to issue trillions more in new currency and credit. If that doesn"t fix the problem, the toolbox is empty.


*  *  *


If you found value in this content, please join me in seeking solutions by becoming a $1/month patron of my work via patreon.com. Check out both of my new books, Inequality and the Collapse of Privilege ($3.95 Kindle, $8.95 print) and Why Our Status Quo Failed and Is Beyond Reform ($3.95 Kindle, $8.95 print, $5.95 audiobook) For more, please visit the OTM essentials website.

Saturday, September 30, 2017

"The Fed Is Afraid..."

Janet Yellen this week cast doubt on the Fed"s announced plan to continue Fed rate hikes and reverse its years of "unconventional" monetary policy. 


“My colleagues and I may have misjudged the strength of the labor market,” Yellen announced on Tuesday, adding that they"d also misjudged "the degree to which longer-run inflation expectations are consistent with our inflation objective, or even the fundamental forces driving inflation."


Yellen also "noted that the labor market, which historically has been closely linked to inflation, may not be as tight as the low unemployment rate suggests."


In other words, Fed economists are concerned by the fact they"ve been unable to achieve their arbitrary 2% price-inflation objective, which they believe indicates a healthy level of economic activity.


Moreover, they"re concerned the low unemployment rate — which can be deceptive since it can show a "tight" market even in the presence of unemployed discouraged workers and involuntary part-timers — is not telling the whole story. 


The end result is that the Fed is not at all sure that it can continue with its promised path of raising the target interest rate as has been the "plan" for the past several years. 


As we"ve noted here at mises.org before, the Fed has a habit of announcing big plans to scale back quantitative easing, and increasing the target rate — only to later backtrack or downplay the extent to which it will "normalize" monetary policy. 


Since 2009, the target rate has been at rock-bottom rates. Over the past year, the Fed has raised the target rate from 0.5 percent to 1.25 percent, but this has only gotten the rate back up to where it was when it was attempting to stimulate the economy in the wake of the dot-come bust in 2001. On other words, the Fed is still deep into "stimulative monetary policy" territory. 


targetrate.png


And now we"re being told that the Fed may have overestimated the rate to which it can scale back monetary policy. 


Nine Years of Stagnant Incomes 


Looming over the latest admission of "miscalculating" the economy"s success is the ongoing myth that the Fed and its economists are wisely and carefully steering the economic ship to a safe port. 


Actual experience — given that the target rate was kept near zero for eight years — more suggests panic and dismay, rather than the presence of a steady hand. 


If we look at the Federal government"s own data on incomes through 2016, we find an unimpressive record indeed. 


Real median personal income, for example, peaked during the last cycle at $30,821 in 2007. This total was not exceeded again until 2016 when it reached $31,099. That"s 0.9 percent growth over a period of nine years. 


medpersonal.png


We see a similar picture with both median family income and median household income. 


medfamily.png


Median family income grew 2.3 percent from 2007 to 2016. It grew 2.7 percent from 2000 to 2016. Growth was nearly zero from 2000 to 2015, and only began to really surpass old peaks in 2016. 


hhincome.png


 Median household income grew 1.5 percent from 2007 to 2016. It grew 0.6 percent from 2000 to 2016. 


(See here and here for more discussion on how demographic changes can affect income growth levels.)


These number by themselves don"t prove that real incomes are flat for everyone of course. But, lackluster numbers in employment, and in GDP over the last 20 years — compared to the post-war economy overall — hardly point to a period of economic gain for many ordinary Americans. 


The Fed Is Afraid 


For years, the Fed has been telling us repeatedly that the economy is moving forward, that growth is "moderately" robust, and that they"ll return to more "normal" interest rates and more normal monetary policy. The reality has been eight yeears of no action followed by about 18 months of extremely mild and cautious increases in the target rate. 


So the question is this: if we"re seeing moderate growth month after month, and year after year, why has the Fed been too afraid to do anything except make only the smallest changes?


The answer, most likely, is that the Fed knows the economy is extremely fragile. This latest admission from Yellen serves to — yet again — manage expectations and tell us to not expect much of anything from the Fed in terms of normalization. Perhaps we"ll need another seven or eight years to get the targe rate up to 2 percent.

Sunday, September 17, 2017

Why Quantitative Easing In The Eurozone Will Be Extended

The staff of the European Central Bank has now released the new macro-economic projections for the Eurozone and whilst the introduction sounds optimistic about an ever-increasing GDP and a relatively stable GDP growth rate, reading between the lines suggests we could see an extended Quantitative Easing program.


The ECB is probably correct when it claims the economic recovery will remain ‘robust’, but it also mentions the ‘favorable financing conditions’ as one of the main drivers of this economic recovery. This is quite the ‘catch 22’ scenario. The economy is recovering due to the low interest rate policy of the ECB, but without this ‘easy money policy’, the recovery would be either much slower or non-existing at all. Whilst we have heard several voices from ECB committee members the central bank is getting close to the point it will start to increase the interest rates again, the working paper from the ECB staffers is pretty clear on the need for continuous (monetary) support to protect the current economic recovery.


Source: ECB paper


What’s even more intriguing is the fact the ECB’s assumptions are taking an even LOWER interest rate into account. The study was based on the market circumstances and market expectations as of half August, and back then, the market was taking an average 10 year government bond yield of 1.3% in 2018 and 1.6% in 2019 into consideration. However, this has now been revised downward with approximately 10-20 basis points. This could indicate the market has started to price in a longer period of easy and free money.


And that’s an important starting point. As the loans to businesses (and individuals) are priced based on the anticipated ‘risk-free’ interest rate of a government bond, the lower expectations for sovereign debt yields will trickle down to the ‘real’ economy (underpinning the growth expectations), but it’s unlikely this effect will still be noticeable should the ECB reduce its QE program. That’s probably why the market is now expecting the three month EURIBOR interest rates to continue to be low, and even lower than when the previous quarterly survey was completed.


Source: ECB Paper


As you can see on the next image, even keeping the Quantitative Easing program unchanged, the GDP growth rate will slow down whilst the anticipated inflation rate will decrease as well to less than half of the ECB’s desired 2% rate.


Source: ECB Paper


The ECB comments this is due to a lower oil-related inflation impact and it expects the underlying inflation rate to increase again from 2019 on, but we do not necessarily agree with that view. After all, the weaker than expected US Dollar might increase the impact of the low oil price and extend the period wherein this impact will be felt.


Source: Danske Bank


Whilst most eyes have been on the Federal Reserve lately, the upcoming decision of the European Central Bank in October might be even more important. Several executive committee members have claimed the Eurozone is strong enough to sustain the recovery on its own, but we think it might be too soon for the Eurozone to stand on its own legs.


A reduction of the size of the Quantitative Easing program is definitely a possibility but this isn’t Utopia. The continuous support of the Central Bank is still needed.


Would you like to maintain your purchasing power? Read our Guide to Gold right now!

Sunday, September 10, 2017

Eric Peters:"From Here Do You Want To Remain Long Crap? And Short Quality?"

It is Sunday which means Eric Peters, the CIO of One River Asset Management, has published his latest weekly assortment of anecdotes and vignettes selected from the life of a hedge fund manager (always in the 3rd person), which today focuses on the quandary facing the Fed (hiking rates hurts Wall Street, but does it help Main Street?), portfolio positioning (does mean-reversion spell the end of the two best trades of the year, long EM and equities), trapped central banks and the Stockholm Syndrome (the inability by Sweden and ECB to tighten even as they forecast economic growth) and China"s ongoing nationalization of its financial system. In a subsequent post we will also present his 4 anecdotes on the life of a CIO from the perspective of everyday events.


So without further ado, here is Eric Peters with his latest weekend notes.


Real Wealth:


“The irony is that the people who are least sensitive to interest rates are the most affected by low interest rates,” said the CIO. “In most cycles, the collapse in interest rates would have sparked a massive real estate cycle, driven particularly by those who need loans.” But not this time.


“The real activity has been in places like NYC where people are least in need of mortgages.” But their wealth has exploded indirectly through low rates via the rise in asset prices. “I wouldn’t bank on that lasting for much longer, though I’m not sure what’s next.” 


“The real economy hasn’t gotten over-leveraged as a result of low rates,” continued the same CIO. “But the financial economy sure has.” Corporate debt issuance, share buybacks, financial engineering of all stripes. “But what is the Fed going to do? Hike rates to hurt rich people?” he asked.


“Maybe that helps restore a sense of social fairness over a 20yr timeframe, but I’m not sure that it helps anyone in the near-term.” He fired up his Ferrari, heading to the Hamptons. “High rates hurt Wall Street, but how do they help Main Street?”


Old Dogs:


“Examine portfolios that have worked,” said the CIO. “And then mean-revert them to see how they make you feel.” Dogs of the Dow was a well-known example of a mean-reversion system. “Long emerging markets and long equities are the portfolios that have worked this year.” Short bonds and long dollars are the 2017 losers. “So do you still want to be long EM and equities from here? And do you want to be short bonds and long dollars?” Sometimes it’s helpful to look at the world simply. “From here, do you want to remain long crap? And short quality?” 


Stockholm Syndrome:


Sweden’s central bankers left overnight rates at -0.50% and forecast no hikes until Q3 2018. They did, however, lift 2017 GDP forecasts +1.0 to +3.2% and 2018 GDP +0.3 to +2.7%. Industrial production is surging +5.3% annually, and services output is rising +4.1%. Inflation is right on target at 2%. The economy is booming. Real rates are deeply negative, in desperate need of normalization.


But you see, European central bankers have set overnight rates at -0.40%. And the Swedes are hostage to fears of a strong krona.


Big Brother:


“China completely renationalized its financial system,” said the CIO. “They turned their backs on markets.” For a time, the PBOC had come to accept the West’s belief in the wisdom of free markets. No more. “They closed their capital account and have no plans to even reconsider the decision until 2020.” Perhaps much later.


“Allowing markets to determine exchange rates and interest rates is not part of Chinese culture.” No nation in Asia really believes in free floating financial markets.


“They can continue running this game until they open up.”


Friday, September 1, 2017

Quantifying Treasuries' Upside In A Recession

"But, but, but, rates have nowhere to go but higher..." is all we have heard for the past year.


But what if that is incorrect?


KesslerCompanies.com quanitifies the upside returns from owning bonds if things don"t work out as ebuliently as expected...


It is only logical to assume that after 8.2 years of unimpeded GDP expansion in the US, we are near to the other side of the business cycle, a recession. The average expansion since 1900 is 3.8 years, and this one is already the 3rd longest, only bested by an expansion in the 60’s at 8.8 years and the expansion in the ‘Roaring 90’s’ at 10 years.


Logically and empirically, recessions see much lower interest rates. Cycles associated with the 14 recessions since and including the Great Depression average a drop of 186 basis points in yield (-1.86% in yield) in the 10yr US Treasury. In the last five recessions that we have Fed Funds target data for, the Fed has cut rates an average of 625 basis points (-6.25%) and a minimum of 500 basis points (-5%).


With the Fed at 1.125% now, it is easy to imagine a negative Fed Funds Rate and negative Treasury yields in the next recession. A recent Bloomberg article points to new research from Harvard professor Kenneth Rogoff suggesting that negative interest rates have been proven to work and are a viable choice for the Federal Reserve.


In the next recession we expect rates to fall nearer to Japan and Germany type levels; below 1% and possibly below 0.50% or 0%. Using short-hand, estimates of performance can be calculated using assumptions for where the 10yr UST falls to.


click image for large legible version


*This is a short-hand estimate of what returns may look like before any fees or commissions. This simple model does not take into account carry, rolldown, or active management. Returns could easily be higher or lower than these estimates at these terminal yields. Higher yields would most likely result in lossses.