Showing posts with label Economic history of Japan. Show all posts

Thursday, October 26, 2017

Japan Is Booming! (Except It"s Not)

Authored by Jeffrey Snider via Alhambra Investment Partners,


Japan is hot, really hot. Stocks are up to level not seen since 1996 (Nikkei 225). Prime Minister Shinzo Abe called snap elections in Parliament to secure a supermajority and it worked. Things seem to be sparkling all over the place, with the arrow pointing up:


“Hopes for a global economic recovery and US shares’ strength are making fund managers generous on Japanese stocks,” said Chihiro Ohta, general manager of investment research at SMBC Nikko Securities.


Only that isn’t real, just like it wasn’t three or seven years ago. Emotions don’t seem to be tracking well with reality, and in Japan it is no different. There isn’t even much of lingering popular belief in QQE to at least give these broad feelings the appearance of substance; global growth is coming because, well, it just has to, right?


Like here, or anywhere for that matter, stocks are up but the economy is not. Belief still clings to what is always over the horizon. You would think given the breathless coverage in the worldwide media that Japan is utterly booming, jumping with so much activity the island can’t contain it all. It just isn’t true, the story being wildly distorted as always to fit the (technocrat friendly) narrative.


Household spending in Japan, for example, has turned slightly positive in the past few months. It sounds like more than it is, less of a positive than in the middle of 2015 when all the same things were being said about the subject by the same people. Like anywhere else, even the Japanese economy is prone to the occasional upturn. What really matters is that those brief moments of positive never come close to making up for the more widespread and sustained negatives.


It’s another relative change that is mistaken, quite often intentionally, for a categorical one. In other words, Japan is experiencing little more than a reprieve from continued contraction rather than any actual turn toward actual growth.


That verdict is given to us by Japan’s labor market. The more positive anyone is about the economic circumstances there, the more likely it is that the labor market shows the opposite. Total hours worked continue to decline despite the rise in relative activity (again, proving its relative not categorical).


Wages that had looked seemed like they were on the rise really were impacted more by base effects and statistical irregularities (the transitory rise, then fall, of the CPI) than anything tangible. Real wages have contracted year-over-year in each of the past three months, and have been zero or negative in ten of the last eleven. And still economists point to Japan’s unemployment rate as if it matters.


But because the media is selling the future of “global growth”, the charade will/can only continue:


A hefty win raises the likelihood that Abe, who took office in December 2012, will secure a third three-year term as LDP leader next September and go on to become Japan’s longest-serving premier. It also means his “Abenomics” growth strategy centered on the hyper-easy monetary policy will likely continue.


It’s the appearance of hyper-easy monetary policy, not actual or effective accommodation. No matter how many times the other is claimed and will be claimed, that doesn’t just make it true. In Japan, like everywhere else in the world, there isn’t the slightest hint that QE, QQE, or QQE with YCC underwrites even a little positive economic difference. Japan’s small upturn has nothing to do with QQE and everything to do with minor (and relative) “reflation” after the “rising dollar.”


At now more than half a quadrillion yen on its books, both sides assets and liabilities, obviously, what is the Bank of Japan’s QQE actually doing? It has been reduced to questionable histrionics, the necessary part of every media story on Japan that makes it seem like authorities are doing something helpful.


I believe instead that Abe’s successful election gambit is somewhat of a parallel to other political processes being played out in places like Austria, Germany, and even to some degree China. The Japanese people have resigned themselves to this economy as it really is, and pay very little attention to QQE or whatever else like it. They have to know by now that it has made no positive contribution, so why not vote on the basis of other matters if the grand economic designs that swept Abe into office the first time in 2012 can’t move the needle after five years.


Abenomics or not Abenomics, there has been no difference. The economy is as bad or worse than it was before, and it doesn’t look like either party will do anything that can change matters. Therefore, increasingly, other issues become the centerpiece for what is really economic dissatisfaction channeled into alternate formats.


Earlier this year, in the face of an increasingly hostile North Korea, Abe set a deadline of 2020 to revise Japan’s constitution, which contains language that bans the country from maintaining armed forces. It is a controversial proposal that strikes at the heart of the country’s post-war identity.


If that post-war identity includes hapless technocratic monetarism, then why not change it if only to be able to change something? Maybe the Japanese do have a limit, and that a quarter-century is more than enough of one feckless scheme after another. The old way of doing things just doesn’t work anymore, a judgment that is being applied all across the world. North Korean or Chinese provocations suddenly matter more now perhaps because the Japanese worry about Japanese strength in economic terms.


It’s almost political contagion, where people in Japan or the UK see others voting for “that’s enough” and want to make the same bold, dissenting statement however they might. You vote for something very big and very different because there is no vote on monetary or economic protest that either political party will give you. It explains quite a lot, including the backlash against the backlash.


The world is treading a dangerous path primarily because the official parts of it won’t admit there is a problem; or, in places like Japan, that they might not have the will and understanding to do anything about it. It’s the worst part of this zig zag, where nothing, even stagnation (depression), ever goes in a straight line. Each of these all-too-brief upturns are always mischaracterized as far more than they ever could be, and so any urgency about addressing the real issue falls by the wayside.


The growing unrest doesn’t, of course, and instead gets funneled into often unproductive directions. We collectively look in the wrong place because the right answers are really hard to see.


Wednesday, September 27, 2017

The ONLY Variable That Matters To The Price Of Gold

Written by Jeff Nielson, Sprott Money News


There are all sorts of positive fundamentals when it comes to the price of gold. There are the positive supply/demand fundamentals. The gold market is in a supply deficit. Mine reserves are at a 30-year low. The price of gold is below what is necessary to sustain the gold mining industry.


There are the positive geopolitical fundamentals. The world’s two most-unstable leaders – Kim Jong-un and Donald Trump – have been constantly trading threats and insults. And both of these people have nuclear weapons at their disposal. There is the endless “War on Terror”.


There are the positive economic fundamentals. Western real estate bubbles in major urban centers are at never-before-seen levels of insanity. Western markets are generally also at bubble levels, with U.S. markets representing bubbles on steroids. Western governments are bankrupt.


In relative terms, none of these fundamentals count.


There is one more important fundamental for the price of gold. Not only is it the most important fundamental, but it involves a variable which dwarfs all other fundamentals in magnitude -- combined.


Regular readers have heard many times before that gold (and silver) is “a monetary metal”. The definition is simple. Gold is money. Therefore the price of gold must change proportionate to changes in the supply of other forms of “money” (i.e. currency).


This is not a theory. It is a function of simple arithmetic. An elementary numerical example will illustrate this principle.


Suppose (in the entire world) there was a total of 10 ozs of gold. Suppose also (in this hypothetical world) that there was a total of only $10,000 U.S. dollars. And in this hypothetical world, the price of gold is $1,000/oz.


Let us suppose the supply of U.S. dollars increases by a factor of five, and thus there are now $50,000 USD’s. What happens to the price of gold? All other things being equal, the price of gold must increase by a factor of five (in this case, to $5,000/oz), to keep our hypothetical world in equilibrium.


Now let’s return to the real world. What happened in the real world? The supply of U.S. dollars did increase by a factor of five. This was the most reckless money-printing binge since Germany’s hyperinflation during the 1920’s. Regular readers know this monetary orgy as “the Bernanke Helicopter Drop”.


Over a span of 50 years from 1920 through 1970 (while we still had a gold standard), the supply of U.S. dollars was virtually unchanged. In five years, 2009 – 13, B.S. Bernanke quintupled the U.S. money supply.


Did the price of gold quintuple? No, not even close. At the time that Bernanke began his money-printing orgy, the price of gold was roughly $800/oz. That was right after, the price had been driven roughly 30% lower by the banking crime syndicate. And even before that point, the price of gold wasn’t close to reflecting its full value.


At a minimum, the Bernanke Helicopter Drop should have propelled gold to $4,000/oz (USD), concurrent with that money-printing. Arguably, the price should have gone much higher than that. In actual fact, as we all know, the price never even reached $2,000/oz: less than half of the absolute minimum price.


That should have been the base price for gold in 2013: $4,000/oz USD. The supply of U.S. dollars has never shrunk. Forget about “tapering”. It never happened.


How do we know? B.S. Bernanke told us so. From 2009 – 13, virtually every week Bernanke boasted about “the wealth effect” from his money-printing: how U.S. stock markets were being pumped higher and higher and higher.


Obviously if quintupling the supply of U.S. dollars pushed U.S. markets up to their bubble levels, then withdrawing dollars would cause those markets to fall from their all-time highs. What have we seen? Instead, the bubbles have gotten bigger and bigger and bigger.


Obviously the U.S. money supply hasn’t shrunk, it has continued to grow. Bernanke and the Fed lied when they claimed they were reducing the supply of U.S. dollars. And as we also all know, the Federal Reserve absolutely refuses to allow any outside auditing.


Nobody knows what are on its books, we only know what the Fed-heads claim is on their books. And what they claim is not remotely plausible.


The U.S. market bubbles keep expanding, ergo the U.S. money supply keeps expanding. There is no other possibility. Yet the price of gold isn’t at $6,000/oz. It isn’t at $4,000/oz. It isn’t at $2,000/oz. It has been falling for most of the last six years.


During those six years, no one in the mainstream media (and very few in the Alternative Media) has made any mention of the gigantic disconnect with U.S. money-printing and the price of gold. The reason why the mainstream media propaganda machine has ignored this fundamental is obvious. Their job is to suppress the price of gold.


Why have practically no commentators in the Alternative Media been banging the drum on this subject? Ignorance. Sadly, few of these gold “experts” have a correct understanding of gold market fundamentals. They dwell on trivia.


Look at what we see around us today. These self-proclaimed experts debate whether or not the price of gold should rise above $1,300/oz. They point to North Korea. They point to incremental changes in demand for some of the major gold-consuming nations. Irrelevant.


The fact is that thanks to the success of the banking crime syndicate in discouraging the buying of (real) gold in the Western world, total gold demand hasn’t increased by that much. The largest, single incremental change was the switch by central banks from being net-sellers to net-buyers of gold. That was a very significant change, but it has flattened out and there is no indication that this will change further over the short term.


The fact is that (despite all the rhetoric) there is very little chance of any actual hostilities between the United States and North Korea. Discounted for this small probability, this is not a major driver of the price of gold.


The most ludicrous influence – and distraction – to the price of gold has been U.S. interest rates. High interest rates are a negative driver for the price of gold. The reasoning goes like this.


If savers can obtain a positive interest rate on their savings then they have an incentive to hold paper instead of gold. What is a “positive interest rate” in this context? If the interest rate on their savings is higher than the rate of inflation, then that is a positive interest rate.


If the savings rate is lower than the rate of inflation, savers lose money by putting it in the bank, and they are much better off holding gold instead.


Are current interest rates high? No, they are the lowest rates in history. This is despite the fact that B.S. Bernanke and all the other central bank liars promised to immediately normalize interest rates in 2009 – meaning in the range of 3% - 5%.


Today, after nearly nine years, the U.S. interest rate is at 1%. Meanwhile, real U.S. inflation has hovered between 4 – 8%, according to John Williams of Shadowstats. U.S. interest rates would have to rise by at least another 3%, just to begin to be a negative driver for the price of gold.


Current interest rates are a mildly positive driver for the price of gold. Otherwise, for the last nine years, everything said and done by the Federal Reserve with respect to U.S. interest rates has been totally irrelevant to the gold market.


If we combine every other variable that influences the price of gold, even put together they don’t come close to equaling the impact of the Bernanke Helicopter Drop. The U.S. dollar is now worthless.


It is backed by nothing. It has been diluted more than any other major currency going back a hundred years. The U.S. government is bankrupt. The U.S. dollar is currently being phased out as reserve currency – meaning the demand for U.S. dollars is shrinking to a fraction of previous levels.


What is the price of gold (or any hard asset), denominated in a worthless currency? The price is infinite. What is the current price for gold, denominated in worthless U.S. dollars? $1,300. The Crime of the Millennium.


For those readers who are still not convinced, just listen to Bernanke’s own words.


U.S. dollars have value only to the extent that they are strictly limited in supply.


- B.S. Bernanke, November 21, 2002 


Strictly limited in supply.


According to the former Chairman of the Federal Reserve, the Bernanke Helicopter Drop rendered the U.S. dollar worthless. That is why the Federal Reserve has falsified more recent versions of the chart above – to hide the dollar’s worthlessness. The phony chart produced by the Federal Reserve today bears no resemblance to what has actually happened to the U.S. dollar.


The U.S. government, the Federal Reserve, and the mainstream media pretend that the U.S. dollar still has value. They pretend that the price of gold should be at $1,300/oz (or less).


Ignore the trivia. Ignore the liars and idiots in the media. Ignore the Federal Reserve and all of its utterly pointless “meetings” about the U.S.’s irrelevant interest rates. Follow the money. It leads up – way, way up.


Questions or comments about this article? Leave your thoughts HERE.


Written by Jeff Nielson, Sprott Money News


Sunday, September 24, 2017

"Japan Has No Illusions That Rates Will Ever Rise": Is This What The Endgame Looks Like

By Victor Shvets of Macquarie Capital


Japan Debt Mountain: does it matter?


For almost 25 years, Japan’s debt burden has been the poster child of what would happen to others if capital is misallocated, bubbles burst and then clearance and required reforms are either delayed or not implemented. Indeed, at more than 5x GDP, Japan is shouldering a greater debt burden than other key jurisdictions. It is also facing severe demographic challenges, while its labour market remains constrained and the state maintains a sway over the private sector. Since WW II, Japan has always been more statist than most other major economies, with Korea and China subsequently following Japan in developing a similar model. The conventional argument has been that Japan’s debt would ultimately crush its economy and severely crimp public sector spending, while the private sector would be unable to adjust, and hence lose competitiveness. Eventually, the private sector might lose confidence and stop repatriating cash and the country would then suffer from massive capital outflows.


Not only were these dire projections wrong for decades, but as the rest of the world joined Japan in secular stagnation and unorthodox monetary policies, it is no longer perceived as an exception but rather as a pointer to the future. Japan’s success in navigating disruption, deep financialization and permanent overcapacity is now studied and imitated. While there are local nuances, Japan shows the way forward. QEs associated with the Fed were invented in Japan more than a decade earlier. The same applies to fiscal stimuli, collapsing velocity of money and strong disinflation. Whatever are the policies, Japan has already tried them. Japan is far more advanced in fully monetizing its debt by utilizing multiple asset classes, from bonds to equities. It also accepts that normalization is not feasible, and unlike the Fed, it has no illusions that rates could ever rise or that immigration and deep labour market reforms are either possible or desirable. When the US is focusing on returning outdated factories, Japan is building for the future, when labour inputs would no longer be the key.


Although Japan’s cultural and labour market constraints reduce its ability to fully commercialize inventions, it has not prevented the country from maintaining its rating as the most complex economy in the world, while keeping leadership in patents and yielding above-average labour and multi-factor productivity. Japan’s stagnant domestic economy is overshadowed by its competitive externally-facing sectors that are becoming complementary rather than directly competing against China. Even financial repression that Japan practised for decades is becoming a global norm, nowhere more so than in Eurozone. We expect BoJ to quietly abandon its inflation targets while maintaining flexibility in asset acquisitions to keep cost of finance close to zero. This would be a recipe for continuing twilight for years to come, with debt burden neither derailing the economy nor financial markets, even as BoJ assets rise beyond 100% of GDP (~45%+ of JGBs).


Assuming that Abenomics is dead and that there is neither desire nor capacity to lift inflationary outcomes, then it would be positive for ¥. Higher ¥ would erode Topix’s ROEs (corporate governance is unlikely to offset lower returns) but it should also highlight the strength of its globally competitive and thematic plays. In our global portfolios we currently have Yaskawa, Fanuc, Mitsubishi Electric, Nintendo, Nidec, Murata, Keyence, Tokyo Electron and Yamaha. Any further ¥ appreciation should also reduce pressure on Korea and China while extending EM reflationary cycle and its investment ‘goldilocks’.


Why is Debt Mountain not crushing Japan?


“We know that advanced economies with stable governments that borrow in their own currency are capable of running up very high levels of debt without crisis.”


       — Paul Krugman


This quote by Paul Krugman neatly encapsulates the main reasons as to why Japan has not been crushed by ever-rising public sector debt. Japan is state with a high degree of credibility and it borrows almost exclusively in its own currency, with debt owned predominantly by its own citizens. Financial crisis is all about perception rather than reality.


However, one issue that Krugman has not emphasized but which is increasingly important is the ability of central banks (CBs) to support and distort the governments’ cost of funds. Given that the CBs are not economic agents, their bids and bond acquisitions are not designed to discover appropriate pricing levels, but rather to support governments’ objectives (usually to simulate economies by lowering cost of capital). In the past, such aggressive interventionist policies were unique and infrequent events (accompanying wars or other major dislocations), but over the last two decades, they have become an increasingly acceptable tool in the governments’ armoury. Japan has been leading from the front for more than two decades, followed by the rest of the world after GFC.


Thus, there are essentially four reasons as to why most bets against Japan failed on a consistent basis:


  1. Japan is a homogeneous society, with relatively egalitarian income and wealth distribution, and hence, pain has been shared fairly evenly, thus preserving economic and societal coherence.

  2. Japan maintained credibility by selectively boosting and adjusting national commitments to elderly and medical care while irregularly pushing up consumption tax. Although some of these measures were counter-productive on a longer-term basis, they have placated global markets.

  3. Japan borrows in its own currency and the bulk of JGB holders are Japanese residents (over 88%). This massively reduces the degree of external vulnerability.

  4. BoJ has been exceptionally aggressive in driving money supply up and cost of capital down. This aggressiveness coincided with the growing global disinflationary trend, which eroded bond yields and significantly reduced the proportion of the government spending that is spent financing interest commitments.

As can be seen below, despite massive rise in the governments’ gross and net debt burden, the proportion of state spending that is dedicated to servicing interest has declined significantly over the last decade and is now below 5% of total expenditure.


The extent to which BoJ has become the key to Japan’s perceived longer-term sustainability can be seen from the explosion of its balance sheet and how its asset base increased at a pace much faster than state requirements. BoJ has by now accumulated almost 45% of the entire JGB’s market (vs 10% only five years ago), and its balance sheet is rapidly closing on 100% of the country’s GDP (vs 37% G4 average). Also, BoJ is not just buying state paper but it has become actively involved in the corporate and ETF (equities) markets. BoJ already controls 75% of all of Japanese ETFs (although only 4% of overall equities) and as much as 15% of the Japanese corporate bonds.


The public sector over the last two decades did not really have an option but to become far more aggressive in transferring excess debt from private sector and onto government books. While this private sector de-leveraging was largely complete by 2005, the combination of GFC as well as subsequent earthquake (2011), continued to suppress private sector desire for more aggressive spending. Private sector sectoral savings even today remain at ~6% of GDP, whilst velocity of money is at best only stabilizing.


If public sector did not step in, the country would have undergone a massive and uncontrolled deflationary bust. Instead, Japan had simply kept its nominal demand intact, despite the private sector sustaining losses (real estate and equities) of equivalent to 100% of Japan’s GDP in ‘90/91 (or ~US$5 trillion). For perspective, consider that the GFC caused initial contraction of only around 1/3 of the US GDP. In other words, bursting of an asset bubble in the ‘90s Japan was at least three times more powerful than the GFC’s impact.


The net outcome of aggressive public sector policies offsetting sluggish and deleveraging private sectors was a ‘tranquil autumn’ of a civilized relative decline.


The Japanese economy is today a fraction of its importance several decades ago. Whereas in the late ‘80s, Japan was responsible for ~10% of global merchandise exports, its share is now below 3.8%. In the same period, Germany’s share eased from 10%-11% in ‘80s to around 8%, while the US’s share is down from 12% to ~9% and France’s share is down from 5% in the ‘80s to ~3%. The same occurred to Japan’s share of global GDP (whether on a nominal or PPP basis). The growth rates have compressed massively, but the country managed to maintain its overall aggregate demand and per capita income intact.


Japan emerged from this traumatic experience, as land of no inflation (indeed mild deflation for most of the time) and steady demand funded by the fiscal stimulus and resilient private sector productivity.


It has become a land where the central bank has been effectively cancelling national debt by acquiring more securities than the government needed to fund its deficits. While this poses many questions (such as ability of life and insurance companies to price their products, in the absence of a viable JGB market), it also implies that Japan is shifting closer to embracing far more extreme (but necessary) policies, such as minimum income guarantees and abandoning any further consumption taxes.


In the world where labour inputs are becoming increasingly less relevant and where robotics, automation, AI and social capital are likely to play an increasingly important role, even the traditional argument of a negative impact of demographics no longer dooms Japan to oblivion and collapse. It also implies that the conventional arguments in favour of large-scale increase in immigration is not only irrelevant but is likely to be faulty on both theoretical and practical grounds. It is likely that the current age of ‘declining return on humans and conventional capital’ will become far more pronounced over the next decade. It so happens that Japan is in the forefront of this evolution.


It is highly unlikely that Japan would ever accept large-scale immigration (whether it applies to high or low skill labour). It is equally unlikely that the Japanese themselves would ever prefer to work and live in foreign jurisdictions. At the same time, the pace of human replacement (whether it is waiters in the restaurants or nurses in hospitals) is accelerating in Japan at a far more robust pace than elsewhere. The unique nature of Japan is also translating into sustainably high levels of private sector productivity while containing income and wealth inequalities. Although Japan is today more unequal than it was in  late 1980s-early 1990s, it still remains one of the most egalitarian societies in the world.


While Japan is yet reluctant to accept the most radical of policies, it is far more advanced in fully monetizing its debt burden and unlike most other countries it no longer requires an ever accelerating pace of financialization (or addition of new debt-driven generations). The objective in Japan is to maintain per capita income rather than generating growth to accommodate a rising population and keeping society intact. The extent to which Japan would be able to achieve this objective would depend critically on Japanese corporates and its overall economy maintaining productivity gains.


* * *


In part 2 tomorrow: "Global lessons from Japan - the future is Red"

Monday, September 11, 2017

Poverty, Prosperity, and Precious Metals

Written by Jeff Nielson, Sprott Money News


In the 20th century; by the end of the 1960’s, Western societies and especially Canada and the United States reached a level of prosperity never seen before – or since. Since the early 1970’s; the standard of living across the Western world has been in a relentless trajectory downward.


An article from April 2012 noted that the standard of living in the United States had already fallen by more than 50% since its zenith. Since that time, the standard of living in the U.S. (and across the West) has been devoured by 5 ½ years more “inflation” – the same “inflation” that the criminal bankers and corrupt politicians insist does not exist.


At the end of the 1960’s; a chocolate bar cost a dime. Today, a smaller version of that same chocolate bar costs close to a dollar. That 90% loss in purchasing power of the paper in our wallets is all inflation.


The beginning of the collapse in our standard of living in the early 1970’s wasn’t the only event of note at that time. The early 1970’s also marked the end of the gold standard.


Coincidence?


From the end of World War II until the end of the gold standard, the standard of living across the Western world went almost straight up. Since Paul Volcker assassinated the gold standard, our standard of living has gone straight down. Seventy-five years of “coincidence”?


Of course not. The Criminals themselves have already confessed to their crime.


In the absence of the gold standard, there is no way to protect savings[wealth] from confiscation [theft] through inflation.


- Alan Greenspan


The correct, economic definition of inflation is simple: an increase in the supply of money. Print and steal. The bankers print more of their funny-money, and that dilution causes the value of the sunny-money to decline.


Where does the wealth go? Where has the 90% loss in the purchasing power of our paper gone since the bankers assassinated the gold standard? Into the bankers’ vaults.


All of the new funny-money that is printed up is handed to the Big Banks. The Big Banks, and only the Big Banks (and their oligarch owners) are immune to the crime of print-and-steal. Everyone else loses.


For 1,000 years, this has been the bankers’ Game. That is why for 1,000 years, every one of their paper fiat currencies has gone to zero. Print-and-steal long enough and eventually you reach zero.


The affluence of the end of the 1960’s was obvious: two-car garages, with only one wage-earner. Virtually everyone who wanted to own their own home could afford to do so, with no more than a 20-year mortgage.


Today, with the typical family, it’s two wage-earners and a one-car garage – for the fortunate minority who can afford to live in their own home. For many of the Working Poor, it’s two wage-earners, an apartment, and no car. And they are still luckier than many: the Homeless People. No car. No roof.


This is what 45+ years of print-and-steal has produced. Readers have been previously alerted to this crime against humanity.


At first glance, this chart may be indecipherable to some, insignificant to others. Look closer.


We see that even though the West and India have nearly identical populations, the West has more than 20% more of the poorest-of-the-poor. When we compare the West with Africa, we see that the West (with a slightly greater population) hosts a slightly greater percentage of the poorest-of-the-poor. In proportionate terms; the West and Africa have roughly identical percentages of the poorest-of-the-poor.


Let me repeat this. When it comes to the poorest people on Earth, as percentages of our populations, there are now more of the poorest-of-the-poor in the West than in India, and a virtually identical percentage when compared to Africa.


To be clear, when considering starvation-level poverty, the plight is still worse in so-called Third World nations. However, when it comes to the lowest two deciles of wealth (the bottom 20%), in proportionate terms there are more of such people in the West than in India – and the same amount as in Africa.


Things aren’t much better for the 30% of the population right above that.


About half of Canadian workers living paycheque to paycheque: survey


Print and steal. From one wage earner and a two-car garage to “paycheque to paycheque”.


Print and steal. The bankers’ Crime can’t continue for another 45 years because print-and-steal does more than impoverish populations. It bankrupts entire societies.


Global Debt Hits 325% Of World GDP, Rises To Record $217 Trillion


Most of this debt has been created in the West: 10% of the world’s population, more than half of the world’s debts. Debt Jubilee is now inevitable in the West. For most of the Rest of the World it will be a matter of choice: not allowing only the West’s Deadbeat Debtors to walkaway from their debts.


Greece already tried for its own Debt Jubilee – after its economy was totally destroyed by the economic terrorism of the One Bank. The bankers said “no”, telling this bankrupt nation that it had to borrow more money. How perverse is that?


As the holder of all these (illegal and unenforceable) debts, the One Bank will try to delay Debt Jubilee as long as possible. Until then, it is just more print-and-steal. But we do not have to be victims.


Our corrupt governments refuse to protect us from print-and-steal by resurrecting the gold standard. So there is no protection available at the Systemic level. However, we can still protect ourselves as individuals.


Regular readers and astute investors know the antidote to print-and-steal: precious metals. The logic could not be more elementary.


The crime of print-and-steal is how the bankers loot the wealth from inside our paper. How do we protect ourselves? We don’t hold our wealth inside the bankers’ paper. We store our wealth in gold and silver. There it is safe from the One Bank.


Forget about the phony paper prices for gold and silver. Their only significance is a favorable exchange rate when we jettison more of the bankers’ paper.


With our wealth safely stored in gold and silver, all that the Criminals are capable of doing is to temporarily depress the paper exchange rate – they are the Rulers of all that (fraudulent) paper. They can do no more than that. And even here it is important to maintain perspective.


Two thousand years ago in ancient Rome; with a one-ounce gold coin a gentlemen could purchase a suit of the finest clothing, along with accessories – a hand-made toga, belt, and sandals.


Five hundred years ago; with a one-ounce gold coin a gentleman could purchase a tailor-made suit, along with accessories.


Today, despite decades of the One Bank attacking the price of gold, with a one-ounce gold coin we can still buy a suit and accessories. We just have to buy “off the rack”.


Compare that to the 90% loss in purchasing power with the bankers’ paper. There is no comparison. Safety, or financial rape.


Paper = poverty. Precious metals = prosperity. It is a simple equation.


For a small number, they can earn more wealth even faster than the bankers are stealing it. For everyone else, the bankers’ paper is a one-way ticket to poverty.


Ignore the paper prices. Remember the equation. It may be your only financial hope.


Questions or comments about this article? Leave your thoughts HERE.


Written by Jeff Nielson, Sprott Money News


Saturday, July 22, 2017

How The Elites Betrayed Working-Class America

Authored by Bill Bonner via InternationalMan.com,


Win-win deals get people more of what they want. Win-lose deals – usually imposed by government – bring them less. The few (the insiders) use government to exploit the many (the rest of us).


Win-lose deals also depress economic progress for everybody. Partly, this happens for an obvious reason.


Dropping the atom bomb on Hiroshima was a technical milestone, but not the kind of progress we’re talking about. Progress only makes sense if it means that people are able to get more of what they want.


By definition, when a person is forced into a bad deal, he gets less of what he wants.


Progress is also a learning process. You try something. You see what works and what doesn’t. As people experiment in this way, they learn… and the economy accumulates knowledge and wealth.


They learn to get to work in the morning, for example… to say please and thank you… to save their money… and to invest it wisely.


Win-lose deals interrupt the learning process. That’s why welfare programs fail: People get money without learning.


Temptation to Cheat


That is the real reason the Soviet Union failed, too.


Consumers were forced to buy whatever shoddy products were made available to them; producers had no way to learn how to make good ones.


Toward the end, products available for purchase in the Soviet Union were worth less than the raw materials and labor that went into them.


What do you need for win-win deals?


Three things:


1) People must be free to make choices with their time and money.


2) They must have money they can trust.


3) They must trust each other to respect their rights and property.


These things don’t happen smoothly and without interruption.


Progress is cyclical. Win-win deals add wealth and move society forward. But they depend on trust. And as trust increases, so does the temptation to cheat. When everyone leaves his liquor cabinet open, for example, who can resist having a drink?


Then trust declines. Barriers go up. Costs increase. Win-win gives way to win-lose. Progress goes into reverse.


Money You Could Trust


The invention of real money – based on gold – gave a boost to win-win deals… and to progress.


Why?


It was money you could trust.


If you are paid a gold coin for a day’s labor, you don’t have to trust the person who pays you. You don’t have to wonder if he has the money in his account to cover his check… or what will happen to his money in the future.


You don’t have to trust him; you put your trust in gold. This allows you to do transactions more freely – and speeds up economic progress.


Gold-backed dollars were trustworthy for nearly 200 years (setting aside Lincoln’s phony “greenbacks”).


People became so confident in the integrity of the dollar that they hardly noticed when the gold backing was removed (on March 19, 1968, when President Johnson signed a bill eliminating the “gold cover” for Federal Reserve notes).


But that’s the way it works: The more trusting people become, the easier it is to rip them off.


Set Up by the Elite


Of course, as trust expands and win-win deals proliferate, some people gain more than others.


The typical Chinese day laborer makes six times as much today as he did in 1999. The typical American day laborer has gained little.


And job competition from overseas made him feel like a loser. Now he wants walls – to keep out foreigners and foreign-made products. He wants win-lose deals that guarantee to make him a winner again.


He has no idea that he was set up by his own elite.


Former Fed chiefs Ben Bernanke and Alan Greenspan got their pictures on the cover of Time magazine. Most people think they are heroes, not rascals. Most people think they saved the economy from another Great Depression by dropping interest rates and injecting it with trillions of dollars in quantitative easing (QE) money.


Most people – even the POTUS – believe we need more fake money to “prime the pump” and get the economy rolling again.


Almost no one realizes it, but it was these stimulating, pump-priming, new credit-based dollars that fueled the trends that ruined America’s working-class wage earner.


Overseas, his competitors used cheap credit to gain market share and take away his job. At home, the elite imposed their crony boondoggles… their regulations… and their win-lose deals – all financed with fake money.


The average American’s medical care now costs him more than seven times more than it did in 1980. His household debt rose nearly 12 times since 1980.


Subtle “Bezzle”


He blamed the Chinese, the Mexicans, the liberals… the media… and the government.


He wanted change.


But who would have guessed that he had been ripped off by his own untrustworthy money?


After you account for inflation, the American worker has not had a significant raise in 40 years – almost since the new money system was put into place after 1971.


But the rich – as measured by the inflation-adjusted Dow – are 10 times richer.


Who would have imagined that after 3,000 years, the elite would have come up with money that betrayed his trust… a “bezzle” so subtle that he didn’t even notice?


*  *  *


Recently we’ve been wondering if it’s possible that America could be on the brink of a second civil war. We did some digging… and while the stuff we found may offend and shock you… We recommend you take a look anyway by clicking here.

Thursday, June 1, 2017

Deutsche Bank Calculates The "Fair Value Of Gold" And The Answer Is...

Over the past three years, gold has found itself in an odd place: while it still remains the ultimate "safety" trade and store of value should everything go to hell following social and monetary collapse, when it comes to "coolness" it has been displaced by various cryptocurrencies, all of which have vastly outperformed the yellow metal in recent months. Meanwhile, central banks continue to pressure the price of gold to avoid a repeat of 2011 when gold nearly broke out above $2,000, putting the fate world"s "reserve currency" increasingly under question. As a result, gold has traded in a rather somnolent fashion, range bound between $1,100 and $1,300 over the last few years, failing to break out on either side.


But is that a fair price for gold?


That is the question Deutsche Bank"s Grant Sporre set out to answer in a special report released overnight, which among other things finds that gold is a "metal" full of paradoxes.


Here is what Deutsche Bank found: as Sporre contends, in order to determine whether gold is cheap or expensive, one must first define what gold actually is.


At its simplest form and yes we are stating the obvious, gold is a shiny yellow metal, relatively scarce and mined from the earth’s crust. Valuing the metal should then be just as easy? Gold is a simple commodity, governed by supply and demand, and valuing it should bear some relationship to the cost of digging it out of the earth? But it turns out; gold’s nature is far more mercurial. Gold can be many things to many different people – a store of value, a financial asset, a medium of exchange, a currency, an insurance policy against disruptive events or global uncertainty and even a “barbarous relic*” according to John Maynard Keynes. (*As with any famous quote, there are suggestions that the term was not originally coined by Keynes himself, nor that he was actually referring to gold, but rather to the constraints of the gold standard at the time).


All of this means that finding an absolute valuation method which will be accepted by all is rather optimistic; and that the value of gold is more likely to be determined on a relative basis depending on the individual’s perception of gold.


Whilst we contend that there is something of an art to valuing gold, we have used a more scientific framework to come up with that true fair value. There are flaws in any one of the individual approaches, and even averaging out the different approaches still seems like a bit of a cop out. However, in our table below the average of all the selected metrics would suggest that gold should trade around USD1,015/oz, with relative G7 per capita income valuing gold at USD735/oz, whilst the bloated size of the big four central bank balance sheets suggesting that gold should travel at USD1,648/oz.


Here is a summary of DB"s findings:


And DB"s take: the reason why gold is trading with a roughly 20% premium to "fair value" is because "there is a heightened perception of risk or uncertainty in the broader markets."


Although gold screens as expensive, there is a short term scenario (3 month) which would justify gold trading higher, in our view. In the near term, our US rates economist Dominic Konstam sees scope for the US 10-year bond yield to fall to 2% (before rising to 2.75% by year-end), as falling excess liquidity points to softer US growth momentum ahead. If we apply a US 10 year bond yield of 2%, a USD 2% weaker from current levels (not our FX strategist view) and the S&P500 down 5% from current levels, our fair value model points to a gold price of USD1,320/oz.


Our own simple four factor model points to a value of USD1,185/oz. Our conclusion is that gold is still trading at a premium versus a wide variety of metrics; 20% versus the average or 6% versus our fair value model. This suggests to us that the certainly through the lens of gold, there is a heightened perception of risk or uncertainty in the broader markets.


And some additional thoughts from DB on how it scores gold"s value across its various roles in society:


* * *


Gold as a commodity – scarce but always in surplus?


Many investors are uncomfortable with treating gold as a commodity in that gold is not “consumed” like other commodities – it is not eaten, or burned or forged as food, energy or industrial metals would be. At first glance the price of gold relative to the marginal producer on the cost curve would provide a perfect yardstick to determining the fair value of gold. There are however two fundamental problems with this method. The first is that the conventional supply demand analysis does not work very well for gold. Partly due to its value and enduring nature (and high incentive to recycle), very little gold is actually consumed or lost every year. Thus every year, we add to the stocks of gold, with the industrial surplus being “consumed” by financial investors. We would argue that even the jewellery market is not “pure” consumption and the motivation is linked to a store of wealth.


Gold’s price trajectory relative to the marginal producer on the cost curve should be reasonable determinant of value. However, the mined supply of gold is relatively stable and only responds to pricing signals with a four to five year lag. Gold has been falling since 2012, the bump in 2016 notwithstanding and we only forecast mined supply to finally decline in 2017. It turns out, the gold miners are very good at adjusting their cost bases to the prevailing gold price, not least by targeting the richer parts of their ore bodies. The practice of “high grading” is much frowned upon in the industry, as certain less economic  parts of the ore body may be sterilized thereby reducing the NPV of the mine. However, when faced with significant cash burn, many miners have little choice.


If indeed gold is a commodity, gold’s perceived value relative to copper and oil should revert to a long run equilibrium level, based on the relative abundance of various commodities in the earth’s crust. There is no doubt that gold is scarce relative to copper for instance (10,000x less abundant). However the perception of utility will vary according to global growth. In a high global growth environment, copper should be seen as more valuable relative to gold.


* * *


Gold as Money – a medium of exchange with little intrinsic value?


Gold is often seen as a medium of exchange and one that is officially recognized (if not publically used as such) in our view. Simply, gold is widely held by most of the world’s larger central banks as a  component of reserves. The ideal medium of exchange must balance the paradox of representing value while having little intrinsic value itself. Fiat currencies physically have no use other than that which is ascribed to them by government and accepted by the public. Arguably, gold is a purer form of money because it actually costs something to produce, compared to fiat currencies which cost very little. However, the concept of relative scarcity or abundance comes into play. If the rate at which fiat currencies have been printed exceeds that rate at which gold has been mined, then ceteris paribus, gold should become scarcer and rerate versus fiat currencies. Since 2005, central bank balance sheets have expanded nearly fourfold. In contrast the global above ground stocks of gold have expanded a mere 20%. The gold price has rerated accordingly, but not enough to keep the value of gold at parity with the global (big four central banks to be precise) money stock. The average ratio since 2005 between global money stocks and the value of global gold stocks is c.1.8x. In order for gold to get back to this level, the price should appreciate to USD1,648/oz, nearly USD300/oz above the current spot price.


If we assume that gold reverts to the long run ratio of these two commodities, then at an oil price of USD50/bbl, gold should be trading at USD840/oz, and at a copper price of USD5,600/t, gold should be trading at USD960/oz. Gold remains expensive versus other commodities


* * *
Gold as a store of value – capital appreciation but no yield


We all need ways to store the fruits of our physical or intellectual labour for use at a later stage. We all have our preferences, be it bricks and mortar, the equity markets or gold. It depends on your confidence in how well you believe your asset of choice will preserve and in many instances grow your wealth or capital. We have examined the level of the gold price in real terms i.e. versus US CPI, relative to the per capita income and versus an alternative financial asset, the US equity market.


In terms of the relationship between gold and the S&P500, we have adjusted both for inflation and applied a further equity time value adjustment. Both should rise with inflation, but the S&P 500 should rise more and its retained and reinvested earnings should generate real EPS growth. We find that the adjusted gold to S&P500 ratio at 0.65x is still above its historical average of 0.54x. To bring this ratio back to its long run average would require the gold price to fall to USD990/oz. The average G7 per capita income since 1971 could buy just over 62 ounces of gold. Currently the average per capita income can purchase 47 ounces which implies that gold should trade at USD740/oz.


The real gold price average since 1971 when the gold standard was relinquished in the US is USD735/oz in PPI adjusted terms and USD810/oz in CPI adjusted terms.


Gold as a measure of market uncertainty


In order to adjust for the current gap between the actual gold price and our model forecast, we have adjusted our model (yes all models have dummy variables to account for the periods when they don’t quite work) for global risk perceptions. The adjustment we apply is simply a risk perceptions adjustment factor derived by plotting the model residual against the VIX index. We note that any significant period above 20 on the VIX index causes gold to trade above its “fair value”. The scale we apply ranges from -20 to 20, with each point accounting for USD10/oz. This is the minimum and maximum range of the deviation. The current gap of USD80/oz or 8 on our scale would suggest an above average sense of risk or uncertainty in the market. If we apply the DB house view forecasts at year end for the US 10 year bond yield of 2.75%, a US 10 year break even of 2.15%, an S&P year-end target of 2600, IMF gold purchases of 5 tonnes and a USD up 7.6% versus the broad trade weighted basket, then gold should trade all the way down to USD1,031/oz. Even if we increase our risk perception index from 8 to 12, this brings us back to USD1,150/oz by year end. In the near term however, our US rates economist Dominic Konstam sees scope for the US 10-year bond yield to fall to 2% (before rising to 2.75% by year-end), as falling excess liquidity points to softer US growth momentum ahead. If we apply a US 10 year bond yield of 2%, a USD down 2% from current levels and the S&P500 down 5% from current levels, our fair value model points to a gold price of USD1,320/oz.


Saturday, May 6, 2017

Bank Of Japan "Bought The Dip" Over Half The Time In The Last 4 Years

A year ago, we noted that The Bank of Japan (BoJ) was a Top 10 holder in 90% of Japanese stocks. In December, we showed that BoJ was the biggest buyer of Japanese stocks in 2016. And now, as The FT reports, the real "whale" of the Japanese markets is stepping up its buying (up over 70% YoY) entering the market on down days more than half the time in the last four years.


Since the end of 2010, The FT notes that the BoJ has been buying exchange traded funds (ETFs) as part of its quantitative and qualitative easing programme. The biggest action began last July, when its annual acquisition target was doubled to ¥6tn. Since then, the whale designation has seemed pretty obvious: the central bank swallows a minimum of ¥1.2bn of ETFs every single trading day (tailored to support stocks that further “Abenomics” policies), and lumbers in with buying bursts of ¥72bn roughly once every three sessions.


Some traders say the bank’s supposedly targeted buying has cushioned the whole market. Last year, foreign investors were net sellers of ¥3tn of Japanese shares - a retreat that might have decimated benchmarks had the BoJ not swum in with ¥4.3tn of support via ETFs.


In the afternoon sessions on days the BoJ comes in big, the average return on the index is about 14 basis points higher.


Since the annual quota was increased to ¥6tn, Nomura says, the BoJ has provided a cumulative boost to the Nikkei of about 1,400 points.


But, as we"ve noted in the past, it appears to be the flow, not the stock, that is the big driver...


As in a casino, The FT"s Joe Lewis concludes, the whale definition may hinge less on the cash on the table and more on the psychological impact on other gamblers. The BoJ has been at the game long enough for the market to know it reliably buys on weakness.


Of the 1,038 business days between April 2013 and March 2017 there were 449 sessions where the market was down: the BoJ bought on more than half of them. Whale or not, investors are now primed to think they are swimming with one.


So given that we know SNB is extremely active in stock markets, and The BoJ is the Japanese stock market, does anyone realistically doubt The Fed is/has been active?

Monday, March 27, 2017

Putting Pennies in the Fusebox, Report 26 Mar, 2017

Back in the old days, homes had fuse boxes. Today, of course, any new house is built with a circuit breaker panel and many older homes have been upgraded at one time or another. However, the fuse is a much more interesting analogy for the monetary system.


When a fuse burned out, it was protecting you from the risk of a house fire. Each circuit is designed for only so much current. The problem is that higher current causes more heat, and it can start a fire. So they put fuses in, which burn out before the wire gets hot enough to be dangerous.


The problem is that it’s annoying when a fuse burns out, especially when it’s the last one and the hardware store is far away and/or closed for the weekend. So people all too often put a penny in the place of the fuse. And then, human nature being what it is, they left it there long-term. As an aside, pennies in those days were solid copper, not the copper plated zinc they use today because it’s cheaper.


We would guess that a disproportionate number of house fires were started because an overloaded circuit became overheated, and the protective fuse was replaced with a penny that would keep the juice flowing no matter what.


So, what has that got to do with gold and silver? A penny in the fuse box is a perfect analogy for what President Roosevelt did in 1933. Many believe when he confiscated gold, it was to grab the loot. While we have no doubt that he and his cronies lusted for the gold of the people, he had a more serious purpose.


Until 1933, gold was the core monetary asset in the banking system. When people withdrew their gold coin—redeeming their gold, not buying gold—that forced the bank to sell a bond to raise the gold to redeem depositors. If a bank could not raise enough gold, perhaps because bond prices were going down, then the bank was bankrupt. Another problem is that falling bond prices mean rising interest rates.


Roosevelt was trying to stop the run on the banks, and trying to push interest rates down.


He did stop the run, and interest continued to fall through the end of World War II. However, his act was the monetary equivalent of the penny in the fuse box. In making it illegal to own gold, he made the dollar irredeemable for Americans. Gold is the only financial asset that is not someone else’s liability. Deprived of this outlet, people were forced to be a creditor. The only choice was to lend to the Federal Reserve, the US Treasury, a commercial bank, a corporation, etc.


When people are running to the bank to withdraw their gold coin, it’s like a fuse burning out. You really should find out the root cause when a fuse keeps burning out, and not just jam a solid copper conductor into the circuit. You really should find out why people keep pulling money (i.e. gold) out of the banks, and not just outlaw it.


The reasons were simple. The rate of interest was below the marginal time preference of the savers. This is, of course, the purpose for which any central bank is established: to enable the government and its cronies to borrow more cheaply. And the banks had become unsound (due in no small part to the actions of the Fed taken prior to 1933).


By corralling everyone in the banking system, FDR put a penny in the monetary fusebox. In 1971, President Nixon realized there was one last fuse that could still burn out and thereby signal that all was not well. Americans could not withdraw gold, but foreign governments could. And, led by France, they were doing. So Nixon “closed the gold window”, thereby inserting a second penny.


Now the system was perfect—perfectly irredeemable. Money is credit and credit is money and there is no longer a way for the market to express concerns about either interest rates or soundness. An individual can escape being a creditor if he buys gold (legalized in 1975, after gold was entirely demonetized), but his dollars simply trade hands. The seller of the gold gets the credit-dollars, and the buyer gives them up for the gold. There is zero effect on the banking system (other than causing the price of the dollar to go down).


Unlike the simple and elegant mechanism of the bank run in the gold standard, buying gold is awkward, clunky, and risky for the participants. With dollar-credit no longer being tied to gold, there is a price risk. And of course, price is the motivator for many participants.


Two people, call them Joe and Mary, could both be right that the dollar-credit system is headed towards a crisis. Joe bought at $1,060 in the last week of 2015. Unfortunately, Mary bought at $1,375 in July of 2016. Both bought because of the same reason. But Joe has a big fat gain of $183 and Mary has a loss of $132. This volatility makes people alternatively greedy and fearful, which is not really providing a good signal that the monetary system has problems urgently in need of addressing.


And so the system goes, careening around, from crisis to crisis and nothing gets fixed and there is no signal that is clear to everyone the way a run on the banks is clear.


With this backdrop, we note that the price of gold is on the rise again. Since its low around $1,120 late last year, it has been rising to its current price about $120 above that. What’s more, the fundamentals have been getting stronger at the same time. What could be causing this, and now?


Rising interest rates (which we believe is just a correction in the long falling rates trend) are putting more and more stress on banks and corporations alike. If you have borrowed short to lend long (as all banks do nowadays, this is called “maturity transformation") then rising rates cause immediate pain. Your cost of funding goes up instantly. However, the interest you earn on long-term bonds does not go up. Instead, the market price of those bonds drops. Equity is disappearing from your balance sheet.


Now consider major corporations, who too often borrowed in the short term bond markets. Their cost of funding is rising. Nearly every carmaker now offers 0% financing to qualified buyers. Their cost to offer this is now obviously much higher than it was a year or two ago. And that does not even count if they had used short-term borrowing to finance those loans, in which case their existing book is bleeding cash too.


This same pressure is occurring anywhere a vendor is financing its customers. The vendor can always try to pass through the increased cost. However, if buying volume was anemic previously with lower interest cost, it will only get worse when this cost goes up.


In the housing market, most people are monthly payment buyers. A higher interest rate means a lower price to get the same payment.


And what happens to lower credit corporations who issue junk bonds? Like most corporations they have to roll over their bonds when mature. So far, rising rates has passed over this market and junk bonds have held up. However, should this tide turn, many of these companies will be forced to default under a deluge of rising interest expense, if not softer demand for their products. They are junk credits for a reason, and higher rates can be the final straw.


Or let’s look at the pension funds. They are already badly underfunded. That is, they are already destined to arrive at terra firma. Many have bought equities and real estate in an attempt to juice up their returns. What happens if the prices of those assets comes down significantly?


Finally, let’s look at municipalities. They derive revenue from home building and turnover of not only homes but home furnishings, remodeling, etc. If these markets slow down significantly, their ability to service their debts is going to be taxed to the limits and beyond.


No wonder people are buying gold. Fundamental demand, as opposed to speculative, is when people buy gold coins and bars, presumably not to bring back to the market soon.


Below, we will show the only true picture of the gold and silver supply and demand. But first, the price and ratio charts.


The Prices of Gold and Silver


Next, this is a graph of the gold price measured in silver, otherwise known as the gold to silver ratio. It moved down this week.


The Ratio of the Gold Price to the Silver Price
The Ratio of the Gold price to the Silver price


For each metal, we will look at a graph of the basis and cobasis overlaid with the price of the dollar in terms of the respective metal. It will make it easier to provide brief commentary. The dollar will be represented in green, the basis in blue and cobasis in red.


Here is the gold graph.


The Gold Basis and Cobasis and the Dollar Price


The price of the dollar fell another 0.3 milligrams gold (this is the inverse of the rising price of gold, measured in dollars, +$14). However, this week, the cobasis (our measure of scarcity) decreased a bit. Gold buying this week was biased towards speculation. Last week, we said fundamental buying was a trend but it’s “sputtering”. This is an example.


Our calculated fundamental price of gold is up $3, or still about $160 over the market price.


Now let’s look at silver.


The Silver Basis and Cobasis and the Dollar Price


The story is the same in silver. The price rose, a bit more than the price of gold did. With the rising price, we see decreasing scarcity this week.


Our calculated silver fundamental price rose 4 cents, now about $0.85 over the market price.


We leave on a question today. When interest returns to gold and silver, which metal will have the higher rate? We plan to publish something about this soon.


© 2017 Monetary Metals

Saturday, March 11, 2017

Gold $10,000 Coming - "Time To Prepare Is Now"

<strong>James Rickards: Long-Term Forecast For $10,000 Gold</strong>


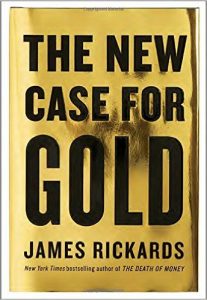
James Rickards, geopolitical and monetary expert and best selling author of the ‘The New Case for Gold’ has written an interesting piece for the Daily Reckoning on why he believes gold will reach $10,000 in the long term.


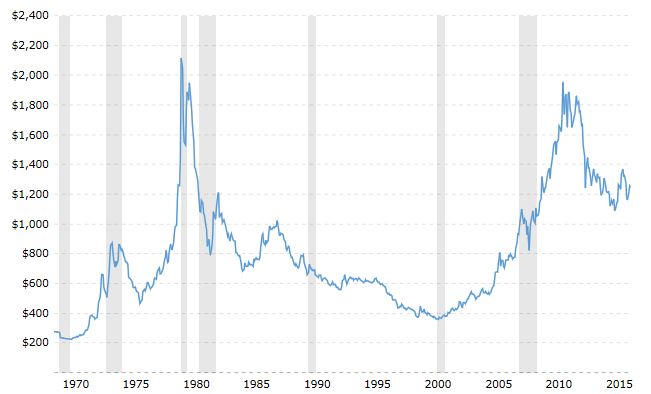
<img class="alignnone size-large" src="http://www.goldcore.com/ie/wp-content/uploads/sites/19/2017/03/gold-infl..." width="651" height="394" />


<em><strong>Gold in USD Adjusted for Inflation 1970-2017 – Macrotrends.net</strong></em>


He warns of the many systemic and geopolitical risks including the EU elections, from nuclear North Korea, tensions with Iran and <em>"rapidly rising tensions between the U.S. and increasingly powerful China in the South China Sea."</em>


<a href="http://www.goldcore.com/us/gold-blog/case-gold-wrong-james-rickards/" target="_blank">James Rickards</a> believes that the EU elections <em>"could potentially bring the future of the European Union into grave doubt"</em> and that the <em>"bottom line"</em> is that <em>"there are plenty of potential geopolitical shocks that could threaten the current system, in addition to existing concerns about a stock market collapse or debt crisis."</em>


<em><strong>"The time to prepare is now" </strong></em>advises Rickards.


<strong>From the <a href="https://dailyreckoning.com/path-10000-gold/?utm_source=hs_email&amp;utm_..." target="_blank">Daily Reckoning</a>:</strong>


<em>I believe the Fed is preparing to raise into weakness and will have to reverse course in April or May. What happens to gold then? It’s going to go higher again, because the Fed will cheapen the dollar, and that’s very bullish for gold. So I expect gold to take off in the spring and finish the year very strongly. It could challenge $1,300 or $1,400.</em>


<em>Now, as many of my readers know, my long-term forecast is for $10,000 gold. We’re obviously not there now. So how do I arrive at $10,000?</em>


<em>I want to give the basis for that forecast. I never give any forecast without giving the analysis behind it. Anybody can pull a prediction out if a hat. If you don’t have the analysis to back it up I’m not interested.</em>


<em>So let’s go through the math, because there is a solid mathematical basis for $10,000 gold. It’s actually the implied non deflationary price of gold under a gold standard.</em>


<em>The combined M1 money supply in the world is about 24 trillion dollars. That includes the United States, China, the Eurozone and Japan. Those four entities combine for over 70% of global GDP.</em>


<em>Now, the official gold in the world is about 33,000 tons. That’s not counting private gold, because private gold is not part of the money supply.</em>


<em>So if you wanted to restore a gold standard, how much gold do you need to back up the money supply? My estimate is about 40%.</em>


<em>Historically, central banks have run successful gold standards with less backing. In the 19th century, for example, the Bank of England only had about 20% gold backing. In most of the 20th century, the U.S. had 40% gold backing.</em>


<em><img class="alignnone size-large aligncenter" src="http://www.goldcore.com/us/wp-content/uploads/sites/7/2016/04/rickards_n..." width="207" height="300" />


I use the higher number, 40%, because I think a higher number might be needed to restore confidence in event of a collapse. The point is, 40% is a debatable, but reasonable figure.</em>


<em>Many people say there’s not enough gold to support the money supply. That’s one of the objections to gold standard. But my answer is that’s nonsense. There’s always enough gold to support the money supply. It’s a question of price.</em>


<em>Now, if you back 40% of the $24 trillion of money supply with the amount of official gold, it implies a gold price around $9,000 an ounce. But I predict $10,000.</em>


<em>So how do I arrive at $10,000 an ounce?</em>


<em>That’s because I expect central banks to print a lot more money by the time this issue comes to a head. So, by the time the printing presses stop running around the world, that $9,000 number will likely be in the range of $10,000.</em>


<em>The point is, $10,000 an ounce is not pie in the sky. It’s not a number I pulled out of a hat to get headlines. It’s the actual mathematical implied non deflationary price of gold. If you reintroduced a gold standard at a lower price, it would be deflationary. They’d have to reduce the money supply in order to bring it into alignment with the price of gold.</em>


<em>So I expect $10,000 is where gold will have to be, given the amount of official gold and the projected amount of printed money to give it 40% gold backing.</em>


<em>That’s the basis of my forecast. It’s rooted in history and sound monetary management. It’s rooted in simple mathematics. If anything, the number’s probably going to go higher. A year from now, that $10,000 figure might be even higher.</em>


<em>This is important because gold maintains a prominent place in the international monetary system, despite what elites say.</em>


<em>If gold is not money, if gold is not part of the monetary system, if gold is just a commodity that people trade, my analysis wouldn’t apply. But I believe that gold is money, and it always has been.</em>


<em>Gold has always been at the base of the international monetary system. To a certain extent it still is, whether or not central banks or the elites want to acknowledge it.</em>


<em>If gold was irrelevant, why does the U.S. have 8,000 tons? Why does the IMF have 3,000 tons? Why does Germany have 3,000 tons? Why has Russia tripled its gold supply in the last 10 years? Why has China more than tripled its gold supply in the last 10 years?</em>


<em>Why are they all hoarding and buying gold if it has no role in the monetary system?</em>


<em>The answer of course is that it does, but the monetary elites would just as soon not talk about <a href="http://www.goldcore.com" target="_blank">gold bullion</a>.</em>


<em>If you had the power of a central bank, why would you want gold to be part of the equation? It takes away their freedom to print money. Nobody kind of gives up power voluntarily, but they many not have a choice. A monetary system anchored to gold might be required to restore gold in event of another financial collapse.</em>


<em>The next question is, what’s the catalyst that could send gold soaring from today’s levels to $10,000 an ounce?</em>


<em>There are several potential catalysts.</em>


<em>It goes back to the avalanche metaphor I’ve used many times. Once enough snow builds up on the mountainside, it becomes unstable. At some point one snowflake will be the trigger that creates an avalanche.</em>


<em>Do you blame the snowflake or do you blame the instability of the system? The answer is you blame the instability of the system. One particular snowflake may have caused it, but the instability of the system is the real cause.</em>


<em>The current monetary system is unstable, the snow is piling up, and any number of snowflakes could trigger the avalanche. It’s hard to know exactly which one will be responsible, but it could be a geopolitical shock.</em>


<em>Iran recently deployed its navy to conduct exercises in all the important maritime choke points in the Middle East. President Trump has said if those Iranian speed boats get too close to our ships we’re going to blow them out of the water. We haven’t yet, as the navy’s rules of engagement have not permitted them to.</em>


<em>But now President Trump is apparently giving the green light. And the other day an American ship had to adjust course after an Iranian vessel came within 600 yards of it.</em>


<em>So with the Iranians testing us and the navy on full alert, how long will it be before there’s an incident where one of these boats is blown out of the water and maybe trigger something much larger?</em>


<em>That’s one example, but there are many others.</em>


<em>North Korea just conducted four ballistic missile tests that landed in the Sea of Japan. North Korean nuclear weapons will fairly soon be able to target the U.S, west coast. The U.S. is not going to allow that, and the State Department has said the U.S. is prepared “use the full range of capabilities at our disposal against this growing threat.” So we’ll probably have to attack North Korea if we can’t get China to rein them in.</em>


<em>The South China Sea is also another hotspot with rapidly rising tensions. China is flexing its muscles, pitting it against close American allies and American interests. One incident can easily escalate. There are many other geopolitical flashpoints that could trigger a major international crisis.</em>


<strong><em>Another triggering snowflake could be a natural disaster. Or it could be a political earthquake.</em></strong>


<em>The French elections are coming up over the course of two rounds in April and May. What if Marion Le Pen wins the election? I’m not forecasting that she’s going to win right now, but the market is underestimating her probabilities. We also have Netherland elections this month and German elections in October.</em>


<strong><em>The outcome of these elections could potentially bring the future of the European Union into grave doubt.</em></strong>


<strong><em>The bottom line is, there are plenty of potential geopolitical shocks that could threaten the current system, in addition to existing concerns about a stock market collapse or debt crisis.</em></strong>


<strong><em>The time to prepare is now.</em></strong>


<strong>"The Path to $10,000 Gold" can be <a href="https://dailyreckoning.com/path-10000-gold/?utm_source=hs_email&amp;utm_..." target="_blank">Read Here</a></strong>


<strong>


News and Commentary</strong>


<strong><a href="http://www.cnbc.com/2017/03/09/gold-is-suffering-its-longest-losing-stre...">Gold suffering its longest losing streak since last May—Some smell buying opportunity (CNBC.com)</a></strong>


<strong><a href="http://www.reuters.com/article/us-gold-investment-analysis-idUSKBN16H0I3">Bets on gold hold ground even as Fed rate hike looms large (Reuters.com)</a></strong>


<strong><a href="http://www.reuters.com/article/us-global-forex-idUSKBN16H020?il=0">Dollar on track for winning week as U.S. jobs data awaited, euro firm (Reuters.com)</a></strong>


<strong><a href="http://www.marketwatch.com/story/nikkei-leaps-amid-global-bond-selloff-2...">Nikkei leaps amid global bond selloff (MarketWatch.com)</a></strong>


<strong><a href="http://tucson.com/news/ron-paul-to-az-lawmakers-end-capital-gains-tax-on...">Ron Paul to AZ lawmakers: End capital gains tax on gold coins (Tucson.com)</a></strong>


<img src="http://www.goldcore.com/ie/wp-content/uploads/sites/19/2017/03/goldcore-..." />


<strong><a href="http://uk.businessinsider.com/a-huge-gold-rally-expected-in-spring-2017-...">Huge Gold Rally Expected In Spring 2017 (BusinessInsider.com)</a></strong>


<strong><a href="http://www.gold.org/research/indian-demand-will-recover-from-2016-lows">Indian demand will recover from 2016’s lows (Gold.org)</a></strong>


<strong><a href="http://www.platinuminvestment.com/news">2017 Platinum market deficit forecast increases (PlatinumInvestmnet.com)</a></strong>


<strong><a href="http://usawatchdog.com/noahs-flood-of-cash-coming-hugo-salinas-price/">Noah’s Flood of Cash Coming - Interview with Price (USAWatchDog.com)</a></strong>


<strong><a href="http://www.cnbc.com/2017/03/09/bond-yields-just-hit-the-level-that-bill-...">Bond yields just hit the level that Bill Gross said would signify a bear market (CNBC.com)</a></strong>


<a href="http://info.goldcore.com/7-real-risks-to-your-gold-ownership" rel="attachment wp-att-5047"><img class="alignnone wp-image-5047" src="http://www.goldcore.com/news/wp-content/uploads/sites/16/2016/03/7RealRi..." alt="7RealRisksBlogBanner" width="822" height="430" /></a>


<strong>Gold Prices (LBMA AM)</strong>


10 Mar: USD 1,196.55, GBP 983.56 &amp; EUR 1,127.15 per ounce


09 Mar: USD 1,204.60, GBP 991.39 &amp; EUR 1,140.64 per ounce


08 Mar: USD 1,213.30, GBP 997.70 &amp; EUR 1,149.00 per ounce


07 Mar: USD 1,223.70, GBP 1,003.56 &amp; EUR 1,157.62 per ounce


06 Mar: USD 1,231.15, GBP 1,004.74 &amp; EUR 1,162.82 per ounce


03 Mar: USD 1,228.75, GBP 1,005.12 &amp; EUR 1,168.05 per ounce


02 Mar: USD 1,243.30, GBP 1,013.17 &amp; EUR 1,181.14 per ounce


<strong>Silver Prices (LBMA)</strong>


10 Mar: USD 16.89, GBP 13.91 &amp; EUR 15.92 per ounce


09 Mar: USD 17.14, GBP 14.10 &amp; EUR 16.23 per ounce


08 Mar: USD 17.40, GBP 14.32 &amp; EUR 16.48 per ounce


07 Mar: USD 17.70, GBP 14.52 &amp; EUR 16.74 per ounce


06 Mar: USD 17.81, GBP 14.53 &amp; EUR 16.83 per ounce


03 Mar: USD 17.66, GBP 14.44 &amp; EUR 16.76 per ounce


02 Mar: USD 18.33, GBP 14.93 &amp; EUR 17.42 per ounce


<strong>


Recent Market Updates</strong>


<strong><a href="http://www.goldcore.com/us/gold-blog/silver-undervalued-historical-perpe...">- Silver Very Undervalued from Historical Perpective of Ancient Greece</a></strong>


<strong><a href="http://www.goldcore.com/us/gold-blog/gold-investing-101-beware-unallocat...">- Gold Investing 101 – Beware Unallocated Gold Accounts With Indebted Bullion Banks and Mints (Part II)</a></strong>


<strong><a href="http://www.goldcore.com/us/gold-blog/gold-investing-101-beware-ebay-coll...">- Gold Investing 101 – Beware eBay, Collectibles and “Pure” Gold Coins that are Gold Plated</a></strong>


<strong><a href="http://www.goldcore.com/us/gold-blog/think-prepare-euro-catastrophe/">- “Think About and Prepare For” Euro Catastrophe</a></strong>


<strong><a href="http://www.goldcore.com/us/gold-blog/silver-sale-4-fall-massive-2-billio...">- Silver On Sale – 4% Fall On Massive $2 Billion of Futures Selling</a></strong>


<strong><a href="http://www.goldcore.com/us/gold-blog/trump-avoid-debt-crisis-extremely-u...">- Trump Avoid Debt Crisis ? “Extremely Unlikely” – Rickards</a></strong>


<strong><a href="http://www.goldcore.com/us/gold-blog/art-market-bubble-bursting-gauguin-...">- Art Market Bubble Bursting – Gauguin Priced At $85 Million Collapses 74%</a></strong>


<strong><a href="http://www.goldcore.com/us/gold-blog/golds-value-weight-beauty-rarity-pe...">- Gold’s Value – Weight, Beauty, Rarity, Peak Gold and Secure Storage – Interview</a></strong>


<strong><a href="http://www.goldcore.com/us/gold-blog/oscars-debacle-movies-costly-dollar...">- Oscars Debacle – Movies More Costly As Dollar Devalued</a></strong>


<strong><a href="http://www.goldcore.com/us/gold-blog/gold-9-ytd-4th-higher-weekly-close-...">- Gold Up 9% YTD – 4th Higher Weekly Close and Breaks Resistance At $1,250/oz</a></strong>


<strong><a href="http://www.goldcore.com/us/gold-blog/oscars-worth-weight-gold/">- The Oscars – Worth Their Weight in Gold?</a></strong>


<strong><a href="http://www.goldcore.com/ie/gold-blog/gold-inflation-china-koos-jansen/">- Gold To Benefit from Rising Inflation and Higher Than “Official” China Gold Demand</a></strong>


<strong><a href="http://www.goldcore.com/us/gold-blog/russia-gold-buying-back-buys-one-mi...">- Russia Gold Buying Is Back – Buys One Million Ounces In January</a></strong>