Showing posts with label Balance sheet. Show all posts

Thursday, December 7, 2017

Earnings Don"t Matter After All!

Via The Knowledge Leaders Capital blog,


Our long-time readers are familiar with the work of Professor Baruch Lev of the NYU Stern School of Business, whose research forms the basis for the Knowledge Leaders investment strategy. In his decades-long study of financial records, Lev first discovered a link between a firm’s knowledge capital and its subsequent stock performance, ultimately identifying a market inefficiency that leads highly innovative companies to deliver excess returns. We call this market anomaly the Knowledge Effect.


In a new article in Financial Analysts Journal, Lev and co-author Feng Gu continue to advance the findings on intangibles. The article, “Time to Change Your Investment Model,”  identifies that earnings prediction has lost “much of its relevance in recent years.”


As a form of predicting corporate results, “earnings no longer reliably reflect changes in corporate value and are thus an inadequate driver of investment analysis.”


The basis for this shift, the authors explain, occurred after the emergence of the semiconductor.


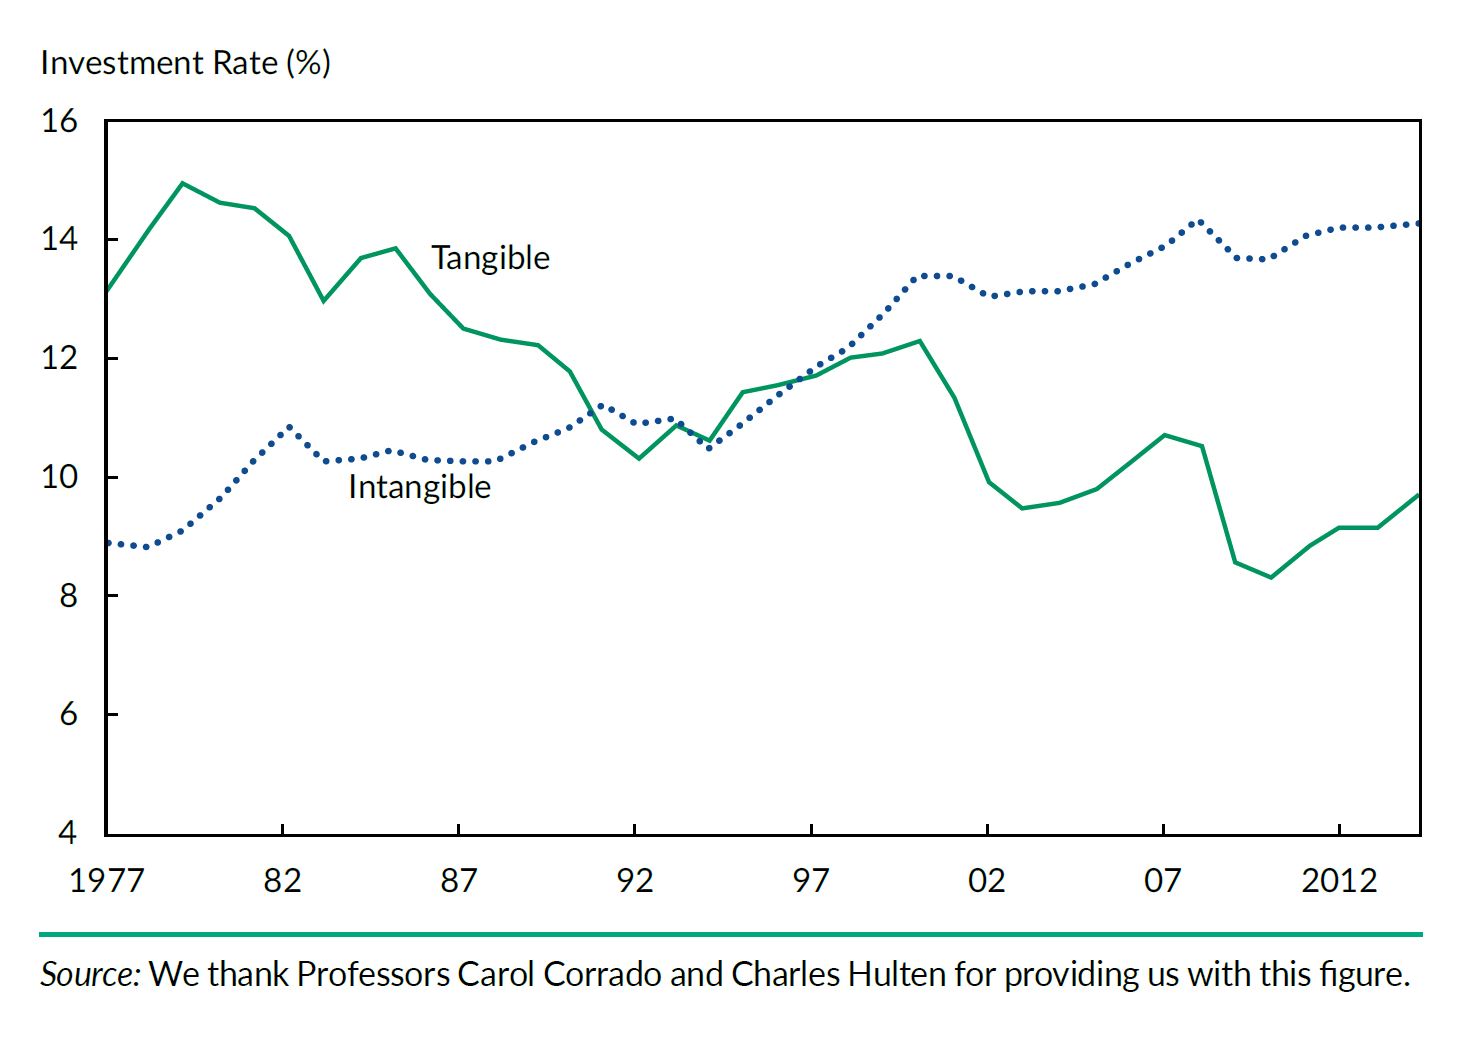
Starting in the early 1980s, investment in traditional, tangible assets (structures, factories, machinery, inventory) – considered assets by accountants and reported accordingly on the balance sheet – dropped precipitously from 15% of gross added value in 1977 to 9% in 2014, a 40% drop.


In contrast, the investment rate in intangible capital (R&D, patents, information systems, brands, media content, business processes) – mostly expensed in corporate income statements – increased continuously from 9% to 14% of added value, a 56% increase. This radical business model transformation came to be known as the knowledge – or information revolution, an irreversible trend in developed economies.”


As a result, for companies, “the only way to survive and prosper in such a competitive environment (is) through constant product and process innovation, achieved primarily by investing in intangible assets.” Therefore, “earnings’ usefulness to investors declines sharply for companies that increasingly rely on intangible value-creating assets.”


For these reasons, “GAAP-based reported earnings no longer reflect the periodic value changes (growth) of most business enterprises, and thus conventional earnings-based security analysis has lost much of its usefulness for investors in recent years.”


In summary, the authors observe:


“The disappointing returns on managed funds in recent years should raise doubts about the continued usefulness of conventional security analysis. Our extensive empirical evidence on the loss of relevance of GAAP numbers, in both this article and our recent book, confirms these doubts. Certain major investors have already departed from the status quo. … We propose a different course: Rather than replace analysts with robots, substitute an improved investment methodology for an outdated one.”


If you’re interested in reading Lev and Gu’s article, download it here. Stay tuned for more on Professor Lev’s research in early 2018 and an in-depth Q&A on his latest research on intangible capital.


Thursday, October 19, 2017

GDP Is Bogus: Here's Why

Authored by Charles Hugh Smith via OfTwoMinds blog,


Here"s a chart of our fabulous always-higher GDP, adjusted for another bogus metric, official inflation.


The theme this week is The Rot Within.


The rot eating away at our society and economy is typically papered over with bogus statistics that "prove" everything"s getting better every day in every way. The prime "proof" of rising prosperity is the Gross Domestic Product (GDP), which never fails to loft higher, with the rare excepts being Spots of Bother (recessions) that never last more than a quarter or two.


Longtime correspondent Dave P. of Market Daily Briefing recently summarized the key flaw in GDP: GDP doesn"t reflect changes in the balance sheet, i.e. debt.


So if we borrow money to pay people to dig holes and then fill them with the excavated dirt, GDP rises to general applause. The debt we took on to fund the make-work isn"t accounted for at all.


Here"s Dave"s explanation:


Once I learned about accounting, I figured out why the GDP metric wasn"t sufficient. What is missing?


The balance sheet.


Hurricanes are a direct hit to your nation"s balance sheet. The national income statement goes up because of increased spending to replace lost assets, but the "equity" part of the national balance sheet ends up taking a hit in direct proportion to the damage that occurred. Even if you rebuild everything just the way it was, your assets remain the same, while your liabilities have increased.


We know this because we use the balance sheet equation: equity = assets - liabilities. Equity is another word for wealth.


Before hurricane:


wealth = (house + car) - (home debt + car debt)


After hurricane, you rebuild your house, and buy a new car, using borrowed money:


wealth = (house + car) - (2 x home debt + 2 x car debt)


Wealth (equity) has declined by the sum (home debt + car debt)


So when you see pictures of a hurricane strike, you can now look through all that devastation and see the impact on the balance sheet. National equity (wealth) just dropped by the amount of damage inflicted by the hurricane. Whether it is ever rebuilt doesn"t actually matter; that equity is just gone. Destruction is always a downside for equity - even if there is a temporary positive impact on the income statement.


Isn"t it interesting that the mainstream economists, who don"t use banks, debt, or money in their models, largely ignore balance sheets and instead just looks at the income statement alone? Its almost as if the entire education system was organized so that people paid no attention to banks, debt, and money. Who do you think might benefit from our flock of PhD economists ignoring the extremely profitable debt-elephant in the room, and its purveyors, the banks?


Thank you, Dave, for an explanation we never see in the mainstream. And here"s a chart of our fabulous always-higher GDP, adjusted for another bogus metric, official inflation:


*  *  *


If you found value in this content, please join me in seeking solutions by becoming a $1/month patron of my work via patreon.com. Check out both of my new books, Inequality and the Collapse of Privilege ($3.95 Kindle, $8.95 print) and Why Our Status Quo Failed and Is Beyond Reform ($3.95 Kindle, $8.95 print, $5.95 audiobook) For more, please visit the OTM essentials website.

Friday, September 15, 2017

What Does The QE Experience Say About Rates In A Shrinking Fed Balance Sheet World?

Authored by Bryce Coward via Knowledge Leaders Capital blog,


The Federal Reserve is likely to decide next week to begin letting assets roll of its balance sheet as bonds mature, instead of reinvesting the proceeds.


This means that the balance sheet will begin to shrink in size and other market participants will be forced to absorb the supply of new issuance of treasury and mortgage backed securities. Conventional analysis of supply and demand dynamics might suggest the exiting of a large marginal buyer of these securities would cause yields to rise to some higher equilibrium level, but the QE experience suggests something else entirely.


When the Fed was engaged in asset purchases and the rate of change in the Fed’s balance sheet was rising (late 2010, mid 2012 through early 2013) long-term treasury yields rose on the back of juiced growth and inflation expectations produced by the stimulus. When the rate of change in the Fed’s balance sheet would flat line or fall (most of 2010, most of 2013 through 2014) treasury yields fell on the back of subdued growth and inflation expectations. Importantly, it was both real rates (TIPS) and breakeven inflation that followed this pattern, which is indicative of the level of economic stimulus produced by QE.


Chart 1 below shows 10-year nominal rates (red line, right axis) overlaid on the three month difference in the Fed’s balance sheet (blue line, left axis).


Chart 2 below shows 10-year real rates (red line, right axis) overlaid on the three month difference in the Fed’s balance sheet (blue line, left axis).


Chart 3 below shows 10-year implied breakeven inflation expectations (red line, right axis) overlaid on the three month difference in the Fed’s balance sheet (blue line, left axis).


But all that is history.


The question now is what will happen to rates as the Fed begins to unwind its balance sheet. Is there a reason to believe that inflation and growth expectations will rise as the Fed tightens policy?


In other words, is there reason to believe rates will act differently during the unwind than they did during the wind? We think the same economic mechanisms that were in place between 2009-2014 are still in place today and that long rates are likely to move lower as the Fed tightens policy via a smaller balance sheet.

Tuesday, July 18, 2017

Chinese Corporate Financials Continue Disturbing Trend Of Deterioration

Authored by Bryce Coward via Knowledge Leaders Capital blog,


Highlighting the deteriorating trend in Chinese corporate financials has been an annual feature our of this blog. This year, instead of looking at just the CSI 300 constituents, we chose to broaden our universe by using the FTSE All A Share Index, an index of about 2000 Chinese A shares. This should give us the most accurate read on the state of corporate China.


For at least the last decade Chinese corporations have levered up, both through debt and working capital, in an attempt to keep the music playing and without regard to stability or profitability. As we will see, 2016 was no different. As an aside, all of the data in this post show aggregated (summed up) metrics for all non-financial companies. For example, sales growth numbers show the sum total of 2016 non-financial constituent sales relative to the sum total of 2015 non-financial constituent sales. Aggregating the data in this way gives us a good top down view without having to control for outlier companies that may be small and irrelevant.


Starting with the balance sheet, one constant characteristic of Chinese corporate behavior has been their willingness to lever up. There are a number of ways to measure leverage, but one of our favorites is net debt as a percent of equity. From 2005-2016 net debt as a percent of equity increased 126%. From 2015-2016 along it increased by 13% to 143%, the highest on record. Meanwhile debt as a percent of capital ticked up again to 63% in 2016 – also the highest reading on record – while cash as a percent of total capital fell to its lowest ever reading of 9%. Luckily, financial leverage (assets relative to equity) remained constant at an egregiously high 6.9x.


Moving on to some ratios of working capital metrics as a percent of sales, we can see that 2016 was just a continuation of an alarming decade-long trend of Chinese companies gutting corporate efficiency to finance sales. From 2005-2016 accounts receivable as a percent of sales has increased 173%, accounts payable as a percent of sales has increased 73% and inventory as a percent of sales has increased 86%. All three metrics increased to an all-time high in 2016.


Building up one’s working capital could be a strategy to manage exploding top line growth, but unfortunately that is not the case for Chinese companies. Sales and net income haven’t grown since 2014 and net income actually contracted in 2016. Cash flow from operations also fell 18% for the largest year-on-year contraction since at least 2006. Plunging cash flow is an indication that the earnings decline of 1% could be painting too rosy a picture.


This brings us to something we like to call Chinese channel stuffing – or the tendency of corporate China to stuff the supply chain with accounts receivable and accounts payable so as to keep sales/sales growth at the desired level. Since 2012 both current liabilities and current assets have outpaced sales growth by between 2%-10% annually. In 2016 both metrics outpaced sales growth by 6%. This is to say, in order for corporate China in aggregate to have generated flat sales in 2016, they needed to grow working capital by 6%. In order for corporate China to have generated flat sales for two consecutive years they needed to grow working capital by a cumulative 16%.


The good thing is that, if you can believe the earnings and cash flow numbers, margins have remained relatively healthy. Net profit margins have remained at the historical average of 8% while cash flow margins stood at a robust 27% in 2017.


But, flat margins and growing balance sheets make for deteriorating profitability stats. In 2016 ROE dropped to an all-time low of 9%, ROA dropped to 5% and ROIC dropped to an all-time low of 4%.


There unfortunately are not a lot of positive things to say about the trends in corporate China. Much of the above is of course driven by SOEs at the behest of the government, but that doesn’t make the trends look any better. No one knows what the tipping point is and how long this can continue, but it goes without saying that we’d like to see these firms align the growth of their balance sheets to the growth of their income statements as soon as possible.

Thursday, July 13, 2017

The Only Thing That Matters For Bond Traders, In One Chart

Inflation outlook, rate differentials, projected growth, positioning, quants... there are countless explanations provided daily to explain why bonds trade the way they do. And yet, as Bank of America shows today, as of this moment just over 50% of the global bond market returns can be explained with just one thing: central bank balance sheet changes.


BofA explains:


Central bank assets, most of which are held in fixed income assets, are now equivalent to 31% of the $49tn fixed income universe tracked by the BofA Merrill Lynch Global Fixed Income Markets Index (GFIM); and the percentage of global bond market monthly returns explained by the monthly change in central bank balance sheets has dramatically increased in recent years.


And with more than half of bond returns now driven by central banks, BofA goes so far as to say that "Central banks have become the bond market."


BOfA"s evidence:


Note how in the past year, the months in which central bank asset purchases have either declined or been very small have coincided with months of weak performance from global bonds (Table 2). This was particularly the case in the fourth quarter of last year and a similar pattern is emerging this summer.


* * *


Of course, this is a problem because with central bank balance sheet projected to decline for the foreseeable future as Citi showed last month, at least until global stocks tumble and/or the next recession hits, it would suggest that yields have just one direction to go.


Friday, June 2, 2017

Goldman Pushes Back Rate Hike Forecast Citing Slowing Job Growth And Weak Inflation

After last month"s "much stronger than expected" jobs report, Goldman was convinced that the Fed would hike in June and September, while disclosing its balance sheet tapering announcement in December. However, after today"s disappointing jobs report, Jan Hatzius has flipped the last two, and says that he "now expects the third hike of 2017 to occur at the December meeting (we previously expected a hike in September and a balance sheet in announcement in December)."


The reason for the switch is that "the committee will prefer to wait for clarity on the outlook before implementing a third hike this year – particularly given signs of slowing job growth and the recent drop in core inflation."


Key excerpt:


Given the drop in the U3 and U6 unemployment rates and the lack of additional catalysts between now and the June meeting, we are increasing our subjective probability of a hike at that meeting from 80% to 90%. We are also moving forward our forecast for balance sheet normalization. We now expect the committee to announce a tapering of maturity reinvestments in September, and we now expect the third hike of 2017 to occur at the December meeting (we previously expected a hike in September and a balance sheet in announcement in December). This change reflects recent detailed discussion of the balance sheet among committee members, as well as our view that the committee will prefer to wait for clarity on the outlook before implementing a third hike this year – particularly given signs of slowing job growth and the recent drop in core inflation.


Expect the rest of Wall Street to jump on the bandwagon shortly,

Thursday, June 1, 2017

One Bank's Surprising Discovery: The Debt Party Is Finally Over

A recurring theme on this website has been to periodically highlight the tremendous build up in US corporate debt, most recently in April when we showed that "Corporate Debt To EBITDA Hits All Time High." The relentless debt build up is something which even the IMF recently noted, when in April it released a special report on financial stability, according to which 20% of US corporations were at risk of default should rates rise. It is also the topic of the latest piece by SocGen"s strategist Andrew Lapthorne who uses even more colorful adjectives to describe what has happened since the financial crisis, noting that "the debt build-up during this cycle has been incredible, particularly when compared to the stagnant progression of EBITDA."


Lapthorne calculates that S&P1500 ex financial net debt has risen by almost $2 trillion in five years, a 150% increase, but this mild in comparison to the tripling of the debt pile in the Russell 2000 in six years. He also notes, as shown he previously, that as a result of this debt surge, interest payments cost the smallest 50% of stocks in the US fully 30% of their EBIT compared with just 10% of profits for the largest 10% and states that "clearly the sensitivity to higher interest rates is then going to be with this smallest 50%, while the dominance and financial strength of the largest 10% disguises this problem in the aggregate index measures."


Another key point that Lapthorne makes, as also highlighted here back in November 2015, is that the reason for this increase in debt is largely down to financial engineering – aka share buybacks (see charts below). However the most recent data points to a significant change in this trendwith not only debt issuance in decline, but also the quantity of share buybacks.


Clearly over the long-term, this is obviously good news; borrowing money to buy back your elevated shares is clearly nonsense. However that has been the case for a number of years now. Are US corporates really waking up to the foolishness of their actions or are they constrained by their balance sheets? Or they may simply be anticipating greater clarity on Trump’s policies? Who knows! But in the short term, this does significantly reduce the impact of the biggest net purchaser of US equities, according to the SocGen strategist.


In other words, Lapthorne has found something surprising: after years of constant growth "having boomed out of control", net debt growth is rapidly heading toward zero, and perhaps even a contraction, for the first time since the financial crisis!


Needless to say, for an economy in which debt growth - either public or private - has been a primary driver of overall economic expansion, this is a stunning development. So what is driving it.


Here, Lapthorne makes several nuanced observations which have significant implications not only on future debt levels but overall equity prices and broader risk-assets:


Firstly, while the headline S&P 500 continues to move ever higher, the dynamics within the US equity market are not so encouraging. The chart below breaks down the FT US non-financial universe into top and bottom quintiles based on balance sheet strength (as measured by Merton’s Distance to Default). What is abundantly clear is that while the strongest continue to do very well, ever since the Fed surprised the markets back in February with a US rate move, stocks with the weakest balance sheets have struggled.


This goes to an observation we made last month, namely that virtually half of the S&P return has been due to a handful of high growth tech, (i.e., no debt) companies. At the same time, the average stock as measured by the equal-weighted performance, has also gone nowhere.


And here is where SocGen may have found something few have considered so far: "many are associating the surge in FAANG performance as a ‘go-for-growth’ play, but in a reality it looks like investors are running scared into cash rich companies."


Lapthorne"s conclusion: "This is not a Trump policy play, this is balance sheet risk."


Lapthorne next highlights an odd discrepancy between equity and debt: the aversion to debt "may seem a little odd given that high yield bond yields are down at historical lows and the appetite for new issuance remains strong. What drives credit is typically a mixture of leverage levels, interest rates, asset prices and asset volatility. Corporate leverage ratios are currently high, despite near record asset prices, and while interest rates are gradually rising, credit spreads on high yield bonds have plummeted. Why? Well asset volatility is very low compared to historical levels, or to put it another way, asset price confidence is high. This, coupled with the continuous clamor for yield, is helping to compress corporate bond spreads. This overconfidence may be misplaced. If equity volatility were to move higher, lower quality bonds could struggle, as firms with poor balance sheets are already in the US equity market."


The chart below plots the relationship between long/short portfolios formed on balance sheet strength (again using Merton) and high yield bond yields. That they have a strong historical relationship is not surprising as both are measures of credit risk, but as such it is interesting when they diverge. For example there are only two instances in which we saw major divergences in the chart below. The first was the original Fed tapering bond sell-off in 2013. The second is today, with equity markets clearly balance sheet risk averse and credit markets seemingly incredibly complacent.


Going back to the core point made by the SocGen strategist, namely that investors are increasingly reluctant to lend to companies that already have a sizable debt load, Lapthorne points out, as one would expect, that where he has seen the greatest aversion to debt is within the smaller cap Russell 2000 index. A long/short balance sheet strength strategy is up 20% this year – the long leg is up 7% and the short leg is off 13%. To confirm this is not all about beta or cyclicality – a long portfolio formed on just price volatility is flat this year while the short leg is off 7%.


To summarise SocGen"s unexpected finding which started by looking at debt incurrence among various "quality" strata of companies and ended up with implications for risk appetite for stocks: the strength of tech stocks (lowest amount of debt) and the Russell 2000 weakness (most debt) this year has nothing to do with Trump and everything to do with interest rate rises and balance sheet concerns.


And one final point from SocGen: "the problem with highly leveraged companies experiencing falling market caps is that it makes things worse, i.e. implied leverage and price volatility both go up!"


We wonder if Janet Yellen and her central bank peers are aware of these findings which have dramatic consequences for the Fed"s treasured "wealth effect", as they set off to not only raise rates but also unwind record balance sheets, in the process exacerbating the divergence between a handful of no/low debt companies and the rest of the public market facing increasingly higher interest rates...

Thursday, April 6, 2017

NY Fed Disagrees With Minutes: Does Not Expect Balance Sheet Renormalization Until Mid-2018

With the question of the Fed"s portfolio normalization now all the rage, accentuated by yesterday"s FOMC Minutes announcement that runoff could start later this year - even as many traders admit nobody has any idea what will happen if and when the Fed starts reducing its holdings, mostly of MBS - on Thursday the NY Fed, the Fed"s trading desk, provided a glimpse into its thinking on how this will play out in its latest Domestic Market Operations annual report.


According to the report, the Fed"s bond holdings could drop to about $2.8 trillion by the end of 2021 - a $1.7 trillion reduction over the next 5 years - with the New York Fed now projecting its balance sheet will reach a "normalized" state some two quarter earlier however with approximately $600 billion more assets than in a year-ago estimate. The U.S. central bank currently has some $4.5 trillion in Treasury and mortgage bonds.


To be sure, many things can and will happen between now and 2021, including the US may have a new president.


Which is why what we found more interesting was the NY Fed"s own forecast on the start of renormalization, which disagreed with the FOMC Minutes, in that Bill Dudley"s Fed does not expect the Fed to start "renormalizing" until mid-2018, to wit: "the size of the SOMA portfolio is projected to remain largely unchanged at its current level of approximately $4.2 trillion through mid-2018, while full reinvestments continue."


What happens to the balance sheet then:


After that date, it starts to decline as reinvestments are phased out and then ended altogether in mid-2019. The Federal Reserve’s securities holdings then decline until the portfolio reaches its normalized size in the fourth quarter of 2021 (Chart 26). At that time, the domestic securities portfolio is estimated to be about $2.8 trillion, with a slightly higher concentration in Treasury securities than in agency MBS. Thereafter, Treasury-driven growth of securities holdings supports trend balance sheet growth, and agency debt and agency MBS holdings continue to run off.


The NY Fed on suspension of reinvestments vs outright selling:


Once the FOMC ends reinvestments, the pace of the reduction in the size of the SOMA portfolio will largely be driven by the pace of principal receipts from SOMA securities holdings (Chart 27). The timing of principal payments from maturing Treasury securities and agency debt securities is a known function of current SOMA holdings. In contrast, projected principal pay-downs associated with agency MBS are model-based estimates that are subject to considerable uncertainty because of the embedded prepayment option. The actual pay-down path will depend on a variety of factors, including the path of interest rates, changes in housing prices, credit conditions, and other government policy initiatives.


Finally, how the latest forecast differs from last years:


The point of normalization in late 2021 is projected to occur almost two quarters earlier than in the 2015 baseline (Chart 28). The balance sheet starts to contract just over a year later than it was expected to in the 2015 baseline given a longer-than-previously anticipated period for reinvestments to continue. (The December 2015 baseline was modeled on an assumption that reinvestments would begin to be phased out in the first half of 2017.) However, a larger long-run balance sheet size in the current baseline, driven by the assumption about a higher level of reserve balance liabilities in a future policy implementation framework, requires less of the portfolio to run off once such a contraction starts.


And some parting words:


Of course, banks’ demand for reserves and the level of reserves the FOMC will choose to maintain in its long-run policy implementation framework remain uncertain. A set of alternative scenarios highlights  the sensitivity of SOMA portfolio balances to different long-run levels of Federal Reserve liabilities. These scenarios illustrate the degree to which increases (decreases) in liabilities imply a larger (smaller)  level of the SOMA in the long run and how long it might take to achieve a normalized portfolio size. While the projections are modeled with regard to alternative levels of reserve balances, the specific type  of liability is not material; the effect on SOMA portfolio balances would be similar if the alternative levels of liabilities arose from changes in other line items, such as Federal Reserve notes, the TGA, the  foreign repo pool, or DFMU balances.


Under a scenario in which reserve balances are $100 billion in the long run (the baseline in prior years’ reports), the size of the balance sheet is normalized in the fourth quarter of 2022, approximately one  year later than in the baseline scenario (Chart 29). In contrast, under a scenario in which reserves are $1 trillion in the long run, the size of the balance sheet is normalized in the fourth quarter of 2020,  nearly one year sooner than in the baseline. Given that Treasury purchases resume at an earlier date, by the end of the forecast horizon the portfolio is more heavily weighted to Treasury securities than it is  in the baseline scenario.


In other words, if all goes according to plan, the Fed will consider its "renormalization" mission complete in about 5 years, at which point it will have no qualms about launching even more QE if it has to.


Source

Tuesday, March 21, 2017

Accounting Change On Operating Leases To Add $3 Trillion In Debt To Corporate Balance Sheets

From a practical perspective, operating leases are pretty much the same as debt.  They reflect a contractual obligation on the part of one counterparty to make defined stream of cash payments to another over a set period and with an implied interest rate embedded in the payment stream.  In fact, within a bankruptcy context operating leases are treated exactly the same as debt and rank pari passu with the other general unsecured obligations of a business.  That said, accounting rules treat operating leases differently than debt and do not require them to be included as a liability on a company"s balance sheet.  That is, until 2019.


As Bloomberg points out this morning, starting in 2019 new accounting rules, called IFRS 16, will force companies to include operating lease commitments as part of their reported debt obligations.  And while the end result will have far-reaching implications, the biggest will be the addition of roughly $3 trillion in debt to corporate balance sheets.


Of course, retail, telecoms, energy and airline companies will be most affected by the new rules.


Leases


And here are the largest users of operating leases. 


Leases


Of course, some will argue that the accounting rule changes don"t alter a company"s cash flow profile and are therefore irrelevant.  That said, to the extent interest rates remain low, the present value of future cash payment obligations will undoubtedly serve to drive the pro-forma leverage profiles of some companies through the roof...much as low interest rates have wreaked havoc on pension underfundings over the past several years.


Some companies already spell out the impact of leases on total indebtedness. Air France-KLM"s reported net debt is 3.7 billion euros ($3.9 billion) but its lease-adjusted net debt is 11.2 billion euros. The present value of Tesco"s operating lease commitments is one and a
half times the size of reported net debt, according to its 2016 annual report.


Even so, I doubt this transition will be painless. At the very least, the rule change should give armchair investors, not to mention a company"s customers, employees and suppliers, a much better idea of how risky a business is compared to rivals. For some folk, this
will be a nasty surprise. Worries about corporate leverage are already widespread.


Besides, companies aren"t always as forthcoming as you might hope. Some airlines make debt adjustments for aircraft leases but not for other off-balance sheet rental agreements such as airport buildings. Delta Air Lines Inc. reported $6.1 billion in adjusted net debt at the end of December, including $2 billion in aircraft rent liabilities. Yet the discounted value of all its operating leases is closer to $9 billion, Gadfly estimates.


Meanwhile, the biggest impact of the accounting change may be the mere removal of yet another tool that management teams use to "game" their financial statements.


It"s conceivable therefore that IFRS 16 will affect corporate decisions on whether to rent or purchase an asset. Consider sale and lease-back arrangements. These were once a popular way for companies to get their hands on some cash and a quick chance for executives to make themselves look like geniuses. All of a sudden, return on assets improved.


Now, if all that rented floor space has to sit on the balance sheet anyway, selling off the corporate silverware might become less attractive. Buying big ticket assets, rather than leasing, is also cheaper now because of low interest rates.


Another approach may see some companies partly embrace shorter lease terms to minimize the balance sheet liability, according to Ruxandra Haradau-Doser, aviation analyst at Kepler Cheuvreux. Shorter leases are already common in retail, albeit for different reasons. With sales migrating online, retailers want more flexibility to close stores. IFRS 16 could accelerate that.


The accounting changes could also lead to more volatility in financial results, according to James Stamp, a partner at KPMG. Airlines typically take out aircraft leases in U.S. dollars. If the carrier"s domestic currency weakens against the dollar, its liabilities would suddenly increase and it would have to take a currency hit against earnings. Stamp thinks demand for hedging will rise.


And you thought things couldn"t get much worse for retailers...

Thursday, January 26, 2017

Why Ben Bernanke Thinks The Fed Shouldn't Shrink Its Balance Sheet

One of the more controversial topics to emerge over the past three weeks has been the "trial balloon" by various Fed presidents, most notably Bullard and Harker, suggesting that the time to start unwinding the Fed"s balance sheet is almost here. While much of the sellside has quickly piggybacked with their own analysis, many suggesting that such an action would not impact most asset classes (except for MBS), an assumption we frankly find ludicrous as the main reason for the current level on the S&P is precisely the $14 trillion in global central bank liquidity injections...


... so far there has not been an official statement by Janet Yellen, or any members of her closest circle. So in lieu of that, we will resort to the next best thing - the opinion of the man who inflated the world"s biggest central bank balance sheet bubble himself, Ben Bernanke, who addresses this topic in a note on his Brookings blog titled "Shrinking the Fed’s balance sheet"


Cutting to the chase, Bernanke is not at all impressed with that particular proposed normalization, to wit:


The FOMC has been clear that its current tightening campaign would ultimately involve shrinking the central bank’s balance sheet, but it has also said that will not begin that process until  “normalization of the level of the federal funds rate is well under way .” In short: rate increases first, balance sheet reduction later. However, recently, a number of Fed officials have begun talking about plans for shrinking the balance sheet, leading market participants and other observers to speculate that first steps in that direction may take place sooner than expected


Has the Fed’s approach to balance sheet normalization actually changed? At least until I hear otherwise from the FOMC’s leadership or the Committee as a whole, my guess (and hope) is that it hasn’t. As I’ll discuss in this post, the case for deferring action on the balance sheet until short-term rates are meaningfully higher remains at least as strong as it was when the FOMC’s strategy was first devised.


Bernanke says that while he has no position on the "appropriate pace" of monetary tightening, he is arguing that "whatever pace of tightening the FOMC chooses, it’s best implemented in the near term by increasing the short-term interest rate. Although some shrinkage of the balance sheet will likely occur at some point, there’s no need to rush that process."


He then makes the following two points against commencing a balance sheet unwind.


First, policy communication will be made easier and the risk of market disruption minimized if the shrinkage of the balance sheet, once it begins, is passive and predictable. In particular, once the runoff of the Fed’s assets begins, the FOMC should proceed on the assumption that it will not be halted. But since the effect of balance sheet reduction on broader financial conditions is uncertain, it is prudent not to begin that process until short-term interest rates are comfortably away from their effective lower bound, leaving the Committee room to offset any unanticipated effects. 


And:


Second, before beginning to shrink the balance sheet, the FOMC should have a clearer idea of what its ultimate size should be. As I’ll explain, under reasonable scenarios only a moderate amount of balance sheet reduction may ultimately be needed, reducing any urgency to begin the unwinding process.


Incidentally, that is a point which DB made two weeks ago, suggesting that due to the recent pick up of outstanding currency in circulation, the actual reduction in assets may not have to be that great after all (see chart above). This is what DB"s Dominic Konstam said in mid-January.


The Fed balance sheet unwind took the headline this week. In the context of our QE-bond supply model, an abrupt end of SOMA reinvestments is worth 25 bps in higher 10yr yields by the end of 2017. If the Fed were to sell securities to speed up its balance sheet reduction, a pace of say $50 billion per month could push yields higher by an additional 35 bps. There are a couple of considerations. The most crucial one is that the Fed actually may not be able to sell any of its Treasury securities outright. The reason being that currency in circulation – a liability of the Fed for which it needs to pledge one-for- one with Treasury security collateral – has grown from $800 billion in 2008 to $1.5 trillion today. This leaves just around $1 trillion of “excess” Treasury securities in the SOMA portfolio. If the Fed lets these securities  mature naturally without reinvesting, the level of holdings would run down to the minimum required level by 2019. Then the Fed may need to restart repurchasing Treasuries to adjust to the level of currency in circulation.


It appears that Bernanke read this analysis because he makes precisely the same point in his discussion of how big the balance sheet should be.


For reasons of transparency and predictability, when the FOMC announces the end of reinvestment it should also provide guidance about the ultimate size and composition of the balance sheet. That discussion appears still to be ongoing inside the Committee. As I noted here, there are reasonable arguments for keeping the Fed’s balance sheet large indefinitely, including improving the transmission of monetary policy to money markets, increasing the supply of safe short-term assets available to market participants, and improving the central bank’s ability to provide liquidity during a crisis. However, even if none of these arguments gains adherents on the FOMC, growing holdings of currency and changes in the Fed’s methods of implementing monetary policy alone may imply that only moderate reductions in the balance sheet will ultimately be required—another reason that it’s unnecessary to move quickly. 


The growth in the public’s demand for currency is one (completely uncontroversial) reason that the Fed will need a larger balance sheet indefinitely. The minimalist central bank balance sheet, consistent with providing the public’s desired holdings of currency and nothing else, would include currency as the primary liability and government-issued securities as the primary asset. That’s a pretty good description of the Fed’s balance sheet before the crisis: liabilities were about $800 billion in currency in circulation, and assets (almost all in Treasuries) were only slightly greater than that. However, today currency in circulation has grown to $1.5 trillion. Because of rising nominal GDP, low interest rates, increased foreign demand for dollars and other factors, Fed staff estimates that, the amount of currency in circulation will grow to $2.5 trillion or more over the next decade. In short, growth in the public’s demand for currency alone implies that the Fed will need a much larger balance sheet (in nominal terms) than it did before the crisis.


He then discusses the right level of bank reserves, ostensibly the primary driver behind the asset, if not economic, reflation trade of the past 8 years:


What level of bank reserves would be needed for the Fed to continue to implement monetary policy by current methods? To ensure that the floor rate set by the central bank is always effective, the banking system must be saturated with reserves (that is, in the absence of the interest rate set and paid by the central bank, the market-determined return to reserves would be zero). In December 2008, when the federal funds rate first fell to zero and the Fed began to use the interest rate on bank reserves as a tool of monetary policy, bank reserves were about $800 billion. Taking into account growth in nominal GDP and bank liabilities, the critical level of bank reserves needed to implement monetary policy through a floor system seems likely to be well over $1 trillion today, and growing. Taking currency demand into account as well, it’s not unreasonable to argue that the optimal size of the Fed’s balance is currently greater than $2.5 trillion and may reach $4 trillion or more over the next decade. In a sense, the U.S. economy is “growing into” the Fed’s $4.5 trillion balance sheet, reducing the need for rapid shrinkage over the next few years.


After all that it is clear that Bernanke is not at all interested in beginning a balance sheet reduction, as he makes abundantly clear in his conclusion:


At some point the Fed is likely to reduce the size of its balance sheet. Without taking a position on the overall pace of monetary tightening, I’ve offered two arguments why beginning that process is not urgent. First, to minimize the risk that unwinding the balance sheet will disrupt markets and the economy, the best approach is to allow a passive runoff of maturing assets, without attempting to vary the pace of rundown for policy purposes. However, even with such a cautious approach, the effects of initiating a reduction in the Fed’s balance sheet are uncertain. Accordingly, it would be prudent not to initiate that process until the short-term interest rate is safely away from the effective lower bound.


Second, to allow for appropriate guidance to the public and to markets, it would be wise for the FOMC to reach a consensus about the long-run optimal size of its balance sheet before starting the unwinding process. Even if some of the more exotic arguments for maintaining a large balance sheet are rejected, the FOMC may still ultimately agree that the optimal balance sheet need not be radically smaller than its current level. If so, then the process of shrinking the balance sheet need not be rapid or urgently begun.


The punchline: "There is little evidence that, at current levels, the Fed’s balance sheet poses significant problems for market functioning or for the economy."


Which is to be expected: after all with the market only able to absorb an occasional rate hike once a year, and that thanks to massive, record QE still ongoing at the ECB and BOJ, the last thing Bernanke would want is to risk the market undergoing a true normalization, one which would send bond yields soaring as the buyers of last resort becomes seller of first resort, while equities do the opposite of what they did since 2009.


Ultimately, Bernanke is right: for all the Fed"s trial balloons, don"t hold your breath for a balance sheet "renormalization" to take place any time soon.