Showing posts with label FTSE 100. Show all posts

Sunday, December 17, 2017

Nomi Prins: "Dark Money" Runs The World

Authored by Nomi Prins via The Daily Reckoning,


Few people know financial markets’ biggest secret...


For the last 40 years, most people believed the stock market always goes up. Simply buy and hold long enough, the theory went, and you could sit back and watch the money accumulate in your account. No thought or hard work needed.


It was a nifty strategy — until the idea burned most investors in 2008. Almost a decade later, the scar tissue is still fresh for many investors.


Even today, after the U.S. stock market has rallied by 271% since the bottom on March 6, 2009 — nearly tripling investors’ money — only about half of Americans are invested in the stock market, according to NPR. That’s down from two-thirds compared to a decade ago.


The rest are in cash on the sidelines. Maybe that’s been you.


And who can blame you? “Fool me once, shame on you,” the saying goes. “Fool me twice, shame on me.”


Last June, Fortune surveyed readers. 71% of respondents said “the economic system in the U.S. is rigged in favor of certain groups.”


A few years earlier, the Los Angeles Times reported “Poll finds 64% of voters believe stock market is rigged against them…”


They’re not wrong.


Somebody’s made gains from all of those sectors in the stock market. It just hasn’t been Main Street.


Since I’ve left the world of big banking, I’ve made it my mission to change that. That leads me to the catalyst for my new project…


Dark money.


Dark money is the #1 secret life force of today’s rigged financial markets. It drives whole markets up and down. It’s the reason for today’s financial bubbles.


On Wall Street, knowledge of and access to dark money means trillions of dollars per year flowing in and around global stock, bond and derivatives markets.


I learned this firsthand from my career on Wall Street. My first full year working on Wall Street was in 1987.


I wasn’t talking about “dark money” or central bank collusion back then. I was just starting out.


Eventually, I would uncover how the dark money system works… how it has corrupted our financial system… and encouraged greed to the point of crisis like in 2008.


When I moved abroad to create and run the analytics department at Bear Stearns London as senior managing director, I got my first look at how dark money flows and its effects cross borders.


The “dark money” comes from central banks. In essence, central banks “print” money or electronically fabricate money by buying bonds or stocks. They use other tools like adjusting interest rate policy and currency agreements with other central banks to pump liquidity into the financial system.


That dark money goes to the biggest private banks and financial institutions first. From there, it spreads out in seemingly infinite directions affecting different financial assets in different ways.


Yet these dark money flows stretch around the world according to a pattern of power, influence and, of course, wealth for select groups. To be a part of the dark money elite means to have control over many. How elite is a matter of degree.


These is not built upon conspiracy theories. To the contrary, alliances make perfect sense and operate publicly. Even better, their exclusive dealings and the consequences that follow are foreseeable — but only if you understand how the system works and follow the dark money flows.


It’s easy to see how this dark money affects the stock market at a high level, because we can monitor its constant movement.


Here’s the smoking gun:


Dark Money


The red line shows you how much “dark money” the Federal Reserve has printed since 2008.


The blue line shows you the S&P 500.


They move together — more dark money drives the market higher. Much higher.


There are dark money charts from around the world, just like the one I showed you for the Federal Reserve and U.S. stock market.


Look at this “dark money” chart from Japan, for example:


Japan


The blue line shows the dark money created by their central bank, The Bank of Japan. The red line shows Japan’s major stock index, the Nikkei 225, going up as well. The dark money drove the market much higher over the past eight years.


Or, look at this “dark money” chart from the U.K.:


England


Again, the blue line shows the “dark money” created since 2009 by the U.K.’s central bank, The Bank of England. The red line shows how the FTSE 100, their stock index, has followed higher in lock-step.


To invest profitably in financial markets, you need to understand the hidden power relationships that drive financial and political events. Ideologies and personal associations among elites are oblivious to political party lines and international boundaries. So is dark money.


Wednesday, November 29, 2017

London House Prices Reach Record Unaffordability

Earlier this month, we noted further evidence that London’s housing bubble is bursting. In its October 2017 survey, the Royal Institute of Chartered Surveyors (RICS) reported the largest proportion of respondents seeing a drop in London house prices versus the previous month since 2009. The net balance was nearly two thirds (-63%) in favour of declines, which contrasted sharply with a national average which was marginally in positive territory (+1%).


The RICS data corroborated the Bank of England’s regional agents’ report a day earlier which highlighted “signs of excess supply in London and the South, but some excess demand in most other parts of the United Kingdom”.


The bad news for wannabe London residents is that in spite of the (slightly) lower prices, the affordability of residential property in the capital – at nearly 15 times income - is the worst it’s ever been. According to Bloomberg,


London homes are less affordable than ever before, despite slowing price growth and government attempts to cut the cost of housing for first-time buyers.


It now costs the average Londoner 14.5 times their annual salary to purchase a home, the highest level on record, according to a report Tuesday by researcher Hometrack. Cambridge, Oxford and the English seaside town of Bournemouth also have price-to-earnings ratios in the double digits, the report shows.


“Unaffordability in London has reached a record high, despite a material slowdown in the rate of house-price growth over the last year,” Richard Donnell, research director at Hometrack, said in an interview. “The gap between average earnings and house prices in the capital has never been wider.”


Even with the recent slowdown, the average cost of a first home in the U.K. capital is still up 66 percent since 2012 as supply fails to meet the demand from domestic buyers and overseas investors. Spiraling values have caused the number of younger buyers in the capital to fall, something that Chancellor of the Exchequer Philip Hammond sought to address last week when he abolished stamp duty for first-time buyers of homes worth up to 300,000 pounds ($400,290).


London house prices rose an average 3 percent in the year ending October to 496,000 pounds, less than half the 7.7 percent growth rate of a year earlier, Hometrack said. The researcher defined London as the 46 boroughs in and around the U.K. capital.


Last week, making housing more affordable was one of the centerpieces of Chancellor of the Exchequer, Philip Hammond’s, budget speech. However, some commentators doubted that the new measures would help, as the Financial Times noted.


Mr Hammond’s signature policy plan was a £44bn package of investment, loans and guarantees to increase the annual amount of new homes built to 300,000 in the middle of the next decade, up from 217,000 last year, aided by planning reforms designed to encourage homebuilders not to sit on permissions already granted.


The measures on housing supply were augmented by a headline-grabbing cut in stamp duty for first-time buyers on properties below £500,000. No stamp duty will apply for purchases below £300,000.


However, in a blow to the chancellor, the independent Office for Budget Responsibility said the main effect of these cuts would be to raise house prices and only lead to the purchase of an additional 3,500 homes a year. The fiscal watchdog also indicated it did not think the house building measures would make much difference. Lower household incomes led it to reduce its forecast for the growth in spending on home building.


Speaking to Bloomberg, Hometrack’s Donnell was not convinced either since housing, in London particularly, is already so unaffordable.


Still, Donnell is skeptical that the tax measures in Hammond’s budget speech last Wednesday will have much effect on affordability, given the large sums needed to get on the housing ladder. “The changes to stamp duty are unlikely to significantly impact this trend as the greatest challenge for first-time buyers is the income required to pass mortgage-affordability stress tests,” Donnell said.


However, London’s lack of affordability and limited available stock is having a positive impact on the rest of the UK, as Bloomberg explains.


The northern English cities of Manchester and Birmingham registered the fastest house-price growth, at more than 7 percent. London will continue to underperform some regional cities over the next two to three years as costs adjust to levels buyers are willing to pay, while the price-to-earnings ratio in the capital is “expected to drift lower,” Hometrack said.


It will take more than underperformance to make London housing affordable, more a like a crash.


Friday, November 24, 2017

Get Out Now: SocGen Predicts Market Crash, Bear Market For The S&P

While the charade of sellside analysts releasing optimistic, and in the case of Barclays and Goldman "rationally exuberant"previews of the year ahead...


... is a familiar, long-running tradition on Wall Street, rarely has the intellectual dishonesty and cognitive dissonance been quite so glaring: take Goldman, which while admitting that valuations have never been higher, and the upside case never more reliant on just one piece of legislation which has a significant chance of not passing (GOP tax reform for those unaware), Goldman still has to temerity to predict not only no bear market in the next three years, but goes so far as to suggest an "irrationally exuberant" target of 5,300 in three years.


And as of this morning, the penguins are on full parade, with virtually not a single big bank predicting the market will drop in the coming year. Here are the latest S&P price targets, EPS forecasts and implied PE multiples, for the year ahead:


  • Bank of Montreal, Brian Belski, 2,950, EPS $145.00, P/E 20.3x

  • UBS, Keith Parker, 2,900, EPS $141.00, P/E  20.6x

  • Canaccord, Tony Dwyer, 2,800, EPS $140.00, P/E 20.0x

  • Credit Suisse, Jonathan Golub, 2,875, EPS $139.00, P/E 20.7x

  • Deutsche Bank, Binky Chadha, 2,850, EPS $140.00, P/E 20.4x

  • Goldman Sachs, David Kostin, 2,850, EPS $150.00, P/E 19x

  • Citigroup, Tobias Levkovich, 2,675, EPS $141.00, P/E 19.0x

  • HSBC, Ben Laidler, 2,650, EPS $142.00, P/E 18.7x

Good luck with all those 20x P/Es in a world in which rates are rising and central bank balance sheets will start contracting in one year.


Luckily, there is the occasional honest bank, like Macquarie (whose Viktor Shvets has become one of our favorite commentators for his objective, no nonsence analysis) and - as of this morning - SocGen, whose strategist Roland Kaloyan has written a note which warns that with bond yields rising (see the crash in China overnight, where the Shanghai Composite tumbled the most in 17 months on the realization that rising rates is bad for stocks), there is effectively no upside left in stocks, which coupled with the prospect of a US economy recession in 2020 will "crimp returns in 2019" Furthermore, in light of the record vol shorts, SocGen jumps on the VIX-squeeze crash bandwaon, warning vol positioning could "strongly deteriorate the risk reward profile of equity markets."


In not so many words: with little stock upside left, with the threat of rising interest rates slamming P/E multiples, with the economy in deep in late cycle, with equities trading at record valuations, with everyone short vol and just begging for a vol short squeeze, SocGen"s advice is simple: get out now.


Here is SocGen:


We are less enthusiastic about equities heading into 2018 – We do not see much upside on our major equity targets for the next 12 months. We expect stretched valuations and rising bond  yields to limit equity index performances in 2018 and the prospect of a US economic slowdown in 2020 to further cramp returns in 2019. We also raise some concerns about the quantity of shorts on volatility, which could potentially strongly deteriorate the risk reward profile of equity markets.


Specifically, with regards to the S&P, SocGen reports that US equities are now at - or rather about 100 points above - their fair value:


The S&P 500 has reached our target for the end of this cycle (2,500pts) and is now entering expensive territory. Indeed, on all the metrics, US equities are trading at levels only seen during the late-90s bubble. Since Trump’s election, the US equity market has risen 24%, but only half of this came from earnings growth. The other half has been driven by P/E expansion. According to our calculations, the US equity market is already pricing in potential tax reform. The rise in bond yields and Fed repricing should be headwinds against further US equity rerating.


If that wasn"t enough, SocGen also notes that its valuation model suggests "that upside on the S&P 500 is limited: the US equity market is already pricing in a rebound in growth and inflation. The rise in bond yields and Fed repricing should be a headwind against further US equity rerating."


In practical terms, this means that SocGen is predicting that the S&P, which is already 100 points above the bank"s year end target of 2,500, will tumble to 2,000, or more than 20%, before rebounding modestly to 2,200 just as the US economy succumbs to a recession, at which point all bets are off. And not just the S&P, but virtually all major European bourses are due for a bear market in the coming 12 months.


Here are some of the key arguments behind SocGen"s bearish outlook, first a familiar discussion of the risk posted by the biggest vol short ever observed.


Equity volatility, both realised and implied, has been edging ever lower for quite some time now. Being invested in a simple systematic short VIX future volatility has been strongly rewarding: +290% over the last two years. However, when the tide turns (i.e. VIX spikes), the drawdown can be significant. The quantity of short positioning on VIX open in the market (see right chart) would potentially amplify any spike of the VIX.


The risk of a VIX surge ties into the question of how the market"s risk/return profile will be shaped in the coming year based on what the prevalent VIX level is:


The risk /reward ratio as measured by the Sharpe ratio has been very attractive for US equities: good expected return supported by reasonable valuation and EPS growth, a very low Fed fund rate and an ultra-low volatility regime. At the current 12-month forward P/E, we factor in our Fed Fund scenario (2.25% by end-2018) and a different volatility regime. A change of VIX regime from 10% to 15% would push the US equity Sharpe ratio back to its historical average.


Then there is the already record stretched valuations, something even Goldman admitted earlier this week, with "US equities trading above their long-term average and at a level only seen during the dotcom bubble."


US equities have not been in attractive territory valuation-wise for a while. Indeed, on all the main valuation metrics, US equities are trading above their long-term average and at a level only seen during the dotcom bubble. However, expected earnings growth for the next 12 months (12%) is below the 20y annual earnings growth average (14%).


The last risk is that bond yields are going higher, forcing a contraction to PE multiples, as investors shift away from equities into bonds, as the dividend yield on US stocks at 2.0%, is now lower than the 10Y yield  of 2.3%.


Under our scenario, US Treasures will reach 2.70% at the end of 2018. This should be a headwind for equity markets. Indeed, our US equity risk premium is at 2.9%, one standard deviation below the long-term average . Any increase in bond yields would push the equity market further into expensive territory relative to bonds The dividend yield offered by US equities (2.0%) is already lower than the current US longterm bond yield (2.3%).


Finally, SocGen points out something that few other analysts  have admitted: half the S&P rally since the Trump election has been on the back of multiple expansion, with just 48% the result of earnings growth. Furthermore, as SocGen calculates, assuming tax reform passes, a decrease in the US tax from 35% to 20% as planned by Trump’s tax reform would theoretically boost earnings by 8.5%. The 12-month forward P/E has risen 12% over the last 12 months. In other words, contrary to conventional wisdom, more than 100% of Trump"s tax reform is already priced in.


Since Trump’s election, the S&P 500 has risen 24%. Only half of this performance has been driven by earnings growth; the other half is from P/E expansion. Assuming that analysts have not factored tax reform into their earnings forecasts, tax reform expectations have been the driver of P/E expansion. The S&P 500 index tax rate is currently 26.6%. Assuming that US companies generate 43% of their profits abroad (here) and pay 35% of their US profits on taxes (i.e. with no loopholes for US profits), the average tax rate outside the US would be 15.5%. A decrease in the US tax from 35% to 20% as planned by Trump’s tax reform would thus theoretically boost earnings by 8.5%. The 12-month forward P/E has risen 12% over the last 12 months.


Separately, turning to Europe, Socgen acknowledges the euro zone"s economic recovery is in full swing but - in yet another bearish thesis - argues that the current valuations don"t leave "much meat on the bone" and that the expected rise in the Euro could also weigh on exporters in particular, and European stocks in general. Additionally, with the European Central Bank set to progressively unwind its stimulus package, investors are increasingly wary of the amount of debt some companies have accumulated thanks to historically low interest rates.


Cable group Altice, whose shares have collapsed more than 50% in the last 30 days due to concerns on its €50 billion euros pile of debt, and whose debt plunge has been seen by some as the catalyst for the recent junk bond swoon, is an example of what is likely to come, Societe Generale said.


And while the French bank saw pockets of growth in Germany, France and in sectors such as financials, but warned that political risks are still present, notably in Spain with the Catalonia crisis and Italy which faces general elections in 2018. Oh, and the UK too: "We also recommend staying away from the UK as Brexit negotiations are accelerating and several scenarios are possible: only a soft Brexit would be supportive for the FTSE 100.


And yet, after all that, not even Socgen is willing to bite the bullet, and warn that ahead of what clearly is "a bear market is coming" call, investors should dump risk: so ingrained is the desire to run with the penguin herd, that even the most contrarian calls are doused in such a big layer of caveats, Arnold could easily driver his hummer on top of.


To wit: "But then again, should we be outright bears? After all, we do see some value pockets in the market and some specific themes (M&A, consumer in the eurozone)."


Which almost explains the report"s cover page...


Wednesday, November 8, 2017

One Year Later: These Are The Best And Worst Performing Assets Under President Trump


"A Happy Trumpiversary to all our readers this morning"


       - Deutsche Bank


Today marks exactly 12 months since the US election on November 8th 2016, and as Deutsche Bank writes in "A Happy 12 Month Trumpiversary For Markets?" a lot has happened in the last year, although most surprising may be that for all calls of market collapse should Trump get elected, the S&P 500 has actually soared over 20% in the past 365 days according to Goldman which recently calculated that the Trump rally so far ranks as the fourth-best 12-month gain following a presidential election since 1936, trailing only Bill Clinton (1996, 32%), John F. Kennedy (1960, 29%), and George H.W. Bush (1988, 23%). 


As Deutsche Bank then picks up, "needless to say that the victory was unprecedented and also a massive shock around the world. Following Trump’s victory, it was widely expected that we’d see a much higher chance of fiscal spending but also a reinforcement of the backlash against globalisation and associated forces of which migration policy and trade were probably first and foremost. In reality what we have seen in the last twelve months is plenty of evidence of backlash against globalisation, hostility and controversy, but very little in the way of fiscal policy."


Here is the rest of Jim Reid"s observations on how the market has progressed so far under president Trump.


The debacle around healthcare reform probably best characterises the difficulties the President has faced in that regard. So with today marking the one year anniversary, we thought we would take a look at how markets have performed over that time period. For the purpose of this we’ve included our usual monthly performance assets, as well as a few other US assets. First and foremost after running the numbers what stands out is the sheer number of assets which have seen positive returns. Indeed in USD terms, out of a sample of 41 assets, 38 have seen positive total returns.


As we know US equity market performance has been relentless. The S&P 500 has returned +23.5% over the last 12 months and has seen a positive total return in every month since Trump was elected. Interestingly this hasn’t actually been the best 12 month performance for the S&P 500 following an election. That award goes to the 1944 election victory for Franklin D. Roosevelt which saw the S&P 500 rally +36.8% in the year following. The twelve month performance post Trump ranks 7th in the last 23 elections. Meanwhile the Dow has rallied +31.5% and the smaller-cap Russell 2000 index has returned +25.4%. It hasn’t just been US equity markets that have seen blockbuster returns though. Indeed it’s very much been a global rally. The biggest winner is the FTSE MIB (+47.8%) while also in Europe the DAX has returned +34.1%, Stoxx 600 +27.9%, Greek Athex +38.2% and IBEX +24.9%. The UK’s FTSE 100 has returned +21.4% while in Asia the Nikkei is +25.5% and Hang Seng +30.7%.


In bond markets, as we know Treasuries have seen some huge ranges but ultimately performance has been benign. Indeed Treasuries have returned -0.1%. In fairness the big move for Treasuries came in the first few weeks of the election victory where we saw 10y yields spike nearly 80bps. If we take performance from the yield highs of last December then performance is actually more like +3.5%.  


More significant for bonds though has been the shape of the yield curve. Having spiked as high as 136bps, the 2s10s curve has now flattened to just 68bps and is at the flattest since 2007. The 5s30s curve (79bps) is also at the flattest in 10 years. Alternatively 2y yields have moved from 0.854% on election day to 1.629% now and the highest in the last year. 10y yields were at 1.855% on election day, touched as high as 2.626% in March and are now at 2.309%. The equivalent for 30y yields is 2.616% on election day, 3.212% high in March and 2.770% now.


So while equity markets may have benefited from high expectations for fiscal spending, US Treasuries have by and large priced out any expectation with each passing day under Trump’s presidency.


In terms of other markets, credit markets have returned anywhere from +2.9% to +14.4% with higher beta credit outperforming (HY and Sub-Financials). Emerging markets have also had been swept up in the rally with EM bonds returning +4.7% and EM equities +28.6%. Commodities have been more of a mixed bag. Gold is unchanged over the time horizon while Silver has dropped -7.8%. On the other hand Oil is up +26.6% and Copper +29.7%.


Monday, October 2, 2017

The Best And Worst Performing Assets In September, Q3 And 2017 YTD

While September and Q3 were the latest solid month for US risk assets, which ended the month and quarter at all time highs, across the globe returns were relatively more mixed for the sample of assets tracked by Deutsche Bank. That said, a large number of assets (21 of 39 in local currency terms) finished with a total return between -1% and +1% which in part reflects another month of incredibly low volatility with the VIX in particular spending much of it trading between 9.5 and 11.0. In the end, excluding currencies 19 out of 39 assets finished the month with a positive total return in local currency and USD hedged terms.


As Deutsche Bank"s Jim Reid reports this morning, in terms of the movers and shakers, commodities dominated the top of the German bank"s leaderboard with Wheat (+9%), WTI (+9%) and Brent (+8%) all finishing with a high single digit return. It’s worth noting however that this does follow heavy falls for the price of Wheat and WTI in August. Equities generally had a strong month, particularly in Europe where a slightly weaker euro (-1%) aided local currency returns. The DAX (+6%), FTSE MIB (+5%), Stoxx 600 (+4%), Portugal General (+4%) and IBEX (+1%) all finished firmer - the latter underperforming however reflecting elevated tension around the Catalan referendum. Returns in USD terms were 0% to +6%. It’s worth also noting the return for European Banks (+5% local, +4% USD) which got a boost from the slightly higher rate environment. There were two standout underperformers in equity markets however. The first was the Greek Athex which tumbled -8% in local terms although still remains up an impressive +19% YTD. The other was the FTSE 100 which fell -1% under the weight of a strong month for Sterling (+4%) following the BoE signalling an imminent rate hike as well as some progress around Brexit talks. Indeed in USD terms the FTSE 100 was up +3%.


There was a similar story for Gilts (-3%) which underperformed other sovereign bond markets during the month. Bunds, Treasuries, Spanish Bonds and BTPs all returned less than -1% in local terms and up to -2% in USD terms. Meanwhile credit market performance was unspectacular given the move in rates. The notable theme was the outperformance for HY though with EUR and US HY up around +1% in local currency terms. More rate sensitive IG indices were weaker however, albeit outperforming sovereign bond markets. EU and US IG Non-Fin, Fin Sen and Fin Sub finished in the range of 0% to -0.5% in local terms.


Taking a step back, for Q3, the big winners during the quarter were commodities and EM markets. Of the top ten in local currency terms, seven fit one of these categories including the Bovespa (+18%), Brent (+15%), Micex (+14%), WTI (+12%), Copper (+10%), MSCI EM Equities (+8%) and the Shanghai Comp (+6%). The FTSE MIB (+11%), Hang Seng (+9%) and Portugal General (+6%) round out the other three places.


DM equity markets were generally up +1% to +5% (S&P 500 returned +5% and Stoxx 600 +3%). The IBEX (0%) and Athex (-8%) were the notable underperformers. Meanwhile sovereign bond markets witnessed very modest positive returns of less than +1% (although +4% for European bond markets in USD terms). Gilts did however return -0.5% in local terms. Credit market performance was solid reflecting a largely carry-return environment. Higher beta credit outperformed (HY and Fin Sub +2% in local terms) while IG indices were around +1% for the quarter.


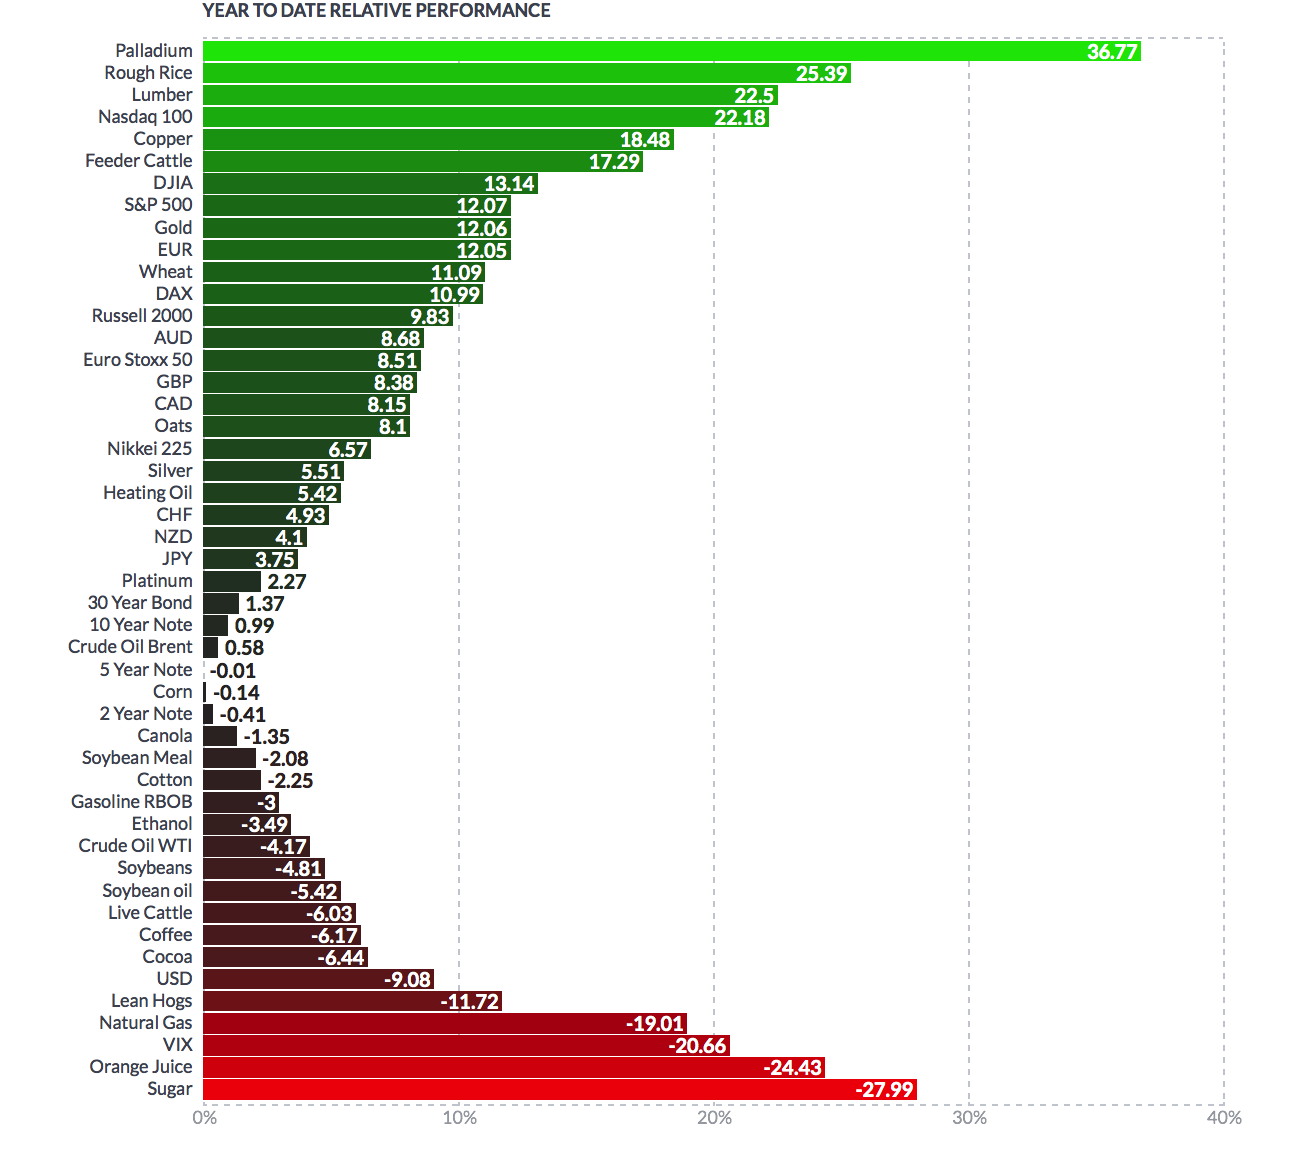
Finally, here is a snapshot of the best and worst assets, and everything inbeteen, since January 1, 2017.


Saturday, September 30, 2017

Gold Matches S&P 500 Performance In First 3 Quarters; Up 12% 2017 YTD

Editor Mark O"Byrne


- Gold climbs over 12% in YTD, matching S&P500 performance
- Palladium best performing market, surges 36% 2017 YTD
- Gold outperforms Nikkei 225, Euro Stoxx 50, FTSE and ISEQ
- Geo-political concerns including Trump and North Korea supporting gold
- Safe haven demand should push gold higher in Q4
- Owning physical gold not dependent on third party websites and technology remains essential


Click to enlarge. Source Finviz.com


In the year-to-date the gold price performance has matched the S&P 500, climbing over 12%.


Gold"s matching of the S&P 500 is particularly impressive when you consider the record-breaking performance of the benchmark stock market index in the last year. Yesterday it advanced 0.1% to 2510.06, a new all time record high price.


It is also impressive considering sentiment towards stocks is shall we say "irrationally exuberant", while sentiment towards gold remains muted despite gold eking out gains in 2016 and now again in 2017.


The precious metal has performed well predominantly due to rising uncertainties regarding North Korea, Trump and the political mess in the U.S. and other geopolitical tensions.


Its strong performance is despite noise from the US Federal Reserve regarding its alleged plans to tighten money supply and increase rates. Other major central banks have also provided similar indications.


Elsewhere, gold has outperformed both the Euro Stoxx 50 and Nikkei 225 which are 8.5% and 6.5% higher respectively. The UK"s FTSE and Ireland"s ISEQ are underperforming and have the hallmarks of markets that are topping out.


The FTSE and the ISEQ are 2.5% and 4.25% higher year to date.


Silver, platinum and palladium up 5.5%, 2% and 37%  YTD respectively


Gold wasn"t the only precious metal that performed well in the last three quarters. All four precious metals have climbed in price.


Palladium has been the headline grabbing asset in the last year. In the year-to-date the industrial precious metal is up by nearly 37%. Holdings in exchange-traded funds backed are close to the highest since the beginning of the year.


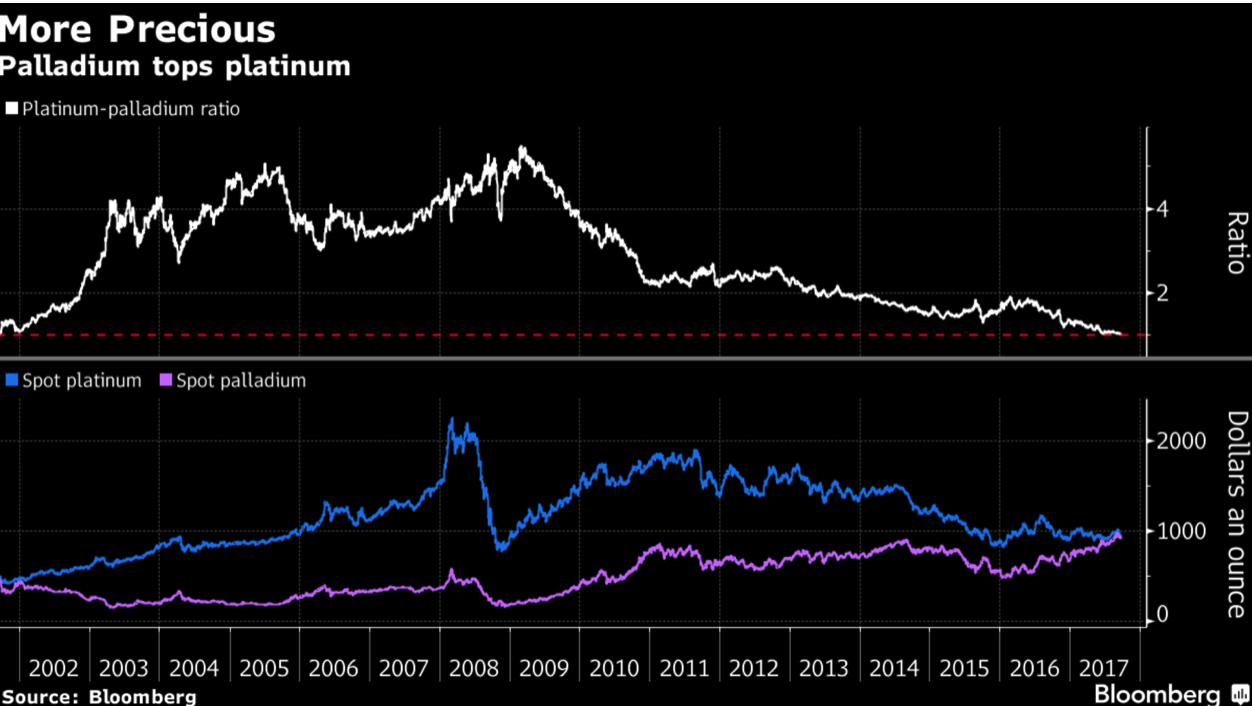
This week for the first time since 2001, palladium topped the platinum price. Palladium is predominantly used in pollution-control devices for gasoline-powered cars and trucks. In contrast platinum is used in diesel-powered engines.


Governments have been slowly clamping down on diesel due to concerns over its role in pollution and emissions scandals. Platinum is up by only 2% this year. Some believe the metal has been oversold in recent days and there is too much heat in the palladium market.palladium tops platinum
Meanwhile silver is refusing to go below $16/oz. Some investors may feel disappointed that it has failed to break above $19/oz this year, despite strength in gold.


Investors in silver must continue to take heart that silver does still stand to gain whenever the U.S. dollar loses strength or concerns about the stock market creates demands for assets to hedge risk with.


Geo-political concerns with North Korea and elsewhere fuel demand


In a recent Bank of America Merrill Lynch survey the biggest "tail risk" seen by investors was North Korea"s missile risk.


This was ahead of policy missteps in central banks of the US and China, and credit tightening in China.


However, worries over nuclear war are not the only concern fuelling the price of gold. Uncertainty regarding political haggling and stalemate in Washington are also providing key support.


Trump cronyism


Critics of President Trump are concerned that he and his team have achieved very little since his inauguration. Any plans that have been proposed are seemingly poorly devised and quickly shot-down.


This week the Republicans failed once again to defeat Obamacare, a key component of Trump"s election promises. Also the White House announced a plan for a lower corporate tax rate and to cut the highest individual income tax rate.


Critics argued however that the plan was awash with cronyism and helped the wealthy. There was also little indication given as to how the tax cuts would be funded amid risks that deepening U.S. deficits may further weaken the dollar.


Expect more safe haven demand next quarter 


As we all know, gold is a barometer for uncertainty. With a 12% climb in the last year and no sign of risks abating, there is little reason to not expect the price to continue to climb.


Should gold reach $1,400, then this will be a four-year high and a sure sign of a bullish breakout for the precious metal.


We shouldn"t invest in gold because of some ambulance-chasing punt on geopolitical disaster. Gold should play a key role in your investment portfolio as a tool for protecting against risk and hedging declines in stock and other markets and currency devaluations.


In truth, there is still a huge amount of uncertainty regarding the outlook for the global economy and global markets.


No one knows how central banks" attempts to unwind the last decade of monetary policy will play out, nor does anyone know how President Trump"s government will survive in an America that will continue to feel more pressure from the likes of Russia and China.


Investors need to stay focused on the medium and especially the long-term and the bigger picture.


Editors Conclusion


Sentiment in the gold market remains quite poor. Most of the public remains on the sidelines  and there is very little positive coverage of gold.


Nor is there an appreciation of the scale of economic, geo-political and monetary risks facing investors and savers today.


There remains a fundamental lack of knowledge of the still very strong supply and demand factors driving the physical gold market and a lack of understanding as to why gold remains a vitally important asset to own in a portfolio.


Many stock markets are at record highs. Many bond markets are at record highs. Many property markets are at record highs. This makes gold which is remains nearly 33% below its record high very attractive from a hedging and diversification perspective.


Real diversification through owning allocated and segregated gold not dependent on third party websites and technology remains essential.


The old Wall Street adage to always keep 10% of your wealth in gold and hope that it does not work remains prudent.


Lets hope for the best but be prepared for less benign financial scenarios...


Gold and Silver Bullion - News and Commentary


Gold steady, on track for first monthly loss in three (Reuters.com)


Dollar Pressured After Strong Week; Bonds Advance: Markets Wrap (Bloomberg)


India May Have a Spot Gold Exchange in 12 to 18 Months (Bloomberg)


Gold rebounds from 6-week low as dollar drops (Reuters.com)


U.S. trade deficit shrinks in August, but the gap has widened in 2017 (Marketwatch)


 Source: Zerohedge


Gold and cash reign as U.S. fund investors sell stocks: Lipper (Reuters)


Is This The Real Driver Of Gold"s Recent Weakness? (Zerohedge)


Here’s what this “old school” investor thinks of bitcoin… (Stansberry CH)


You"re Likely A Lot Less Prepared For Crisis Than You Realize (Peak Prosperity)


Rickards Warns "Cracks In The Dollar Are Getting Larger" (Zerohedge)


Gold Prices (LBMA AM)


29 Sep: USD 1,286.95, GBP 963.15 & EUR 1,090.82 per ounce
28 Sep: USD 1,284.30, GBP 961.04 & EUR 1,091.40 per ounce
27 Sep: USD 1,291.30, GBP 963.83 & EUR 1,099.54 per ounce
26 Sep: USD 1,306.90, GBP 969.59 & EUR 1,105.38 per ounce
25 Sep: USD 1,295.50, GBP 957.89 & EUR 1,089.26 per ounce
22 Sep: USD 1,297.00, GBP 956.15 & EUR 1,082.09 per ounce
21 Sep: USD 1,297.35, GBP 960.56 & EUR 1,089.00 per ounce


Silver Prices (LBMA)


29 Sep: USD 16.86, GBP 12.60 & EUR 14.27 per ounce
28 Sep: USD 16.82, GBP 12.53 & EUR 14.28 per ounce
27 Sep: USD 16.89, GBP 12.58 & EUR 14.38 per ounce
26 Sep: USD 17.01, GBP 12.67 & EUR 14.43 per ounce
25 Sep: USD 16.95, GBP 12.57 & EUR 14.27 per ounce
22 Sep: USD 16.97, GBP 12.52 & EUR 14.18 per ounce
21 Sep: USD 16.95, GBP 12.58 & EUR 14.24 per ounce


Recent Market Updates


- Gold Standard Resulted In “Fewer Catastrophes” – FT
- Financial Advice From Man Who Made $1+ Billion in 1929 – Importance Of Being Patient and “Sitting”
- “Gold prices to reach $1,400 before the end of the year” – GoldCore
- Commodities King Gartman Says Gold Soon Reach $1,400 As Drums of War Grow Louder
- Bitcoin “Is A Bubble” but Gold Is Money Says World’s Biggest Hedge Fund Manager
- Pensions and Debt Time Bomb In UK: £1 Trillion Crisis Looms
- Gold Investment “Compelling” As Fed May “Kill The Business Cycle”
- “This Is Where The Next Financial Crisis Will Come From” – Deutsche Bank
- Global Debt Bubble Understated By $13 Trillion Warn BIS
- Bitcoin Price Falls 40% In 3 Days Underlining Gold’s Safe Haven Credentials
- Gold Up, Markets Fatigued As War Talk Boils Over
- Oil Rich Venezuela Stops Accepting Dollars
- Massive Equifax Hack Shows Cyber Risk to Deposits and Investments Today

Tuesday, July 18, 2017

Chinese Corporate Financials Continue Disturbing Trend Of Deterioration

Authored by Bryce Coward via Knowledge Leaders Capital blog,


Highlighting the deteriorating trend in Chinese corporate financials has been an annual feature our of this blog. This year, instead of looking at just the CSI 300 constituents, we chose to broaden our universe by using the FTSE All A Share Index, an index of about 2000 Chinese A shares. This should give us the most accurate read on the state of corporate China.


For at least the last decade Chinese corporations have levered up, both through debt and working capital, in an attempt to keep the music playing and without regard to stability or profitability. As we will see, 2016 was no different. As an aside, all of the data in this post show aggregated (summed up) metrics for all non-financial companies. For example, sales growth numbers show the sum total of 2016 non-financial constituent sales relative to the sum total of 2015 non-financial constituent sales. Aggregating the data in this way gives us a good top down view without having to control for outlier companies that may be small and irrelevant.


Starting with the balance sheet, one constant characteristic of Chinese corporate behavior has been their willingness to lever up. There are a number of ways to measure leverage, but one of our favorites is net debt as a percent of equity. From 2005-2016 net debt as a percent of equity increased 126%. From 2015-2016 along it increased by 13% to 143%, the highest on record. Meanwhile debt as a percent of capital ticked up again to 63% in 2016 – also the highest reading on record – while cash as a percent of total capital fell to its lowest ever reading of 9%. Luckily, financial leverage (assets relative to equity) remained constant at an egregiously high 6.9x.


Moving on to some ratios of working capital metrics as a percent of sales, we can see that 2016 was just a continuation of an alarming decade-long trend of Chinese companies gutting corporate efficiency to finance sales. From 2005-2016 accounts receivable as a percent of sales has increased 173%, accounts payable as a percent of sales has increased 73% and inventory as a percent of sales has increased 86%. All three metrics increased to an all-time high in 2016.


Building up one’s working capital could be a strategy to manage exploding top line growth, but unfortunately that is not the case for Chinese companies. Sales and net income haven’t grown since 2014 and net income actually contracted in 2016. Cash flow from operations also fell 18% for the largest year-on-year contraction since at least 2006. Plunging cash flow is an indication that the earnings decline of 1% could be painting too rosy a picture.


This brings us to something we like to call Chinese channel stuffing – or the tendency of corporate China to stuff the supply chain with accounts receivable and accounts payable so as to keep sales/sales growth at the desired level. Since 2012 both current liabilities and current assets have outpaced sales growth by between 2%-10% annually. In 2016 both metrics outpaced sales growth by 6%. This is to say, in order for corporate China in aggregate to have generated flat sales in 2016, they needed to grow working capital by 6%. In order for corporate China to have generated flat sales for two consecutive years they needed to grow working capital by a cumulative 16%.


The good thing is that, if you can believe the earnings and cash flow numbers, margins have remained relatively healthy. Net profit margins have remained at the historical average of 8% while cash flow margins stood at a robust 27% in 2017.


But, flat margins and growing balance sheets make for deteriorating profitability stats. In 2016 ROE dropped to an all-time low of 9%, ROA dropped to 5% and ROIC dropped to an all-time low of 4%.


There unfortunately are not a lot of positive things to say about the trends in corporate China. Much of the above is of course driven by SOEs at the behest of the government, but that doesn’t make the trends look any better. No one knows what the tipping point is and how long this can continue, but it goes without saying that we’d like to see these firms align the growth of their balance sheets to the growth of their income statements as soon as possible.

Tuesday, July 4, 2017

The Best And Worst Performing Assets In The First Half Of 2017

The first half of the year may have been forgettable for a majority of the smart money and hedge funds, with nearly 80% once again underperformingttheir benchmarks due to months of P&L crushing short squeezes, but it was a buoyant time for equity markets and virtually all asset classes, for one simple reason: a record central bank liquidity injection of over $1.5 trillion YTD. Of course, that central banks had to flood markets with so much liquidity as the global economy is allegedly recovering is the main reason why nobody actually believes in said "recovery", and neither do the central bankers.


They did succeed however in generating outsized returns for the first 6 months of 2017, and as Deutsche Bank"s Jim Reid writes, the first half of 2017 has been an overall positive half year for our sample of assets. Reid continues below:


Indeed with measures of volatility for a number of asset classes at historically low levels, 32 out of 39 assets in our sample have delivered a positive total return while 35 assets have done similar in USD terms. In summary, equity markets have led the way with 9 out of the top 10 positions in our leaderboard. The peripherals stand out the most with the Greek Athex (+40%), IBEX (+24%) and Portugal General (+22%) all delivering decent double digit returns. European Banks (+20%) have extended a rally which started this time a year ago following a torrid start to 2016. EM equities (+19%), Stoxx 600 (+17%) and the S&P 500 (+9%) have also seen a more than solid start to the year. For bonds, in USD terms returns sit in the +2% to +9% range with the peripherals outperforming.


It’s worth noting that given the Euro has rallied some +9% this year, in local currency terms European Bond markets are actually mostly flat to modestly down for the year. Meanwhile for credit, returns for European indices are +9% to +13% in USD terms (and 0% to +4% in local currency terms) while returns for US credit are +3% to +6%. Finally, similar to the below for June and Q2, Oil stands out for the biggest underperformer in H1 with Brent and WTI down -17% and -14% respectively with the market still questioning the effectiveness of the major producer supply curb.


In terms of the month of June itself, it has been a mixed one for our sample of assets. Markets have had a few themes to contend with. The first is the underperformance of Sterling assets in the wake of a surprise UK election result. The second was the sharp decline in the price of Oil and the third was the big spike in volatility – particularly for rates - in the last week of the month following a chorus of hawkish central bank speak. The end result was this for our sample: 20 of our 39 assets ended the month with a positive total return in local currency terms and 24 in USD hedged returns. It is however worth noting that the range of returns was relatively small. Indeed in USD terms, 29 of our 39 assets ended the month with a total return in the +2% to -2% range.


Looking at the movers and shakers this month, there isn’t much of a theme to note at the top of leaderboard. In fact it’s a fairly diverse mix with the top 5 performers this month being Wheat (+19%), Greek equities (+8%), Copper (+5%), Shanghai Comp (+4%) and European Banks (+3%) in USD terms. For equities, it was a fairly mixed month with some volatility into month end helping to create some divergence. The Micex (-3%) and Bovepsa (-2%) were the notable underperformers reflecting lower Oil and political turmoil, respectively. The FTSE 100 returned -1% (and -3% in local terms) while the Stoxx 600 was also  -1%. The S&P 500 finished up less than +1% while EM equities were +1%.


For bond markets returns were subdued but in the case of Europe, mostly positive despite the big rates re-pricing in the last week. BTPs (+2%), Spanish Bonds (+2%) and Bunds (+1%) all finished with low single digit returns while Treasuries ended the month flat. Much like equities, Gilts (-1% in USD and -2% local) saw negative total returns over the month on political concerns and higher inflation. There were similar returns for credit markets suggesting little evidence of much spread tightening over the month. Generally speaking EUR credit outperformed US when looking at USD hedged returns. EU HY, EU Fin Sub, EU Fin Sen and EU IG Non-Fin all returned between +1% and +2% while equivalent US indices finished in a 0% to +1% range.


At the bottom of the leaderboard the most notable standout was the -5% declines for WTI and Brent Oil. That includes a late bounce in the last week or so. Prior to that, Oil had been down as much as -12% at one stage during the month. Elsewhere Silver (-4%) also had a bit of a month to forget as did Gold (-2%).


Thursday, March 30, 2017

Despite Record Highs, Brexit Still A Losing Bet For Dollar Investors

One day after UK PM Theresa May officially unleashed the Article 50 letter proclaiming the beginning of the end of Britain within the EU, the UK stock market had rallied over 16% since the vote that elites said would bring armageddon. However, remove the support of a collapsed currency and things look very different for a US dollar investor.


The UK"s FTSE 100 - whose megacap members get the majority of their revenue from outside the UK - looks very different when adjusted for the depreciation of the pound.


In fact, for a dollar investor, they remain underwater since the Brexit vote, having never seen a "return to even" since, thanks to the near 19% collapse in cable...


Even as dollar investors in Japan, Germany, and the US seem to have done uniformly well...


What sets the Gold Price – Is it the Paper Market or Physical Market?

Submitted by Ronan Manly, BullionStar.com


The following article is arranged in Question and Answer (Q & A) format. Through the Q & A approach, this article raises some important issues about price discovery in the gold markets and aims to explain the view that the gold price is being set by the paper gold markets.


BullionStar’s CEO Torgny Persson and precious metals analyst Ronan Manly are of the opinion that due to the structure of contemporary gold markets, it is primarily trading activity in the paper gold markets which sets the international price of gold.


Question: The international gold price is constantly quoted in the financial media alongside other major financial indicators. What is this international gold price, and how is it defined?

The international gold price usually refers to the price of gold quoted in US Dollars per troy ounce as traded on the 24-hour global wholesale gold market (XAU/USD). Gold is traded non-stop globally during the entire business week, creating a continuum of international gold price quotes from Sunday evening New York time all the way through to Friday evening New York time. Depending on the context, this international gold price sometimes refers to a spot gold market quote, such as spot gold traded in London, and at other times may refer to the front month of a gold futures contract price as traded on the US Commodity Exchange (COMEX). The front month contract is a nearby month which will usually exhibit the highest trading volume and activity.


The international gold price can also at times be referring to the LBMA Gold Price benchmark price as derived during the London daily gold price auctions (morning and afternoon auctions). LBMA is an abbreviation for London Bullion Market Association.


Therefore, this "international price" could be referencing a spot gold price, a futures gold price, or a benchmark gold price, but all three would, at a comparable time, be roughly similar in magnitude.


Question: Where does this international gold price come from, where is it derived?

Recent empirical research has determined that gold price discovery is jointly driven by London Over-the-Counter (OTC) spot gold market trading and COMEX gold futures trading, and that the "international gold price" is derived from a combination of London OTC gold prices and COMEX gold futures prices. See “Who sets the price of gold? London or New York (2015)” by Hauptfleisch, Putni?š, and Lucey.


In general, the higher the trading volume and liquidity in a specific asset market, the more that market contributes to discovering prices for that asset. This is also true of the global gold market. Between them, the London OTC and New York trading venues account for the vast majority of global gold trading volume, and in 2015, the London OTC spot market represented approximately 78% of global gold market turnover while COMEX accounted for a further 8% (See Hauptfleisch, Putni?š, and Lucey (2015)).


Based on London gold clearing statistics for 2016, a quick calculation shows that total trading volume in the London OTC gold market is estimated to have been at least the equivalent of 1.5 million tonnes of gold in 2016, while trading volume of the 100 oz COMEX gold futures contract reached 57.5 million contracts during 2016, equivalent to 179,000 tonnes of gold. Gold trading volume on the London OTC gold market in 2016 was therefore about 8.4 times higher than trading volume in the COMEX 100 oz gold futures contract.


LBMA Unallocated Gold Trading, 1.5 million tonnes in 2016


However, COMEX has been found, by the above academic research, to have a larger influence on price discovery than London OTC, despite the lower trading volumes of COMEX. This is most likely due to a combination of factors such as COMEX" accessibility and extended trading hours via use of the GLOBEX platform, the higher transparency of futures trading compared to OTC trading, and the lower transaction costs and ease of leverage in COMEX trading. In contrast, the London OTC gold market has limited trading hours (during London business hours), barriers to wider participation since it"s an opaque wholesale market without central clearing, and trading spreads which are dictated by a small number of LBMA bullion bank market-makers and a handful of London-based commodity brokerages.


The bottom line though is that both sets of trading statistics, London OTC and COMEX, are gigantic in comparison to the size of the underlying physical gold markets in London and New York.


Question: So, does the physical gold market or the paper gold market set this international price of gold?

The international gold price is purely set by paper gold markets, in other words it is set by non-physical gold markets. Based on their respective gold market structures, the London OTC gold market and COMEX are both paper gold markets. Supply of and demand for physical gold plays no role in setting the gold price in these markets. Physical gold transactions in all other gold markets just inherit the gold prices that are discovered in these paper gold markets.


The London OTC gold market predominantly involves the trading of synthetic unallocated gold, where trades are cash-settled and not physically delivered (i.e. no delivery of physical gold). These synthetic gold transactions have little connection to any underlying gold holding, hence they are de-facto gold derivative positions. By definition, unallocated gold positions are just a series of claims on bullion banks where the holder is an unsecured creditor of the bank, and the bank has a liability to that claim holder for an amount of gold. The holder, on its side, takes on credit risk towards the bullion bank. The London OTC gold market is therefore merely a venue for trading gold credits.


The London OTC gold market is also one in which the bullion banking participants employ fractional-reserve gold trading to create large amounts of paper gold out of thin air (analogous to commercial lending), where the trading is also leveraged and opaque, and where this paper gold is only fractionally backed by physical gold. This “gold” is essentially synthetic gold. See BullionStar Gold university article "Bullion banking Mechanics" for further details on fractional-reserve gold trading.


Since COMEX only trades exchange-based gold futures contracts, it is, by definition, a derivatives market. Cash-settlement is the norm. Only 1 in 2500 gold futures contracts traded on COMEX is delivered with a transfer of warrants representing metal. The rest of the contracts are cash-settled. This means that 99.96% of COMEX gold futures contracts are cash-settled. See BullionStar US Gold Market Infographic for details.


Given COMEX trading gold futures and London trading synthetic unallocated gold, both the London and COMEX gold markets essentially trade gold derivatives, or paper gold instruments, and by extension, the international gold price is being determined in these paper gold markets.


Beyond the London OTC gold market and COMEX, all other gold trading venues are predominantly price takers that take in and use the gold prices established by the paper gold markets in London and New York. These other markets include physical gold markets around the world which look to the international gold price as an input into their domestic gold price setting mechanisms and conventions.


Question: Explain a little more about the market structures of these London OTC and COMEX markets?

By definition, futures trading is trading of securities whose value is derived from an underlying asset but whose securities are distinct from those of the underlying asset, i.e. derivatives. COMEX gold futures contracts are derivatives on gold. COMEX registered gold stocks are relatively small, very little physical gold is ever delivered on COMEX, and even less physical gold is withdrawn from COMEX approved gold vaults. COMEX gold trading also employs significant leverage. Hauptfleisch, Putni?š, and Lucey (2015) state that “such trades [on COMEX] contribute disproportionately to price discovery”. Note that the COMEX gold futures market is actually a 24-hour market but its liquidity is highest during US trading hours.


Turning to the London OTC gold market, nearly the entire trading volume of the London OTC gold market represents trading in unallocated gold, which to reiterate, merely represents a claim by a position holder on a bullion bank for a certain amount of gold, a claim which is rarely exercised. London OTC gold trades also predominantly cash-settle. Traders, speculators and investors in unallocated gold positions virtually never take delivery of physical gold.


This is a fact confirmed by a UK HMRC / LBMA Memorandum of Understanding published in 2013 which states that in the London gold market “investors acquire an interest in the metals, although in most situations, physical delivery will not occur and in 95% of trades, trading in unallocated metals will be undertaken.” Additionally, in 2011, the then LBMA CEO Stuart Murray also confirmed that there were ‘very substantial amounts of unallocated gold’ held in London.


A 2015 legal opinion on unallocated gold drafted by respected global law firm Dentons describes unallocated gold as ‘synthetic’ gold and as a derivatives transaction.


Dentons states that “the reality of unallocated bullion trading is that buyers and sellers rarely intend for physical delivery to ever take place. Unallocated bullion is used as a means to have “synthetic” holdings of gold and so obtain exposure to the price of gold by reference to the London gold fixing.”


Although the LBMA does not publish gold trading volumes on a regular basis, it did publish a one-off gold trading survey covering Q1 2011 in which it was revealed that during the first quarter of 2011, 10.9 billion ozs of gold (340,000 tonnes) were traded in the London OTC gold market. During the same period, 1.18 billion ozs of gold (36,700 tonnes) were cleared in the London OTC gold market. This would suggest a trading turnover to clearing turnover ratio of 10:1. In the absence of live trading data from the London OTC gold market, this 10:1 proxy ratio can continue to be applied as a multiplier to the LBMA London Gold Market daily clearing statistics, which are published every month, and which are always phenomenally high.


For example, average daily clearing volumes in the London Gold Market during January 2017 totalled 20.5 million ounces. That’s the equivalent 638 tonnes of gold cleared per day in London.  On a 10:1 trading to clearing multiple, that’s the equivalent of 6,380 tonnes of gold traded per day, or 1.6 million tonnes of gold traded per year.


Since there are only about 6,500 tonnes of gold stored in London, most of which represents static holdings of central banks, ETFs and other holders, the London OTC gold trading activities are totally disconnected from the underlying physical gold holdings. Furthermore, only about 190,000 tonnes of gold have ever been mined throughout history, half of which are estimated to be held in the form of jewellery. Therefore, the trading of nearly 6,500 tonnes of gold per day within the London OTC gold market has nothing to do with the physical gold market, yet perversely, this trading activity drives global gold price discovery and the pricing of physical bullion trades and transactions.


Revealingly, according to the LBMA bullion bankers who established the reporting of London gold clearing statistics, who specifically were the then LMPCL chairman, Peter Fava, and JP Morgan’s Peter Smith, these LBMA gold clearing statistics include trading activities such as “leveraged speculative forward bets on the gold price” and “investment fund spot price exposure via unallocated positions”, activities which are just side-bets on the gold price. See October 2003 article titled “Clearing the Air Discussing Trends and Influences on London Clearing Statistics“, from LBMA Alchemist Issue 32.


In essence, trading activity in the London gold market predominantly represents huge synthetic artificial gold supply, where paper gold trading is deriving the price of gold, not physical gold trading. Synthetic gold is just created out of thin air as a book-keeping entry and is executed as a cashflow transaction between the contracting parties. There is no purchase of physical gold in such a transaction, no marginal demand for gold. Synthetic paper gold therefore absorbs demand that would otherwise have flowed into the limited physical gold supply, and the gold price therefore fails to represent this demand because demand has been channelled away from physical gold transactions into synthetic gold.


Likewise, if an entity dumps gold futures contracts on the COMEX platform representing millions of ounces of gold, that entity does not need to have held any physical gold, but that transaction has an immediate effect on the international gold price. This has real world impact, because many physical gold transactions around the world take this international gold price as the basis of their transactions.


Although gold clearing volumes and the LBMA"s market survey provide some useful inputs into calculating London gold trading volumes, there is very little known publicly about how much physical gold actually trades in the London gold market. This is because the LBMA and its member banks choose not to reveal this information. There is no trade reporting in the London OTC gold market, no reporting of physical gold vault positions, no reporting of the unallocated gold liabilities of LBMA member bullion banks, and no reporting of how much physical gold in total these bullion banks retain to back up their fractional-reserve unallocated gold trading system. However, physical gold trading is by definition an extremely minuscule percentage of average daily trading volumes in the London OTC gold market. For details on the workings of the gold market in London, see BullionStar Infographic the "London Gold Market".


While one of the three components that comprise the London gold clearing statistics is stated to be “physical transfers and shipments by LPMCL clearing members”, the LBMA doesn’t even see fit to publish a breakdown of these 3 components. This compounds the secrecy and is another example of where bullion banks and central banks keep the global gold market in the dark about how much gold is being physically transferred and shipped.


Question: How do local gold markets around the world use the international gold price?

Local gold markets all around the world look to the international gold price, and take in this gold price, usually quoting their local country gold prices in comparison to the international gold price.


In the physical gold market, product pricing of gold coins and bars is based on a combination of the spot gold price plus a premium. The premium is that part of the product price in excess of the value of the precious metal contained in the coin or bar. Given that the physical gold market is a price taker, physical gold market spot prices feed in from where the price is being discovered, i.e. the international gold price.


For example, the 2017 issue of the Royal Canadian Mint 1 troy ounce Gold Maple Leaf bullion coin is quoted on the BullionStar website at a US dollar price which reflects the US dollar spot price of gold plus a premium.


Gold coin and gold bar premiums are based on a number of factors. Part of the premium will reflect natural minting / refining costs such as fabrication, marketing, distribution and insurance costs. If the products have been distributed through a wholesaler, the premium will reflect a wholesaler mark-up.  Another component of a premium is semi-variable and reflects physical market imbalances caused by supply and demand fluctuations. If demand for a gold coin or gold bar is high, its premium will increase. If supply of the product is abundant, the premium would tend to be lower than if in short supply.


In general, premiums on gold coins are higher than those on gold bars, while premiums on large gold coins and gold bars are lower than premiums on smaller gold coins and gold bars.


Question: What contribution does the Shanghai Gold Exchange make to gold price discovery and does the SGE, with its large physical trading, influence the international gold price?

The Shanghai Gold Exchange (SGE) is the world’s largest physical gold exchange and nearly all physical gold bars in China flow through the SGE. Gold trading volumes and gold withdrawal statistics for the SGE are certainly impressive. For the year 2016, total SGE gold trading volumes reached 24,338 tonnes, a 43% increase over the 2015 figure of 17,033 tonnes. SGE trading volumes include physical contracts, deferred contracts, OTC trades settled through the SGE, and also trading volumes on the Shanghai international Gold Exchange (SGEI). In 2016, physical gold withdrawals from the SGE totalled 1,970 tonnes, down 24% from 2015’s withdrawals of 2,596 tonnes, but still huge on an absolute basis because these withdrawals represent actual physical gold taken out of the SGE vaults.


By the end of 2016, the SGEI (International Bourse), which was launched in September 2014, had recorded cumulative trading of nearly 9,000 tonnes of gold. The Shanghai Gold Benchmark Price (a.k.a. Shanghai Gold Fix), which was launched on 19 April 2016, is a gold auction for 1 kilo gold bars of 99.99 purity quoted in RMB. Over the 8 months from launch to end of 2016, the Shanghai Gold Fix had traded 569 tonnes, which equates to over 1.5 tonnes per day on average.


All in all, the SGE has generated impressive physical gold trading volumes (24,338 tonnes for 2016) and withdrawals (1970 tonnes for 2016). For the sake of comparison, compare these annual SGE physical gold trading volumes to the bloated London OTC gold market where trading volumes of approximately the equivalent of 6,500 tonnes of gold per day are the norm. Such a comparison reveals the fractional-reserve nature of the London gold market and the fact that physical transactions can only be a minuscule fraction of the London market.


But does SGE trading affect the international gold price as derived in the London OTC and COMEX markets, or is the SGE a price taker?


The short answer is that the SGE does not influence the international price and the SGE is a price taker. There may be some lagged influence by the SGE on the international price but this would require further study. The Chinese gold market is still a closed gold market with market frictions and distortions. Gold can be imported into China but cannot in general be exported out of China. There is therefore no freedom of movement of gold out of China. Gold imports into China are strictly controlled via import licenses and these licenses are only issued to a small number of Chinese and foreign banks.


But it’s worth looking at SGE premiums to see if changes in SGE premiums ever provide any signalling ability for subsequent changes in the international gold price. SGE premiums arise when the Shanghai gold price trades above the international gold price. SGE premiums are a possible gauge to determine whether SGE trading affects the international gold price. In November and December 2016, SGE premiums rose sharply from less than 0.5% to over 3% which was a period in which gold imports into China surged. However, during that same period, the international gold price fell. So in this case, the expanding SGE premiums had no effect on the international gold price.


That example was just eyeballing, but a recent study by Metals Focus (MF) consultancy, titled "Links Between the Chinese and International Gold Prices" also found that the correlations between changes in the LBMA Gold Price (AM) and SGE premiums are not significant and were in some cases even found to be negative, which in summary means that SGE trading was not affecting the international gold price. MF also calculated some lagged correlations to see if SGE premiums influence subsequent changes in the LBMA Gold Price, due to, for example, "increased shipments of bullion to China over subsequent days". MF claims that "SGE premiums have a modest but positive and statistically significant impact on future gold price [LBMA Gold Price] moves" however, correlation is not causation. Properly functioning financial markets are supposed to instantaneously reflect pricing information in other markets, not take days to reflect it. There are also too many other variables which could also be responsible for explaining why the LBMA Gold Price moved higher after SGE premiums had previously moved higher.


However, unlike the OTC and COMEX, the Shanghai Gold Exchange is structured around physical gold price discovery. The establishment of a gold exchange in Shanghai was first referenced in China"s 10th Five Year plan in 2001 as an integral part of the nation"s gold liberalisation strategy. Following its launch in 2002, the SGE was quick to promote physical gold ownership and by 2004 was allowing private citizens in China to transact on the Exchange and purchase gold bullion. On the SGE, physical delivery of gold is the norm, not the exception. The SGE has a network of 61 gold vaults in 35 cities across China.


This makes the SGE a nature candidate to take the lead in pricing real physical gold and acting as a physical gold price discovery centre if and when the physical gold markets detach from the paper gold markets, and physical gold demand and supply becomes the natural determinant of the international gold price.


LBMA Gold Price auction


Question: What is the significance of the LBMA Gold Price?

The LBMA Gold Price is a twice daily auction for unallocated gold controlled by the LBMA. The final output of the auction is a benchmark gold price. The auction is conducted in US Dollars, however the derived price is also published in 11 other currencies. This auction is the successor to the London Gold Fixing and the benchmark is now a ‘Regulated Benchmark’ under UK financial regulations and is administered by ICE benchmark Administration (IBA), part of the ICE exchange group. But the new auction mechanics are fundamentally similar to the older London Gold Fixing mechanics. The auction opening prices are based on COMEX and London OTC price quotations as well as trading prices at auction opening times, i.e. at 10:30 am and 3:00 pm respectively.


Structurally, the LBMA Gold Price auction has very narrow direct participation, with only a handful of LBMA member bullion banks being authorised by the LBMA to take part. These are the same bullion banks which are the market makers and largest traders in both London OTC gold market trading and in COMEX futures gold trading. The LBMA Gold Price auctions therefore lack broad market participation and is not representative of the broader gold market. The LBMA and ICE Benchmark Administration also refuse to reveal the identities of the auction chairpersons, a refusal which suggests that those now involved have connections to the former scandal tainted London Gold Fixing auction. They also refuse to reveal how the chairperson chooses the opening price for the auctions. See "Six months on ICE – The LBMA Gold Price" for more details.


Not surprisingly, the LBMA gold auctions also settle in unallocated gold, so trading and settlement in the auction is also detached from physical gold markets. Trading volumes in the daily gold auctions usually only reach the equivalent of 1-2 tonnes of unallocated gold transfers, and rarely exceed 3 tonnes. So not only do the LBMA gold auctions not offer wide participation to the thousands of gold trading entities around the world, the volumes traded in the auctions are not representative of the global gold market and the benchmark is therefore not a reliable representation of the global gold market.


Perversely however, the LBMA Gold Price benchmark price is very influential in the gold world in that it is a widely-used valuation source for gold-backed Exchange Traded Funds (ETFs) such as the SPDR Gold Trust and the iShares Gold Trust. Furthermore, it is often used ad a transaction reference price by physical bullion dealers when purchasing physical gold from refineries and suppliers. The LBMA Gold Price is also widely used as a benchmark for valuing financial products such as ISDA gold interest rate swaps, gold options and other gold derivatives, and is even used by other futures exchanges as a reference point on their gold futures contracts, for example the gold futures contract (FGLD) of the Malaysia Derivatives Exchange.


Therefore, this reference price and auction, which is controlled by a handful of bullion banks under the banner of the LBMA, is based on trading synthetic gold, but is referenced widely around the world in countless gold contracts and in countless physical gold markets and retail gold outlets.


Even very large central bank physical gold transactions take this gold fixing reference price derived in London and then use it as a price with which to execute their own independent bi-lateral transactions. For example, when the Swiss National Bank used the Bank for International Settlements (BIS) gold trading desk as its agent to sell hundreds of tonnes of physical gold in the early 2000s, the transaction prices used for the transfers were based on taking the London Gold Fixing price as a reference price. As another example, in 2010, the IMF’s so-called ‘on-market’ gold sales were conducted by a selling agent who also based the sales transfer prices on the London Gold Fixing price. This is the same London Gold Fixing that is currently under investigation in an ongoing New York court class action suit.


Of concern here is that a benchmark that was controlled by a cartel of London-based bullion banks, that was opaque in its operation, and that is currently the subject of a gold price manipulation class action suit, was being used to value very large physical gold transactions. The question must be asked, was this benchmark fit for purpose and to what extent was it representative of the underlying worldwide physical gold market?


Question: So what about outside London and US / NY trading hours. Do other markets contribute more during these other times, for example TOCOM in Japan and MCX in India?

In general, higher trading volumes mean more liquidity to drive price discovery. But since financial markets are integrated, price information rapidly flows between markets due to simultaneously and overlapping trading. Futures markets such as TOCOM in Japan and MCX in India do contribute to gold price discovery, especially at times when the larger markets are not trading, but because these other venues are less liquid, COMEX tends to lead in the lead-lag analysis of futures prices. This finding is according to a study by financial academics from Bangkok University led by Rapeesorn Fuangkasem.


Question: How does gold lending affect the gold price?

The Gold Lending Market is centred in London at the Bank of England. It is here that central banks and commercial bullion banks interact in the execution of ultra-secretive gold lending and gold swaps transactions that increase the available supply of gold. Bullion banks euphemistically refer to this as liquidity provision but these transactions act as a supply overhang on the gold market. Few if any transactional details about the gold lending market are ever made public. If gold lending trade details were market-wide knowledge, their impact would be immediately reflected in the gold price. But they are not. Secrecy about central bank gold lending transactions therefore makes this market informationally inefficient. And when a market is informationally inefficient, the prices in that market do not necessarily reflect the non-public information in that market.


Likewise gold lending and gold swaps are not reported distinct from central bank gold holdings. In the perverse world of central bank accounting policies, gold held and gold lend/swapped is merely reported as one line item of "Gold and Gold Receivables" on central banks" balance sheets. Therefore, the real state of central bank gold holdings is obscured for any central bank engaged in gold lending or gold swaps.


Gold Lending also provides borrowed physical gold for bullion banks to engage in leveraged fractional-reserve bullion banking and trading, mostly in London where the international spot gold price is predominantly determined. Therefore, gold lending, the leveraged and fractional-reserve nature of gold trading, and the lack of reporting of real central bank gold holdings, all align to have a potentially depressing effect on the gold price as discovered in the London Gold Market.


The Essence of Central Bank Gold Lending to Bullion Banks


Question: Given that paper gold markets determine the gold price, then when or how could physical markets begin determining the gold price?"

There are two sets of gold markets –  on the one side, the COMEX gold futures and London OTC unallocated gold spot markets which are both ultra leveraged and which both create gold supply out of thin air, and on the other side, the physical gold markets which inherit the gold prices derived in these paper gold markets. Currently the physical gold markets have no effect on the international gold price.


Any shift away from the dominance of gold price discovery in the paper markets to a dominance of gold price discovery in the physical gold markets could only occur via a disconnect between physical gold prices and paper gold prices. The conditions for such a disconnect to occur would only be possible in an environment in which trading behaviour in the paper markets changed and/or the supply-demand balance in the physical gold market became acutely stressed and out of balance.


A shift in trading behaviour in the paper gold markets refers to an increased preference for converting paper gold claims (unallocated positions or gold futures positions) into physical holdings either directly by exercising conversion rights, or indirectly by selling paper gold and then using the proceeds to buy physical gold. Many of these paper claims are held by institutional and wholesale market clients. An increase at the margin in paper gold holders demanding direct conversion of their paper claims into physical gold would probably make such conversion impossible as cash-settlement of futures and unallocated positions would be introduced and made obligatory by regulators and exchange / marketplace providers.


The indirect option would be to sell paper gold and then buy physical bullion on the physical gold market from bullion dealers such as BullionStar. This move into physical gold would raise physical gold demand to such an extent that it could overwhelm available gold supply. At the same time the international gold price would fall because of selling pressure in the paper gold markets, thereby creating a disconnect between the price of paper gold and the price of physical gold, and would make the continued holding of paper gold claims ever riskier.


One trigger that could prompt a shift in sentiment from paper gold to physical gold would be a realization by a critical mass of paper gold holders that physical gold stocks are finite, while paper gold claims are at best fractionally-backed. The acceptance of this reality would be a self-fulfilling prophesy, prompting more and more paper gold claim holders to attempt to rotate into physical gold.


The contemporary physical gold markets have already witnessed sustained flows of physical gold from West to East over the last number of years driven by huge physical gold demand emanating from China, India and much of the rest of Asia. While physical gold flows are dynamic and while gold flows can and sometimes do reverse out of normal recipient destinations such as Hong Kong, Turkey, Dubai and Thailand, this is not true of China and to a large extent is not true of India either, where gold that gets imported does not come back out again. India has imported over 11,000 tonnes of gold since 2001. China has imported 7,200 tonnes of gold since 2001.


As more and more gold goes into destinations such as China and India in quantities which exceed annual gold mine supply, there is less gold available in above ground stockpiles to meet supply deficits. This is akin to a slow bank run on gold. There is also very little gold stored in the London gold market that is not already accounted for by central bank gold holdings or ETF gold holdings. Coupled with this, if in the future the paper gold holders shift to a preference for converting their paper claims into physical gold, this could also be a catalyst for tipping the physical gold market even further into a situation of excess demand and acute supply stress.


In a scenario of a destructing paper gold market, ownership of physical allocated and segregated gold is paramount. This means physical gold that is unencumbered, free from competing claims and titles, and that cannot be lent out or swapped. The paper gold market is already a gigantic bubble which has expanded to an unsustainable size and whose huge fractionally-backed claims are supported by very small physical gold foundations. The unsustainable nature of such a bubble dictates that it"s a matter of when and not if the paper gold bubble bursts. In such a scenario, physical gold ownership is the only thing that can protect against a systemic collapse of the financial system and protect against the destruction of the fractionally-reserved gold banking system.


Footnote:


BullionStar"s ideological belief promotes freedom of speech and liberty. Likewise, we believe that open debate produces improved analysis and research. Indeed, the BullionStar blog platform encourages varied opinions and well-researched ideas. Debate is particularly important when applied to the gold market, a market which is often opaque and deliberately shrouded in secrecy by its influential bullion bank and central bank participants.


BullionStar’s precious metals analyst Koos Jansen has a different view and believes that while paper markets might have some short-term impact on price, the physical gold market is more dominant in gold price formation over the long-term. Due to having taken some time off recently for health reasons, Koos did not contribute to the following article. But he recently summarized his view as follows:


"Due to my research in recent years my opinion has shifted from "the gold price is purely set in the paper markets" to "the physical market is more dominant in the long-term whereas the paper market has more impact in the short term". That"s where I stand now. If central banks suppress the price over years/decades they need to supply physical gold or the paper and physical price would diverge. Potentially there is a combination of paper and physical schemes at work."


Koos Jansen will, at a later point in time, present his view by answering and publishing the same or similar questions on the BullionStar website.


This article first appeared as "What sets the Gold Price – Is it the Paper Market or Physical Market?" on the BullionStar website.