The physical fundamentals are stronger than ever for gold.
Russia and China continue to be huge buyers. China bans export of its 450 tons per year of physical production.
Gold refiners are working around the clock and cannot meet demand.
Gold refiners are also having difficulty finding gold to refine as mining output, official bullion sales and scrap inflows all remain weak.
Private bullion continues to migrate from bank vaults at UBS and Credit Suisse into nonbank vaults at Brinks and Loomis, thus reducing the floating supply available for bank unallocated gold sales.
In other words, the physical supply situation has been tight as a drum.
The problem, of course, is unlimited selling in “paper” gold markets such as the Comex gold futures and similar instruments.
One of the flash crashes this year was precipitated by the instantaneous sale of gold futures contracts equal in underlying amount to 60 tons of physical gold. The largest bullion banks in the world could not source 60 tons of physical gold if they had months to do it.
There’s just not that much gold available. But in the paper gold market, there’s no limit on size, so anything goes.
There’s no sense complaining about this situation. It is what it is, and it won’t be broken up anytime soon. The main source of comfort is knowing that fundamentals always win in the long run even if there are temporary reversals. What you need to do is be patient, stay the course and buy strategically when the drawdowns emerge.
Where do we go from here?
There are many compelling reasons why gold should outperform over the coming months.
Deteriorating relations between the U.S. and Russia will only accelerate Russia’s efforts to diversify its reserves away from dollar assets (which can be frozen by the U.S. on a moment’s notice) to gold assets, which are immune to asset freezes and seizures.
The countdown to war with North Korea is underway, as I’ve explained repeatedly in these pages. A U.S. attack on the North Korean nuclear and missile weapons programs is likely by mid-2018.
Finally, we have to deal with our friends at the Fed. Good jobs numbers have given life to the view that the Fed will raise interest rates next month. The standard answer is that rate hikes make the dollar stronger and are a head wind for the dollar price of gold.
But I remain skeptical about a December hike. As I explained above, the market is looking in the wrong places for clues to Fed policy. Jobs reports are irrelevant; that was “mission accomplished” for the Fed years ago.
The key data are disinflation numbers. That’s what has the Fed concerned, and that’s why the Fed might pause again in December as it did last September.
We’ll have a better idea when PCE core inflation comes out Nov. 30.
Of course, the Fed’s main inflation metric has been moving in the wrong direction since January. The readings on the core PCE deflator year over year (the Fed’s preferred metric) were:
January 1.9%
February 1.9%
March 1.6%
April 1.6%
May 1.5%
June 1.5%
July 2017: 1.4%
August 2017: 1.3%
September 2017: 1.3%
Again, the October data will not be available until Nov. 30.
The Fed’s target rate for this metric is 2%. It will take a sustained increase over several months for the Fed to conclude that inflation is back on track to meet the Fed’s goal.
There’s obviously no chance of this happening before the Fed’s December meeting.
A weak dollar is the Fed’s only chance for more inflation. The way to get a weak dollar is to delay rate hikes indefinitely, and that’s what I believe the Fed will do.
And a weak dollar means a higher dollar price for gold.
Current levels look like the last stop before $1,300 per ounce. After that, a price surge is likely as buyers jump on the bandwagon, and then it’s up, up and away.
Why do I say that?
There’s an old saying that “a picture is worth a thousand words.” This chart is a good example of why that’s true:
Gold analyst Eddie Van Der Walt produced this 10-year chart for the dollar price of gold showing that gold prices have been converging into a narrow tunnel between two price trends - one trending higher and one lower - for the past six years.
This pattern has been especially pronounced since 2015. You can see gold has traded up and down in a range between $1,050 and $1,380 per ounce. The upper trend line and the lower trend line converge into a funnel.
Since gold will not remain in that funnel much longer (because it converges to a fixed price) gold will likely “break out” to the upside or downside, typically with a huge move that disrupts the pattern.
At the extreme, this could imply a gold price on its way to $1,800 or $800 per ounce. Which will it be?
The evidence overwhelmingly supports the thesis that gold will break out to the upside. Central banks are determined to get more inflation and will flip to easing policies if that’s what it takes.
Geopolitical risks are piling up from North Korea, to Saudi Arabia, to the South China Sea and beyond.
The failure of the Trump agenda has put the stock market on edge and a substantial market correction may be in the cards. Acute shortages of physical gold have also set the stage for a delivery failure or a short squeeze.
Any one of these developments is enough to send gold soaring in response to a panic or as part of a flight to quality. The only force that could take gold lower is deflation, and that is the one thing central banks will never allow. The above chart is one of the most powerful bullish indicators I’ve ever seen.
Get ready for an explosion to the ups ide in the dollar price of gold. Make sure you have your physical gold and gold mining shares before the breakout begins.
If you are a precious metals investor then you may be wondering why the price of gold and silver has been slammed in recent weeks... amid ever-increasing nuclear armageddon rhetoric, storms, quakes, floods, and a central bank (that is notoriously bad at forecasting) about to attempt to do something with its balance sheet thathas never been achieved...
The answer is surprisingly simple... China"s Golden Week Holiday.
As SHTFplan.com"s Mac Slavo wrote a year ago, and appears to be proved correct once again... Ask the expert pundits on financial media and you’ll get a swath of explanations for how the strength of the dollar or the improving health of the global economy are to blame.
One could reasonably argue that dollar strength this week could certainly put downward pressure on the gold price. So, too, could one make the point that mainstream perspective is such that the economy is improving, which means investors aren’t in panic mode and have no reason to hold a safe haven asset. But neither of these arguments could realistically lead to the smack down we witnessed this week.
There’s no reason… there’s not even a propaganda meme of why [gold has been smashed]… there isn’t even a such thing as negative news for precious metals anymore…
The fact is, [like the last few years, when prices collapsed], China is closed for the week.
One glance at the last few years gold price action suggests he may well be correct...
After this Friday"s close, China will be on vacation for its Golden Week National Holiday and this weakness appears to be traders front-running the traditional chaos that the rest of the world plays when China leaves the playing field.
China will be back in business on October 9th, and that means the Shanghai Gold Exchange, which opened in 2015 to counter Western manipulation of precious metals, will likely help re-balance prices to where they were before this recent takedown.
We could be wrong, but something tells us gold and silver prices won’t stay this low for much longer and that they could well see a complete turnaround when China reopens on October 9th.
Something needs to be said. We are against the existence of irredeemable paper currency, central banking and central planning, cronyism, socialized losses and privatized gains, counterfeit credit, wealth transfers and bailouts, and welfare both corporate and personal.
When we write to debunk the conspiracy theories that say manipulation is keeping gold from hitting $5,000 (one speaker here at FreedomFest claimed gold will go to $65,000), we are not trying to defend the Fed. When we discuss the flaws in predicting that kind of price, and the error in expecting to profit from it, we are not expressing a pro irredeemable dollar view.
We are saying there are good arguments against the regime of irredeemable paper currency—but this is not one of them. Irredeemable currency has two fatal flaws. One is the interest rate is unhinged. It can skyrocket as it did from the end of WWII through 1980, or collapse as it has been doing since then. Two is there is no extinguisher of debt. Debt grows—must necessarily grow—exponentially. As it has been doing for many decades.
The antidote to this poisonous system is the gold standard. However, it must be said that no gold price will cause the metal to circulate in the economy. It did not circulate when it was “cheap” 20 years ago. It did not circulate when it was “expensive” 6 years ago. It does not circulate now. It will not circulate even if it hits any of the gold bug price targets (if anything, a rapid price rise will be a powerful force keeping it out of circulation, as most people would have large taxable capital gains).
The one thing that can make gold circulate is interest.
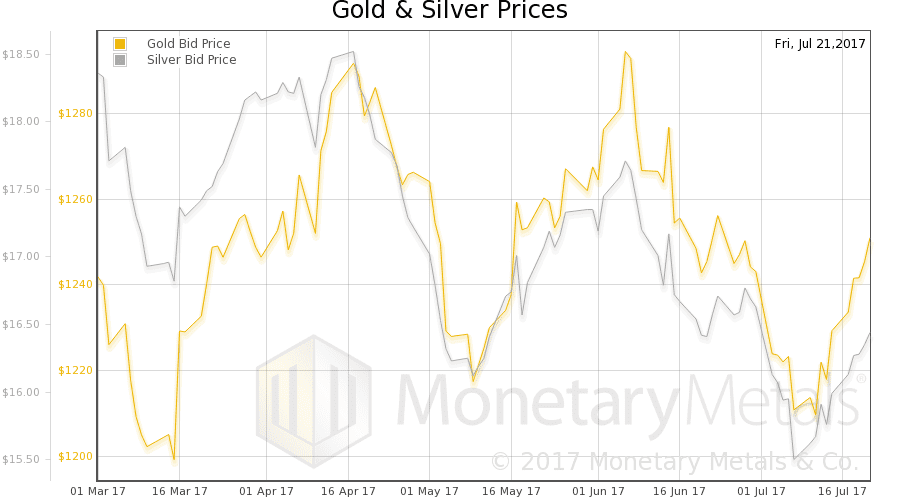
For two weeks, we have been talking about a potential capitulation. The gold price has risen about $40 since then, and that of silver 85 cents.
Will the bounce continue? Have the fundamentals firmed up?
We will show graphs of the true measure of the fundamentals. But first charts of their prices and the gold-silver ratio.
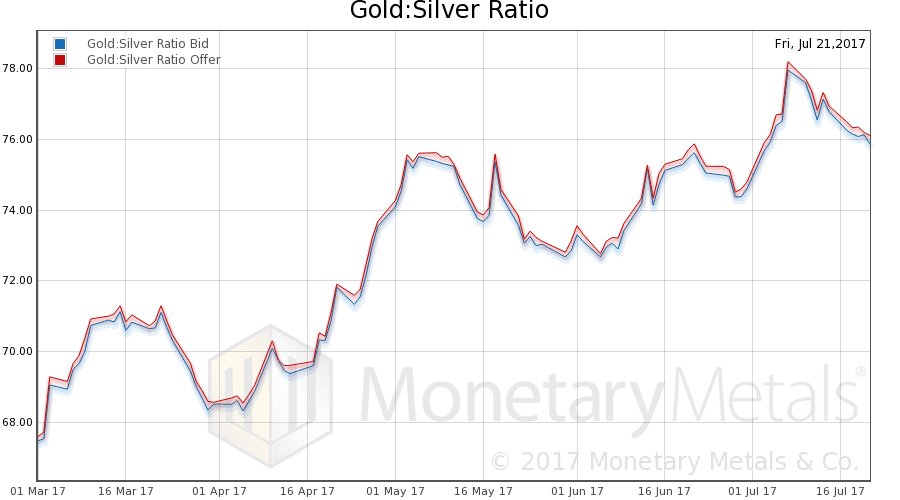
Next, this is a graph of the gold price measured in silver, otherwise known as the gold to silver ratio. The ratio moved down this week.
In this graph, we show both bid and offer prices for the gold-silver ratio. If you were to sell gold on the bid and buy silver at the ask, that is the lower bid price. Conversely, if you sold silver on the bid and bought gold at the offer, that is the higher offer price.
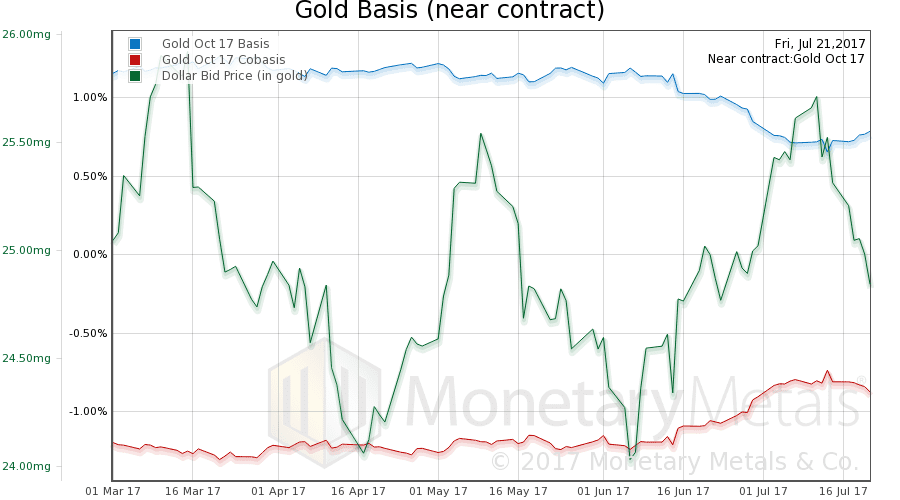
For each metal, we will look at a graph of the basis and cobasis overlaid with the price of the dollar in terms of the respective metal. It will make it easier to provide brief commentary. The dollar will be represented in green, the basis in blue and cobasis in red.
Here is the gold graph.
We have switched to the October contract, as the August is nearing expiry and under selling pressure.
The dollar fell this week (the mirror image of the rising price of gold). As the dollar fell, the cobasis fell—gold became less scarce.
Our calculated gold fundamental price fell a few bucks (chart here).
Now let’s look at silver.
As the dollar has dropped, the cobasis has come down (though still backwardated). Our calculated silver fundamental fell 25 cents to $17.59.
If you can believe the screaming headline, one of the gurus behind one of the gold newsletters is going all-in to gold, buying a million dollars of mining shares. If (1) gold is set to explode to the upside, and (2) mining shares are geared to the gold price, then he stands to get seriously rich(er).
We are not mining experts, but we will address (2) by saying that mining shares only go up if the input costs don’t go up as much as the price of gold. And if the company keeps efficiency up, and costs down. And if local tax authorities don’t get greedy. And if mine labor unions don’t get violent, environmental regulators don’t make expensive demands, etc. And if the company finds new ore bodies at the same rate it depletes them.
Here is a graph showing the price of the VanEck Vectors Gold Miners ETF (GDX) against the price of gold. We have plotted both price as a percentage of the start price to put them both on the same scale.
GDX vs Gold
You can see the problem. The price of gold from late May 2006 through present. In five years, the price of gold rose to 288% of its starting level. GDX was more than 100% behind, at only 170%. Note that the GDX is more than 40% down from its level in 2006. For comparison, the price of gold is just under double over the same period.
If this is gearing, then it looks like the gear box was bolted on backwards.
To bet big on gold mining shares now, your bet includes another conditional: (3) if the gearing has since been fixed…
Anyways, this is not really our wheelhouse. We focus our commentary on (1). Did something change in the market, that will drive the price much higher? Before that can happen, we would have to see something happen to put a bumper under that falling silver elevator.
Below is the only true look at the supply and demand fundamental of the metals, but first, the price and ratio charts.
The Prices of Gold and Silver
Next, this is a graph of the gold price measured in silver, otherwise known as the gold to silver ratio. It began the week moving up, but then reversed and ended lower.
Last week, we said:
“If it breaks above 76, then the next resistance looks to be 80.”
It did not break 76. It closed Monday at 75.7, but ended the week below 75.
The Ratio of the Gold Price to the Silver Price
For each metal, we will look at a graph of the basis and cobasis overlaid with the price of the dollar in terms of the respective metal. It will make it easier to provide brief commentary. The dollar will be represented in green, the basis in blue and cobasis in red.
Here is the gold graph.
The Gold Basis and Cobasis and the Dollar Price
Note that the June contract has just a touch of backwardation, with the cobasis now at + 0.01%. Back in early 2013, we dubbed this new normal behavior, when each contract would go into backwardation before it expired, temporary backwardation. That is all this is, and not a very impressive specimen either.
Yes, it is true that the scarcity of gold has been rising for about a month (look at the red line, the cobasis). However, that corresponds to the rise in the price of the dollar (which is the inverse of what most people measure, the price of gold in dollars). On April 12, the dollar was 24.18 milligrams gold, corresponding to a price of gold at $1286. The cobasis—our measure of scarcity—was at -0.81%. Since then, it has been a run up on the price of the dollar (which most people perceive as a run down in the price of gold), to 25.52mg gold (which people generally think of as a price of gold of $1,219).
When we see such a clear correlation between the price of the dollar and the cobasis, we know that the move is just speculators repositioning (in this case, obviously selling). The more the price of gold is down, the more speculators liquidate their futures, the scarcer the metal becomes.
Our calculated fundamental closed the week up $3, to $1,254. While this may be welcome news for gold speculators after a few weeks when it fell, it’s hardly the stuff of making million-dollar bets.
Far be it from us to get in the way, when there’s serious money to be made. It’s a (more or less) free market. Where there’s an opportunity, people will take it. We refer, of course, to the newsletter hawkers and their explosive upside call. We assume this is a lucrative business.
However, unlike the opportunity to sell newsletters to gold speculators who don’t know what most newsletters have been promising over the last 6 years, the opportunity to bet on a gold price increase looks rather less likely, at the moment.
Now let’s look at silver.
The Silver Basis and Cobasis and the Dollar Price
Silver does not yet show any backwardation, though it’s close at -0.03%.
However, the sharp and sustained rise of the cobasis is notable—along with the sharp and sustained rise in the dollar. Measured in silver, the dollar has risen from 1.68 grams of silver to 1.92 grams earlier this week. That’s a big run up (i.e. run down in the price of silver as popularly perceived).
We have been talking about an ongoing flush in the silver speculators. The price fell through Wednesday, then rallied sharply on Thursday and Friday. Perhaps that elevator has found a rubber bumper?
Significantly, our calculated fundamental price rose a buck this week. From around $15 last week, it’s now $16.
We will end on an amusing note. Last week, we said:
"We saw a technical analysis trader write a note this weekend. He said he plans to short silver on Monday. When the technicals and then fundamentals align, that can make for an interesting week."
Assuming he shorted it early on Monday morning, he might have top-ticked it at $16.40. On Tuesday, he could have closed at $16.05, for a gain of 2.1%. There has to be an easier way to earn a few bucks (and we never recommend naked-shorting gold or silver).
The dollar moved strongly, now over 25mg gold and 1.9g silver. This was a holiday-shortened week, due to the Early May bank holiday in the UK.
The big news as we write this, Macron beat Le Pen in the French election. We suppose this means markets can continue to do what they wanted to do before the threat of Frexit, shutting off trade between France and the rest of Europe, and who knows what else Le Pen was plotting to do to the French people.
This will be a short Report this week, as Keith has been working hard on a paper to address the question of which metal will have the higher interest rate. Look for that tomorrow.
Below as the only true look at the supply and demand fundamental of the metals, but first, the price and ratio charts.
The Prices of Gold and Silver
Next, this is a graph of the gold price measured in silver, otherwise known as the gold to silver ratio. It had another major move up this week, after a major move up last week and one the week before.
It now sits at the same level it was a year ago. If it breaks above 76, then the next resistance looks to be 80.
The Ratio of the Gold Price to the Silver Price
For each metal, we will look at a graph of the basis and cobasis overlaid with the price of the dollar in terms of the respective metal. It will make it easier to provide brief commentary. The dollar will be represented in green, the basis in blue and cobasis in red.
Here is the gold graph.
The Gold Basis and Cobasis and the Dollar Price
If we didn’t know better, we would say that as fast as the cobasis (i.e. scarcity, the red line) ran up, the price of the dollar (which is the inverse of the conventional view of the price of gold) ran up faster.
Actually, that is accurate. And consequently, our calculated fundamental price of gold fell over twenty bucks (though it’s still more than twenty bucks over the market price).
Now let’s look at silver.
The Silver Basis and Cobasis and the Dollar Price
In silver, the same phenomenon occurred though with exaggerated degree.
Last week and the week before, we asked:
Some speculators definitely got flushed. However, the question is how many and how much?
Then we said:
Clearly it happened to more of them this week. And, unless the fundamentals get stronger, it is likely to flush even more leveraged futures positions. Our calculated fundamental price fell three cents this week, now a buck thirty under the market.
It happened to more of them this week. That’s what a rising cobasis with falling price of silver means. A selloff of futures. A flush of the leveraged speculators.
Unfortunately for them, owners of metal were also selling. Our calculated fundamental price of silver fell almost penny for penny with the market price. It remains about a buck twenty under the market.
We saw a technical analysis trader write a note this weekend. He said he plans to short silver on Monday. When the technicals and then fundamentals align, that can make for an interesting week.
It"s unclear what the catalysts for this sudden vertical buying panic is, but minutes after Europe closed, the dollar suddenly went full bid, gold slipped, and Treasury yields rose...
There was a new French poll (which showed very little difference from previous polls) and comments from Lagarde on how bad a Le Pen victory would be, comments from Trudeau on the weakness of the Canadian economy, and some comments from Stev Schwarzmann on delays to Trump"s government reforms. None of which seem to warrant the panic bid for the greenback...
This is broad-based dollar strength as all the majors are weakening.
This was a holiday-shorted week, due to Good Friday, and we are posting this Monday evening due to today being a holiday in much of the world.
Gold and silver went up the dollar went down, +$33 and +$0.53 -64mg gold and -.05g silver. The prices of the metals in dollar terms are readily available, and the price of the dollar in terms of honest money can be easily calculated. The point of this Report is to look into the market to understand the fundamentals of supply and demand. This can’t necessarily tell you what the price will do tomorrow. However, it tells you where the price should be, if physical metal were to clear based on supply and demand.
Of course, two factors make this very interesting. One is that the speculators use leverage, and they can move the price around. At least for a while. The other is that the fundamentals change. There is no guarantee that the prices of the metals will reach the fundamental price of a given day. Think of the fundamentals as gravity, not the strongest force in the system but inexorable, tugging every day.
This week, the fundamentals of both metals moved, though not together. We will take a look at that below, but first, the price and ratio charts.
The Prices of Gold and Silver
Next, this is a graph of the gold price measured in silver, otherwise known as the gold to silver ratio. It didn’t move much this week.
The Ratio of the Gold Price to the Silver Price
For each metal, we will look at a graph of the basis and cobasis overlaid with the price of the dollar in terms of the respective metal. It will make it easier to provide brief commentary. The dollar will be represented in green, the basis in blue and cobasis in red.
Here is the gold graph.
The Gold Basis and Cobasis and the Dollar Price
The scarcity (i.e. the cobasis, the red line) is in a gentle rising trend for about six months. This week, the cobasis was down slightly. Not a surprise given the (relatively) big price move of +$33. Nor does it appear to break the trend.
Our calculated fundamental price of gold is at $1,301, just above the market price.
Now let’s look at silver.
The Silver Basis and Cobasis and the Dollar Price
In silver, it’s much harder to say that there is an uptrend in the cobasis. Our indicator of scarcity is at the same level it was in October. Back then, the price of silver was $17.60 and on Thursday it was just about 90 cents higher.
The fundamental price back then was just under $15. Now it’s just under $16.50. This happens to be down about 40 cents this week.
With the fundamental of gold rising, and that of silver falling, it’s not surprising that the fundamental gold-silver ratio is up to a bit over 79.
Last week, we discussed the growing stress in the credit markets. We noted this is a reason to buy gold, and likely the reason why gold buying has ticked up since just before Christmas.
Many people live in countries where another paper scrip is declared to be money—to picture the absurdity, just imagine a king declaring that the tide must roll back and not get his feet wet when his throne is placed on the beach—not real money like the US dollar. It should be obvious, but we have seen much disinformation out there promoting the idea that the dollar is collapsing. Most of the time, most of these people buy dollars as the escape hatch from their native currencies.
They buy the dollar first, and gold (for now) is a distant second.
That leads to the question of silver. Do they buy silver in equal measure as gold, or is silver a distant second to gold, as gold is a distant second to the dollar?
Theory tells us that gold is more portable. It is much, much more portable. First, the same weight of gold is about half the volume of silver. A 1oz gold Maple Leaf coin (which is pure gold) is much smaller than a 1oz silver Maple. And right now, the value of an ounce of gold is just about 70 times greater than the value of an ounce of silver. The math works out that the same value of silver is 126X more bulky than gold.
If you are paying for storage, that may be important. It sure is, if you are thinking you may need to carry it on your person. A gold bar worth $120,000 would fit in your trouser pocket (a bit heavy at 3kg, but you could do it). That much silver would be almost 7 of those big bars which are the size of small loaves of bread. Each. All that silver would weigh about as much as two heavyweight boxers.
Gold is also more liquid.
What does the data tell us about demand for silver relative to gold right now?
We will look at that below in the only true picture of supply and demand in the gold and silver markets. But first, the price and ratio charts.
The Prices of Gold and Silver
Next, this is a graph of the gold price measured in silver, otherwise known as the gold to silver ratio. It moved down this week. Is it approaching a line of support?
The Ratio of the Gold Price to the Silver Price
For each metal, we will look at a graph of the basis and cobasis overlaid with the price of the dollar in terms of the respective metal. It will make it easier to provide brief commentary. The dollar will be represented in green, the basis in blue and cobasis in red.
Here is the gold graph.
The Gold Basis and Cobasis and the Dollar Price
The price of the dollar fell a bit more (this is the inverse of the rising price of gold, measured in dollars, +$14). But look at that move in the cobasis (i.e. the red line, our measure of scarcity). What does it mean when the price of gold rises, but the metal becomes more scarce?
We have been saying for a few weeks that fundamental buying—when people take real metal home, presumably not to bring it back to the market for the foreseeable future—is “sputtering”. Last week, gold buying this week was biased towards speculation on futures. This week, the bias is back to physical metal.
Our calculated fundamental price of gold is up over $30. It’s just a hair under $200 over the market price. Gold is being offered at a quite a discount.
Now let’s look at silver.
The Silver Basis and Cobasis and the Dollar Price
Uh oh. We can see immediately, that the cobasis has fallen in silver about 2/3 as much as it rose in gold. Granted, the price of silver rose 2.9% whereas that of gold went up only 0.5%. The speculators were much more aggressive in the silver market, as they often are.
Our calculated silver fundamental price is up about 40 cents, whereas the market price was up 51 cents. The silver fundamental price is now about $0.80 over the market.
Getting back to our question at the top, we can see in the data that people buy first gold when they fear credit stress and default. Speculators can temporarily move the price quite a lot, as they attempt to front-run the market. So, naturally, they are focusing on the silver market as the general rule when gold goes up, silver goes up more. That may be true when central banks’ stimulus efforts are successful in causing an increase in production of goods, including goods that contain silver.
Less so, when metal buyers are not buying to consume but to opt out of the banking system.
There are people who buy silver metal in preference to gold, for example those who cannot afford to buy gold. But at this stage, the balance favors gold.
We calculate a fundamental gold-silver ratio of about 75.8.
I serve on the Board of Directors of a large Singapore-based company that’s in the gold and silver business.
And, last night during our quarterly conference call, the management team gave me a lot of intriguing information.
Sales of physical gold and silver are collapsing across the entire industry.
At the US Mint, for example, sales of US Eagle gold coins fell by 67% between February 2016 versus February 2017.
And sales of US Eagle silver coins are down 75% over the same period.
The World Gold Council’s data also shows a substantial decline in physical precious metal demand in 2016, particularly with bars, coins, and jewelry.
Suppliers and refiners in the precious metals business are echoing these numbers, lamenting that sales are extremely slow and margins are falling.
For our Singapore company, this decline is irrelevant.
They have their own proprietary, state-of-the-art storage facility and a number of cutting-edge service like bullion-backed peer-to-peer loans, so business is great.
But I would expect that a number of other bullion dealers will probably go bust if this downturn lasts much longer.
The one conundrum is that this trend does NOT correlate with the price of gold.
In US dollar terms, the gold price is up 16% since the beginning of 2016.
So it would be reasonable to conclude that sales of physical bars and coins are up as well.
But they’re not.
The reason is because there’s a HUGE difference between physical gold and “paper” gold.
When people talk about the gold price, they’re really quoting the price of gold contracts at exchanges around the world in London, Shanghai, Chicago, etc.
Traders aren’t actually buying and selling physical gold.
These gold contracts are merely paper financial instruments, like stocks and bonds, that traders use for speculation.
When some conflict breaks out in Africa, the knee-jerk reaction is for traders to buy gold contracts.
And when central bankers announce that the economy is totally awesome, traders dutifully dump their gold contracts.
But they’re really just buying and selling highly leveraged paper assets. Nothing physical changes hands.
It’s the same with gold ETFs; these are merely financial instruments to gamble on the paper price of gold.
Investors who truly understand the benefits of owning gold, and don’t simply want to speculate on the price, buy physical bars and coins from a dealer.
And quite often there’s a massive difference in fundamentals between the demand for physical coins and the paper price.
During the 2008 financial meltdown, the paper price of gold and silver plunged.
Speculators and traders were hit by margin calls and forced to sell their contracts.
But demand for physical coins was incredibly strong; savvy investors were looking for a safe haven.
There was a total disconnect between the paper price and physical demand.
That’s now happening again, but in reverse. The paper price is rising, but physical demand is falling.
Management told me last night that they’ve been invited to speak at several investment conferences attended by family offices and high net worth individuals.
But they told me that there’s very little interest in owning physical precious metals among these wealthy investors.
Everyone seems to want to dump all of their money in US stocks or real estate, expecting that they’ll easily make 20% despite both markets being at all-time highs.
This strikes me as total madness. Few people ever prospered buying what was popular and expensive.
There seems to be no fear in the market… no regard for sense or safety.
And my contrarian instincts tell me that this complacency is a great reason to own physical gold and silver right now.
Remember that gold is primarily a form of savings.
You could hold your savings in a bank account, denominated in paper currency like dollars or euros or renminbi.
Or you could hold savings in physical cash. You could even own government bonds.
Each of these is a form of savings.
But so is gold and silver. (And cryptocurrency, for that matter.)
The difference is that gold and silver cannot be conjured out of thin air by a central bank.
And unlike cash, or money in a bank, precious metals actually keep pace with inflation over time.
I remember having a conversation once with a famous investor who told me that he didn’t know what was going to happen in the future…
… and THAT’S why he owned gold– for the “I don’t knows.”
Will there be a trade war with China in the next few years? A shooting war? A major debt crisis? Another terrorist attack? “I don’t know.”
Gold and silver are fantastic insurance policies against the “I don’t knows” due to the metals’ 5,000 year history of value and marketability.
There’s no need to go overboard and keep 100% of your net worth in precious metals.
But given the obvious risks on the horizon that we discuss regularly, and these bizarre demand trends, it’s a great time to consider adding to your physical precious metals savings.
The question on the lips of everyone who plans to exchange his metal for dollars—widely thought to be money—is why did silver go down? The price of silver in dollar terms dropped from about 18 bucks to about 17, or about 5 percent.
The facile answer is manipulation. With no need of evidence—indeed with no evidence—one can assert this and not be questioned in the gold and silver communities. We have recently come across a term normally used to describe Leftists and Social Justice Warriors, virtue signaling. One piously declares that one supports the cause, one speaks truth to power, one sticks it to The Man, well you get the idea. The concept of virtue signaling seems equally appropriate to those who sing the chorus on every price drop, “manipulation.”
Besides, we have peeps in high places in London and New York and Beijing, and they tell us silver is manipulated…
Actually, we rather prefer to look at data than listen to whispers. What would the data show if demand for physical silver metal was robust and rising while someone sold so many futures contracts that the price of the metal was forced down just about a dollar?
The basis and cobasis are spreads between physical silver metal and futures. The scenario we just described would collapse the basis and skyrocket the cobasis.
Is that what happened this week?
Before we get that, we want to note that crude oil fell from $53.33 last week to $48.49, or -9%. Copper fell from $2.70 to $2.60, or -3.7%. Wheat fell from $4.53 to $4.40, or -2.9%. People miscall this deflation.
We don’t know whether this will affect the Fed’s seeming commitment to damn the economy, full rate hikes ahead. However, we do know that sentiment bleeds from one speculative asset to another (and in a near-zero interest rate environment, all assets are used by speculators). “If energy, industrial metal, and food are going down, then surely silver should go down too,” seems to be the logic.
At least this week.
We are much more interested in the supply and demand fundamentals. We acknowledge that speculators can temporarily move prices—sometimes a lot—but we firmly insist that eventually the market price reverts to the level called for by supply and demand.
So what happened to those fundamentals? Below, we will show the only true picture of the gold and silver supply and demand. But first, the price and ratio charts.
The Prices of Gold and Silver
Next, this is a graph of the gold price measured in silver, otherwise known as the gold to silver ratio. It moved up sharply this week. If we were chartists, we might note that the ratio seems to be making a series of higher lows since mid-July.
The Ratio of the Gold Price to the Silver Price
For each metal, we will look at a graph of the basis and cobasis overlaid with the price of the dollar in terms of the respective metal. It will make it easier to provide brief commentary. The dollar will be represented in green, the basis in blue and cobasis in red.
Here is the gold graph.
The Gold Basis and Cobasis and the Dollar Price
As the price of the dollar rose through the week, so did the cobasis. The price of the dollar is the inverse of the price of gold in dollar terms, and allows us to see a clearer picture. It is not gold going anywhere, but the dollar going up and down. The cobasis is our indicator of scarcity.
While the dollar went up 0.5mg gold, the cobasis went up 24bps. This is the old pattern, rising gold scarcity as the dollar rises. The same happened in farther contracts, to a smaller degree.
While the market price of gold fell $24, our calculated fundamental price went down only $15. It’s more than $150 over the market price.
Now let’s look at silver.
The Silver Basis and Cobasis and the Dollar Price
The cobasis in silver actually fell. It didn’t fall a lot, but this drop came in a week when the price fell substantially. This puts the lie to the allegation of manipulation. Selling of futures would push the cobasis up.
Silver fell because owners of metal decided to sell and/or buyers of physical metal slowed their purchases. We can debate why they did that, but not the meaning of the data.
Note also the much lower absolute level of the silver cobasis. Silver is -86bps compared to gold at +8bps (a slight temporary backwardation).
The silver fundamental price also fell, about half as much as the market price. It is now $1.03 over market.
This means that, while those who need to unload their silver are unhappy, those planning to load up can now exchange the same quantity of Federal Reserve Notes for more silver than last week. With (slightly) better fundamentals too, as last week the fundamental was only $0.87 over market.
The only question on that front is the trend. For two weeks, the fundamental has become weaker.
US Mint Releases New Fort Knox “Audit Documentation”: First Critical Observations
In response to a FOIA request the US Mint has finally released reports drafted from 1993 through 2008 related to the physical audits of the US official gold reserves. However, the documents released are incomplete and reveal the audit procedures have not been executed proficiently. Moreover, because the Mint could not honor its promises in full the costs ($3,144.96 US dollars) of the FOIA request have been refunded.
Thanks to my readers that donated to the crowdfunding campaign I’ve been able to force the US Mint through a Freedom Of Information Act (FOIA) request to hand over documents related to the physical audits of the US official gold reserves stored at the Mint; also referred to as Deep Storage gold. Although the PDF-package digitally sent to me is redacted, incomplete, includes pages copied twice and materials I didn’t ask for, it’s the closest thing that I’ve ever seen to physical audit documentation of gold at Fort Knox and the other Mint depositories drafted in between 1993 and 2008.
What is worrying is that the reports now in my possession reveal the audit procedures have not competently been executed. Combine that with the fact the documents are incomplete and redacted, and the result is suspicion of fraud. In this blog post we’ll have a first critical look at the reports and the problems to be found within.
For starters, allow me to expand on what I think happened at the Mint’s headquarter on the 8th floor at 801 9th Street NW Washington DC, before these documents were sent to me.
It should be clear that the US Treasury (owner of the gold), US Mint (main custodian), Federal Reserve Bank Of New York (second custodian), and the Office Inspector General of the US Treasury (head auditor), are reluctant to disclose information about the audits of the gold at the four largest depositories that store over 8,000 fine metric tonnes. Consider that the most seasoned gold analysts aren’t even aware this gold is audited.
What nobody knows is that according the US government 100 per cent of the Deep Storage gold has been audited in between 1974 and 2008 (page 4). This period can be divided in two chapters: the first runs from 1974 until 1986 when the Committee for Continuing Audit of the U.S. Government-owned Goldverified the majority of the Deep Storage metal. The second chapter covers 1993 until 2008 when the residual was examined under the supervision of the Office Inspector General of the US Treasury. In my previous posts on this subject we focused on the first chapter, what is written below skims the surface of the second. As promised, eventually I will publish a full in-depth analysis of all chapters (there are additional chapters in the fifties, from 1986-1993, in 2009, 2010 and 2011).
Over the years my inquiries at the US government though regular channels have produced little intelligence about the physical audits of the Deep Storage gold. Some departments cooperated at first, but eventually they stopped replying emails or just hang up the phone while I was talking. The second layer of defense was raised when I started submitting FOIAs. Instead of honoring my requests they tried to delay and dodge most appeals. Clearly, the US government prefers not to answer my questions than to flaunt with the audit results.
However, in 2016 I embraced the motivation to push through and find out how many gold bars were counted, weighed and assayed in between 1993 and 2008, when allegedly the last series of physical audits was conducted. Not surprisingly, zero US government departments could provide me the information I was looking for, but through certain FOIAs I obtained leads to submit new FOIAs, and so on 12 Augustus 2016 I demanded, inter alia, the “memoranda submitted by the US Mint Director’s representative regarding audits of the Mint Schedule of Custodial Gold and Silver Reserves to the Chief Financial Officer drafted from 1993 through 2008”. The Mint replied this request would costs me $3,144.96 dollars because it would take 40 hours to search the respective documents, 8 hours for review, and additional costs would be incurred to duplicate 1,200 pages. I thought this was hogwash – 1,200 pages seemed out of proportion for such memoranda, how hard can it be to find a few pages and how did they know it were going to be 1,200 pages if they had to search 40 hours for it – but decided to start a crowdfunding campaign to collect the money.
Within 24 hours the campaign was completed and late August 2016 I sent the Mint a check, in the hopes to receive the documents a.s.a.p.. After the Mint pretended the check was missing for a few weeks, they communicated on 28 September 2016 the funds had arrived and they were working to get the requested documents out to me (exhibit 1).
Exhibit 1. Screenshot email form the US Mint (Jones, Lateau). My FOIA request was originally dated from 1 August 2016, but was revised on 12 August 2016. Jan Nieuwenhuijs is my real name.
Months past but nothing happened. I sent several emails and called the Mint three times, but time and time again I was maintained with false excuses. Then, finally, on 23 December 2016 the Mint delivered the documents I paid for. Sort of. Instead of 1,200 pages I received 223 redacted pages that contained 68 pages of reports I didn’t ask for and 21 pages that were copied twice. Effectively, I got 134 pages related to my FOIA request.
When I confronted the Mint I paid $3,144.96 dollars for a meager 134 pages they agreed the costs had been estimated to high and a refund was reasonable. Actually, they told me they never cashed the check. So, quickly I told my bank to cancel the check and ordered my crowdfunding platform to refund all my donors.
As of now all donors to my crowdfunding campaign should have received their money back (if not, please write me an email, see below for my address). From the bottom of my heart I would like to thank everyone for the loan that made this operation possible1!
For me a slight doubt remained if the Mint had tried to fend me off by asking a disproportionate amount of money for a few pages that I assume are alphabetically archived, or that they handled my case in all honesty. A skeptical mind would think the former. To find out I read the internal emails of the Mint employees that handled my FOIA. Those are not directly publicly available, but I was told a trick by more experienced FOIA scholars that reached out to me after I published my previous blog posts on this subject, to ask the Mint for internal emails through, what else, a Freedom Of Information Act request (exhibit 2).
Exhibit 2. FOIA asking to obtain email correspondence written or received by Mint employees that was related to my case.
And it worked! On 10 January 2017 I received all (I hope) emails from the Mint I was looking for. Including one wherein Audit Liaison at the United States Mint Tom Noziglia makes an estimate for the costs of my FOIA request of 12 August 2016. Read below (exhibit 3).
Exhibit 3. Email by Noziglia to Saunders-Mitchell, Grimsby and Fletcher.
At first sight it seems Noziglia and his office stick to prudent protocols. But possibly this email is a veil, meant to deceive me if I would ever read it. Actually, yes, I think it’s a cloak and I’ll share my theory.
Exhibit 4. Screen shot LinkedIn page Tom Noziglia. Note, we can read he’s a schooled psychologist that was unemployed from 1985 until 2012 after which he started as auditor at the US Mint. I count 5 typos on this page, which suggests Noziglia is not the most meticulous auditor.
We can read from Noziglia, “as Audit Liaison at the US Mint, I [Noziglia] am responsible for the coordination of all external audit initiatives … I have extensive experience in precious metal inventory, … I … coordinate the execution of the annual OIG [Office Inspector General] Joint Seal Inspection of the Custodial Gold at the US Mint”. This page tells us Noziglia is one of the auditors of the US official gold reserves. So, the email above (exhibit 3) was written by the auditor who was involved in the procedures of which I requested the documentation. Noziglia must have known my inquiry could be simply honored by sending just a few pages of documentation, as he was a co-author of the documents in question.
Firstly, with the benefit of hindsight we know Noziglia was lying in his email because by now I have the documents that count only 134 pages, and he was the coordinator of the annual inspections of custodial gold at the Mint. He must have known there were no “1,200 pages in 80 boxes” and so his $2640.00 dollar estimate is a hoax. I think Noziglia wrote the email expecting I would NOT pay the ludicrous amount of dollars, but possibly DID submit a new FOIA to view the Mint’s internal emails. Chances are slim someone could pay $3,144.96 dollars right? But I’m not the first who submits an additional FOIA to obtain internal emails. Hundreds of people went before me, this is a well-known trick for FOIA pundits, and many public servants in the US must be aware of this hazard. Hence I reckon public servants consciously write emails to colleagues, as if these will be publicly released some day. I’ve come to understand submitting and answering FOIAs is nothing but a cat and mouse game.
Second, the Mint never cashed the check. If they really thought they would have to search 40 hours, why not cash the check immediately and get busy? I guess they knew very well there was no searching required.
Third, in case Noziglia had never seen a “memoranda submitted by the US Mint Director’s representative regarding audits of the Mint Schedule of Custodial Gold and Silver Reserves to the Chief Financial Officer”, which is not likely but let’s give him the benefit of the doubt, he could have viewed the most recent version at his office that wasn’t sent to the National Archives (NARA) yet. By doing so he would have learned very effectively these annual memoranda count only a few pages.
Fourth, Noziglia states in his email (exhibit 3) he’s not sure if he will find the documents at all. But this is impossible because he’s a dedicated Mint auditor so he must know what documents the Mint sends to NARA every year. In addition, there was no need for Noziglia to “order off site” boxes, because he simply could have commanded NARA staff to deliver specific documents – this is common practice.
Fifth, in the CC of Noziglia’s email is Kenyatta Fletcher, who is the Chief of the Accounting Division of the Mint. If, which is a big if, Noziglia didn’t know what I was looking for, Fletcher would’ve known these documents wouldn’t count 1,200 pages. But still I was charged a laughable $3,144.96 dollars.
Sixth, Noziglia’s estimate is $2.640.00 dollars, but I have no emails that clarify why $504.96 dollars were added for a total of $3,144.96 dollars I was charged. This indicates, Mint staff communicated in person or through phone calls to finalize my request, and so could have done likewise to handle it in general. Concluding, Noziglia’s email doesn’t paint the full picture of the internel communication.
Seventh, please read what Noziglia’s colleague Grimsby replied to him after 4 minutes.
Exhibit 5. Email by Grimsby to Noziglia.
“Great email”? Why would Grimsby praise Noziglia for his email? If Grimsby would have written,“I agree”, I can understand. But,“great email”? Perhaps Grimsby meant to write, “great calculation that makes no sense, but is likely deceive an ignorant FOIA requester if he would ever read it!”? It sure looks like it.
My guess is that Noziglia, Grimsby and Saunders-Mitchell met in the hallway in the afternoon of 15 August 2016 and agreed for Noziglia to write a phony email that arrives at an amount of dollars aimed to scare me off. In the email below you can read Noziglia suggested to Grimsby to discuss in person in the afternoon of 15 August 2016 the estimate for the costs.
Exhibit 5.2. Email by Noziglia to Grimsby 15 August 2016.
So far we’re confirmed, again, that the US gold is held in secrecy. No surprises there. Moving on to the content of the documents.
Audit Documents Released Are Incomplete
When one walks into a US Mint repository the main barrier will be the door to the vault room. In the case of Fort Knox this a 20-tonne door of which no one person is entrusted with the combination. Once inside the vault room the gold is stored in segregated compartments that are sealed since at least the fifties.
The official narrative is that by 2008 the load of all 42 compartments had been physically audited. Every compartment had been opened, the gold inside counted, weighed and assayed, after which the gold was stacked in an adjacent compartment in the vault room (in several documents it’s described this is the way the gold is physically audited). Subsequently the target compartment door was closed and placed under Official Joint Seal, if during the verification no discrepancies had been found with the Mint’s bullion ledger. In most years until 2008 one or two compartments were opened for a physical bar examination, while the other compartments were merely inspected for any tampering of the Official Joint Seal (OJS). The purpose of joint seals is to avoid the necessity of verifying all assets in each annual audit.
Thus the audits of the Deep Storage gold consist of two conventions gold verifications, which are the physical audits of gold bars inside the compartments. And OJS inspections, which are checks of the seals placed on the compartment doors. The superintendent in the audit procedures is the Office Inspector General of the US Treasury, in short, the OIG.
When reading the audit documents delivered to me (the Memoranda hereafter) the distinction between gold verifications and OJS inspections is clear. Let me show you an example of Fort Knox. The first screen shots below are from a gold verification at Fort Knox in March 1998.
Exhibit 7.1. Gold verification at Fort Knox March 1998, page 1.
Exhibit 7.2. Gold verification at Fort Knox March 1998, page 2.
Exhibit 7.3. Gold verification at Fort Knox March 1998, page 3.
Exhibit 8.1. OJS inspection at Fort Knox June 1998, page 1.
Exhibit 8.2. OJS inspection at Fort Knox June 1998, page 2.
Exhibit 8.3. OJS inspection at Fort Knox June 1998, page 3.
Exhibit 8.4. OJS inspection at Fort Knox June 1998, page 4.
Clickhereandhereto download all Memoranda sent to me by the US Mint.
After I had organized the documents and imported all data in spreadsheets I noted the 134 pages exclude 27 OJS inspection reports and at least 3 gold verification reports. I’ve asked the Mint to deliver the missing Memoranda, although I’m not expecting them to ever comply.
The fact 30 Memoranda are missing is of course highly problematic. Bear in mind, I offered the Mint $3,144.96 dollars to produce these documents.
Exhibit 9. Overview gold verification and OJS inspection reports Deep Storage gold. Note, throughout time the Memoranda format changed, so in some years one Memorandum included both gold verification and OJS inspection paragraphs.
In case you’re wondering how I know what gold verifications reports I’m missing, this is because references are made to these physical audits in succeeding gold verification reports. Fort OJS inspection reports, those should be done every year.
Below is an example of an Official Joint Seal. I obtained nearly all OJS copies from a separated FOIA request at the OIG.
Exhibit 10. OJS Fort Knox compartment 29.
Submitted a whole bunch of FOIA request at US government departments regarding Fort Knox today. #gold
Fort Knox Compartment 31 Was Opened In 1996 For Dubious Reasons
There are a couple of disturbing lines written in the Fort Knox OJS inspection report of 1996. Although for an OJS inspection seals should only be examined for tampering, on 12 August 1996 at the Fort Knox OJS inspection two representatives of the General Accounting Office (GAO) showed up in the vault room and decided to select “a single joint sealed compartment for opening and inspection”.
Exhibit 10. Fort Knox OJS inspection report 1996.
Unfortunately the report doesn’t say what was in the vault compartment; how many bars and fine troy ounces (FTO) it contained. Based purely on this document it would impossible to decipher what the GAO exactly did. However, by combining the info in the 1996 OJS inspection report with documentation obtained through a FOIA requests at the OIG, we do know what happened.
Have another look at exhibit 10. We can read Fort Knox compartment 29 was sealed in 1998. But the content, 19,800 gold bars weighing 6,470,624.049 FTOs before assays samples were taken, was sourced from compartment 31 that was sealed on 12 August 1996. Was compartment 31 the one opened by the GAO in 1996? Yes, without a doubt.
By examining all OJS copies – such as demonstrated in exhibit 10 – it shows there was no other vault segment freshly sealed on 12 August 1996 other than compartment 31. Moreover, the 1996 OJS inspection report mentions only one joint sealed compartment was breached. Therefore we know the GAO representatives opened Fort Knox compartment 31 comprising 19,800 gold bars weighing 6,470,624.049 FTOs on 12 August 1996.
Furthermore, in the 1995 OJS inspection report we read there was one compartment – the number is redacted – that contained 19,800 gold bars weighing 6,470,624.049 FTOs. And in 1995, 1996 and 1997 there were no gold verifications at Fort Knox as far as I know, other than the GAO incident. Have a look below at a screenshot from the 1995 Fort Knox OJS inspection report.
Exhibit 11. Fort Knox OJS report 1995.
What happened is that on 12 August 1996 compartment 31 was opened by the GAO to “check a few bars”, but then two years later in 1998 the same gold was verified by the OIG; all the gold inside taken out of compartment 31, counted, weighed and assayed, to be stored across the hall in compartment 29. This is suspicious. I quote, “the purpose of joint seals is to avoid the necessity of verifying all assets in each annual audit”.
I do not possess the official rules for US Mint OJS inspection and gold verification for the year 1996 (“MD 8H-1”), but based on the rules that prevailed in 1975, what the GAO did on 12 August 1996 was not done. Read with me.
How come the GAO could open a compartment? The OIG stated under oath in 2011, “since 1993, when we assumed responsibility for the audit, my office has continued to directly observe the inventory and test the gold” (page 4). If the OIG is responsible how come the GAO could break a seal?
Let’s contemplate this: if the “random checks” the GAO performed in 1996 in compartment 31 formed an adequate gold verification, why did the OIG re-audit the exact same gold in 1998? And what was the intention of the GAO in 1996? The GAO couldn’t fully audit compartment 31, because they were present at Fort Knox only for one day (12 August), and no single person or flock of auditors can verify 19,800 large gold bars in one day. The fact these 19,800 gold bars were re-audited in 1998 underlines what the GAO did in 1996 was inappropriate at best.
One theory is that the gold in compartment 31 was prepared in 1996 to be physically audited down the road. Remember what the Fort Knox gold verification report of 1998 stated (exhibit 7.2)? In 1998 the OIG, “selected predetermined individual bars to be drilled for assay”. Possibly, the OIG selected the exact bars in 1998 that were put in in 1996. If this is true the names and autographs of the perpetrators of this crime are on the seal of compartment 29 (exhibit 10).
My succeeding post on this subject will expose that many other Deep Storage compartments at the Mint have been opened for dubious reasons as well. Which could be the reason the Mint didn’t provide us ALL the OJS inspection reports from Denver and West Point from 1993 through 2003 (exhibit 9).
Weighing Sample Size Remarkably Low
We need to discuss the sample size of the gold verifications. In 1998 at Fort Knox 19,800 gold bars were inspected but only 105 of them were weighed and assayed (exhibit 7.2). That’s not much in my humble opinion. In any case, I expected a higher sample size.
In the 1953 audit at Fort Knox (download report here) in total 88,000 bars weighing 48,506,985 FTOs were counted for verification. About 10 % of those were weighed.
During the Continuing Audits from 1974 through 1986 it seems 2 % of the gold counted was weighed. A huge decline from 1953.
Although gold bars tested to be out of tolerance during a Fort Knox audit in 1977 at a sample size of 2 %, by 1998 the sample size had been further debased to 0.53 %. I’m not a professional auditor (if you are one please contact me), but common sense suggests that when irregularities are found the sample size should be increased, not decreased.
To make matters worse, in 1999 at West Point the sample size was 0.52 %, and again, a melt appeared to be out of tolerance.
Exhibit 14. Gold verification report West Point 1999.
Was the sample size increased after 1999? Not really. At Fort Knox in July 2000 the samples size was 0.65 % (93 bars weighed of 14,262 bars counted). But wait until I show you what numbnuts were entrusted handling the scale for the audits of the world’s greatest gold hoard.
Scale Didn’t Work, Repeatedly
Let’s study the 2004 physical audit at West Point. Please read:
Exhibit 15.1. Gold verification report West Point 2004.
Exhibit 15.2. Gold verification report West Point 2004.
When all parties tried to reconcile the weight of samples on 22 and 23 July 2004, they found out, “the scale was reading at ounces rather than fine troy ounces”, because, “a setting on the scale had not been properly changed”. Allegedly this is what caused alternative readings in the books of the Director of the Mint’s Representative and the OIG’s Representative. And presumably because nobody could figure out how to use the scale correctly they decided to postpone re-weighing the samples until 24 August 2004. This failure of how to use a scale is a colossal disaster for the credibility of the Deep Storage audit procedures.
In 2004 a mere 71 bars were weighed and assayed, but it appeared that none of the auditors present knew how to rightly use the scale. The Memoranda mentions they found out the scale wasn’t properly functioning when weighing the assay samples, but what about the weighing of the actual bars? What about the weighing of every Deep Storage gold bar under the supervision of the OIG from 1993 until 2008? We have no guarantee this has ever been executed competently.
To repeat, the official explanation for this blunder reads, “the scale was reading at ounces rather than fine troy ounces”, because, “a setting on the scale had not been properly changed”.
First, in my mind there can be no imaginable circumstances in which setting of the scale should have been changed. The scale should read troy ounces to as many decimals all day long. That’s it. Why change the settings?
Second, they say, “the scale was reading at ounces rather than fine troy ounces”, but scales don’t read fine troy ounces so this statement is fake. A scale reads troy ounces, or digital ones can be set to reading grams; it cannot smell what is the purity of the gold and thus display fine troy ounces. That’s what the assay test is for.
In 2008 at West Point a similar disaster happened. Read with me:
Exhibit 16.1. Gold verification report West Point 2008.
Exhibit 16.2. Gold verification report West Point 2008.
The auditors couldn’t clearly read the decimal point. After assay samples were drilled to be taken out, the auditors weighed the same amount of gold granules to replace the samples, in order for the Deep Storage FTOs to remain flat in 2008. But the assay lab, White Sands Missile Range, which is a division of the US Army, found out from the paper work that the weight of the assay samples didn’t match the weight of the granules. And so West Point compartment 10-H had to be re-opened on 22 September 2008 to put an exact 10.346 ounces of gold in, instead of 1.0346 ounces.
What a catastrophe! Be aware that before weighing the granules the auditors weighed 86 gold bars and the assay samples. How do we know they properly weighed the assay samples and the totals of the 86 bars? The short answer is, we don’t.
Thereby, anybody with a sense for gold can see the difference between 10 ounces and 1 ounce of yellow metal.
Conclusion
From the examples above it should be clear that the Deep Storage gold has not been audited by professionals, but the precious metals have been verified by imbeciles. Clearly the scale was repeatedly handled by amateurs, which throws a wrench at the integrity of the entire US official gold reserves auditing project. I’m not at all surprised the US Mint has tried everything to keep the records of the auditors out from the pubic domain. Fortunately most of it will be out in the open eventually. The citizenry of the world deserves to know everything there is about the Deep Storage gold.
Let’s finish with one more comment from the West Point 2006 audit report.
Exhibit 17.1. Gold verification report West Point 2006.
The auditors couldn’t figure how to use the drill to take assay samples (how about pointing the tip to a bar and press the button). They also were oblivious how to calculate fine troy ounces. We must wonder if these people would be capable of tying their own shoelaces. In any case, the fact the US government chose to assign very inexperienced people widely opens the possibility that the audits are a complete hoax.