Showing posts with label Index. Show all posts

Friday, November 24, 2017

US PMIs Tumble To 4-Month Lows, Signal Just 2% GDP Growth

After reassuringly positive Eurozone PMIs, US Manufacturing and Services disapointed with the composite PMI slumping to 5-month lows in November.


  • Flash U.S. Composite Output Index at 54.6 (55.2 in October). 4-month low.


  • Flash U.S. Services Business Activity Index at 54.7 (55.3 in October). 4-month low.

  • Flash U.S. Manufacturing PMI at 53.8 (54.6 in October). 2-month low.

  • Flash U.S. Manufacturing Output Index at 54.3 (54.6 in October). 2-month low.


Commenting on the flash PMI data, Chris Williamson, Chief Business Economist at IHS Markit said:


“US businesses reported another month of solid growth in November, putting the economy on course for a reasonable, though by no means stellar, fourth quarter.


Current PMI readings are broadly consistent with GDP growing at an annualised rate of just over 2%.


“There was also good news on hiring, with a slight uptick in employment growth meaning the surveys are indicating non-farm payroll growth of just over 200,000 in November.


“Both input costs and selling price inflation picked up, suggesting the upturn is feeding though to higher price pressures, though some of the manufacturing price hikes were attributable to the short-term effects of the hurricane-related supply chain disruptions.


“An upturn in new order inflows means we can expect a strong end to the year, though prospects for 2018 remain more mixed. Although expectations about the year ahead slipped lower in the service sector, future optimism hit a two-year high in manufacturing, suggesting the goods-producing sector may start to make a stronger contribution to the economy in coming months.”


Wednesday, November 8, 2017

Momentum Hasn"t Been This Extreme Since The Peak Of The Dot.Com Bubble

The last month or so has seen "momentum" dramatically outperform the market as retail flows chase "what is working"...


In fact this has very much been a year of momo...


But, as Bloomberg notes, U.S. stocks with the fastest-rising prices are showing the kind of strength they did in the 1990s, according to Jonathan Krinsky, chief market technician at MKM Partners LLC.


He cited this year’s swings in the MSCI USA Momentum and MSCI USA indexes in a report Sunday. The gap between them stands at 15 percent, a threshold that the momentum index only crossed on a full-year basis in 1999.


“Momentum is definitely stretched relative to the market, but there is no guarantee that it won’t become more stretched,” he wrote.


Sunday, October 8, 2017

The Last Time The Market Did This Was After Kennedy's Assassination

Via LPLResearch.com,


There have only been eight moves of at least 1% for the S&P 500 Index so far this year - the least since 13 in 1995. The all-time record was an incredible three in 1963.


What about a big move? The last time the S&P 500 moved at least 4% was nearly six years ago.


In fact, the S&P 500 had four consecutive days with 4% (or greater) changes in August 2011. Other than 2008 and the crash of ’87, that is the only other time since the Great Depression to see four consecutive 4% changes.


That isn’t anything like today’s action...


As the chart below shows, so far in 2017, big moves have been nonexistent; and even 1% changes have been rare.


Per Ryan Detrick, Senior Market Strategist,


“If you had forecast that the 11 months after the 2016 U.S. presidential election would be one of the least volatile periods ever, you would be in the minority.


Then again, the last time we saw a streak of calm like this was the year after John F. Kennedy was assassinated in November 1963.


Once again proving that the market rarely does what the masses expect and usually surprises us.”


And as LPL Research additionally notes, as equity markets continue to move higher, and as a result, several long streaks are taking place. Per Ryan Detrick, Senior Market Strategist,


“This is the Frank ‘The Tank’ market, as multiple streaks have taken place recently that are in the history books, with some being the most impressive ever.”


Here are some of the notable recent streaks:


  • Yesterday ended a streak of 17 consecutive closes for the S&P 500 Index within 0.5% of its previous closing price – the longest streak of small daily changes since 1969.

  • The S&P 500 Index has closed higher 8 days in a row for the first time since 2013 and has closed at all-time highs 6 days in a row for the first time since June 1997.

  • The S&P 500 has been up 8 consecutive quarters for the fifth time ever.

  • The Russell 2000 Index recently closed at a new all-time high eight days in a row.

  • The Euro STOXX 600 recently closed higher nine days in a row—the longest streak in more than two years.

  • The CBOE Volatility Index (VIX) yesterday closed at 9.19, its lowest close in history. It also closed beneath 10 for 7 consecutive days for the second time ever. Last, it averaged only 10.94 in the third quarter which is its lowest quarterly average ever.

  • The Russell Microcap Index recently closed at a new all-time high 12 out of 14 days.

  • The S&P 500 has closed higher a record 11 consecutive months on a total return basis (i.e., including dividends). Since 1950*, that has only happened two other times, with both instances taking place during the bull market of the 1950s. Be aware though, neither of those made it to 12 months.

Now That’s a Win Streak


Frank “The Tank’s” run through the quad and into the gymnasium eventually ended - and these long market streaks will eventually end as well. It is important to remember that daily streaks of new highs can’t go on forever, and that increases in volatility aren’t necessarily something to be overly concerned about; pullbacks are a regular part of investing.


In fact, the latter stages of the economic cycle have historically seen relatively more volatility, and we expect it to pick up in the fourth quarter and as we head into 2018.

Thursday, August 24, 2017

Why Is North America's Equity Market Underperforming?

Authored by Steven Vanelli via Knowledge Leaders Capital blog,


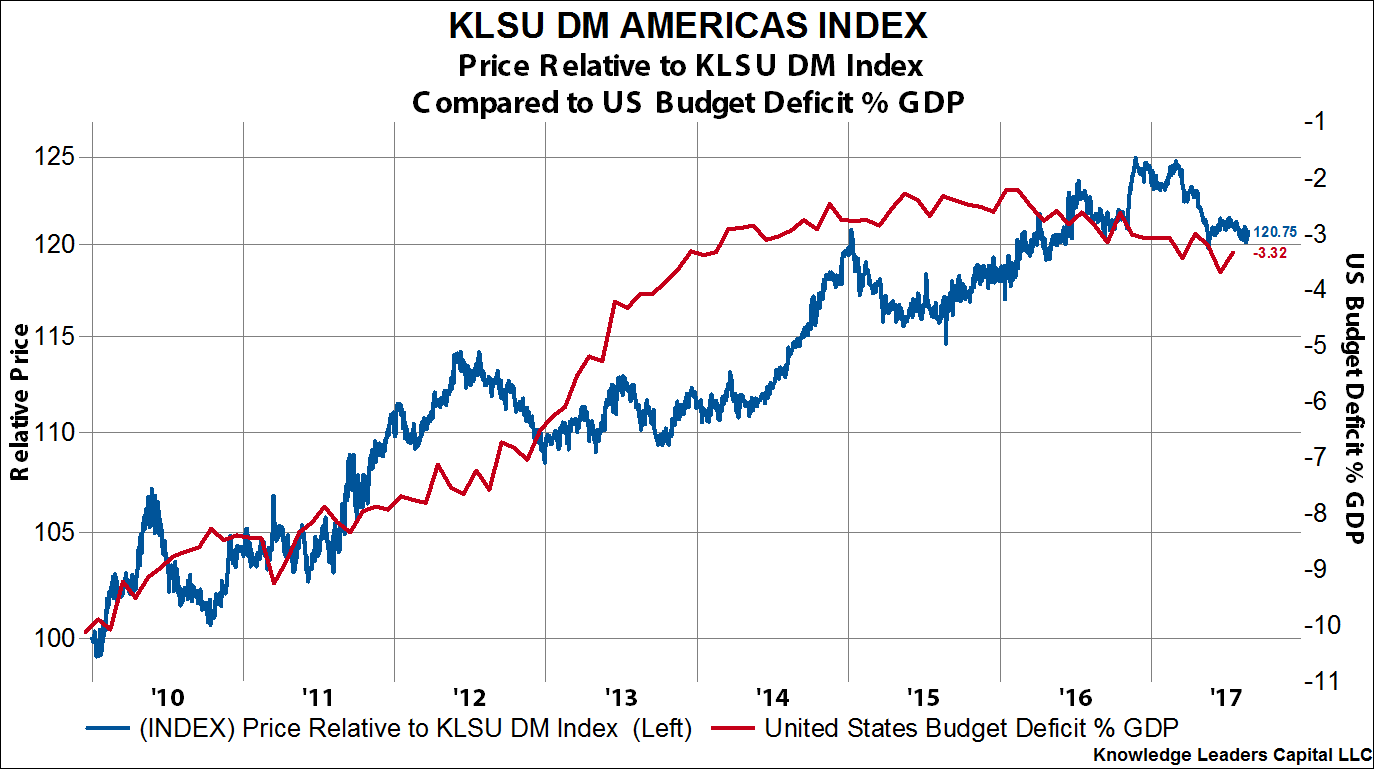
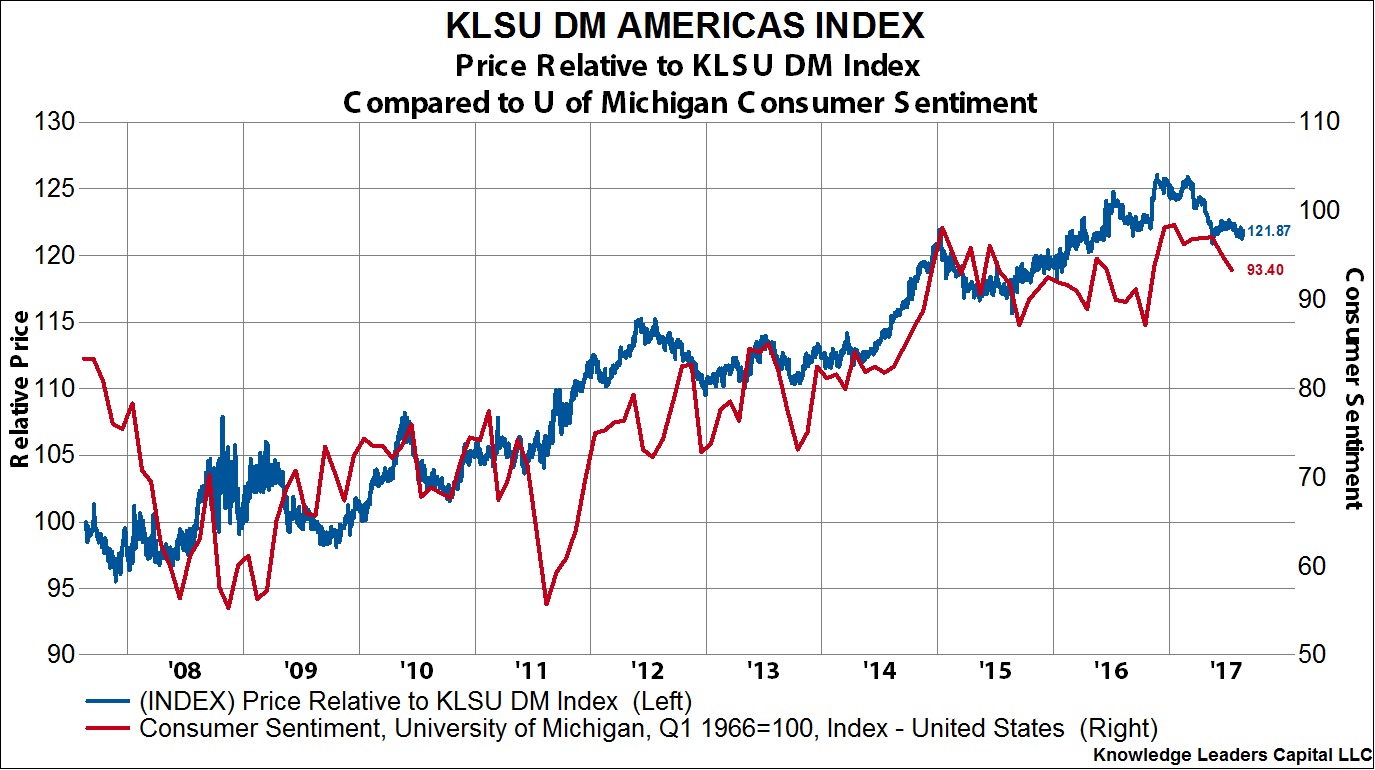
On a relative basis, compared to the developed world, North American stocks peaked on November 23, 2016, and have since underperformed by about 4% (in USD).


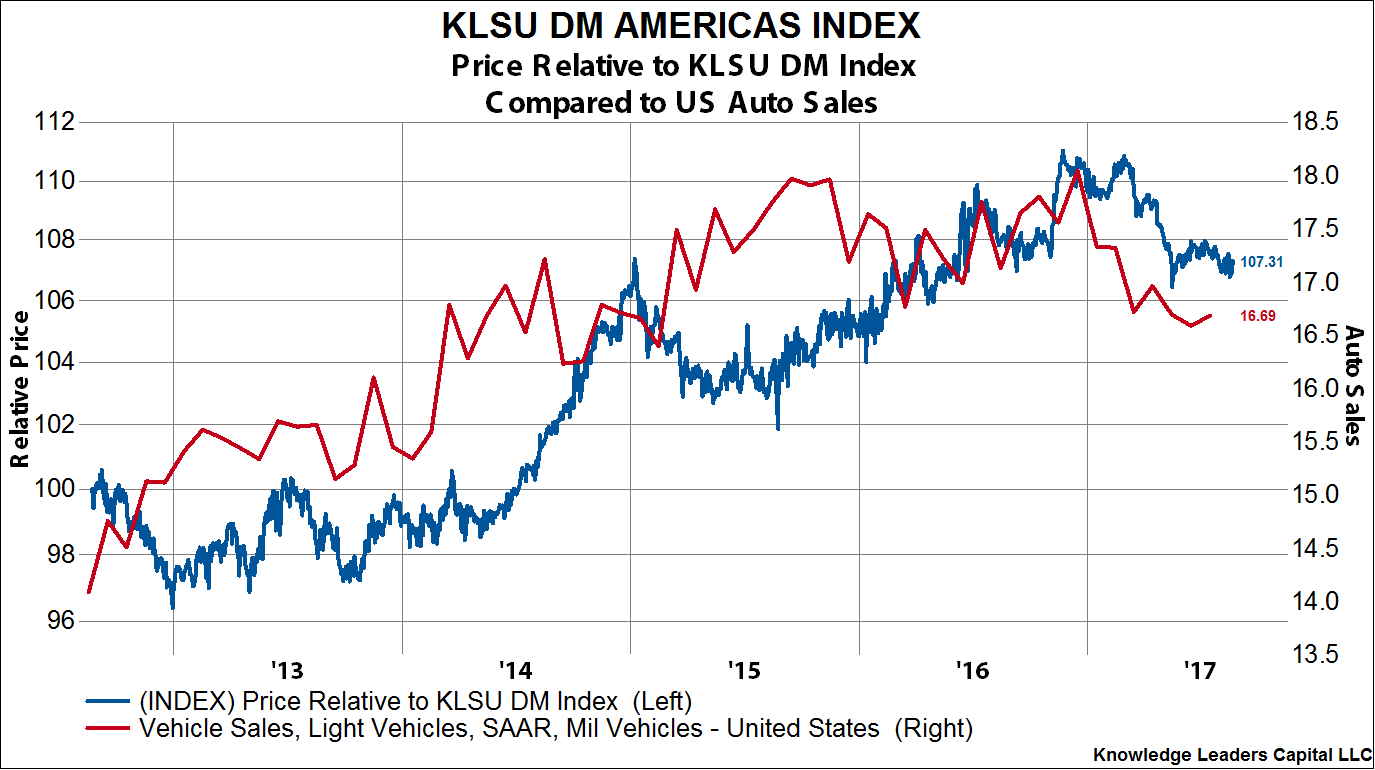
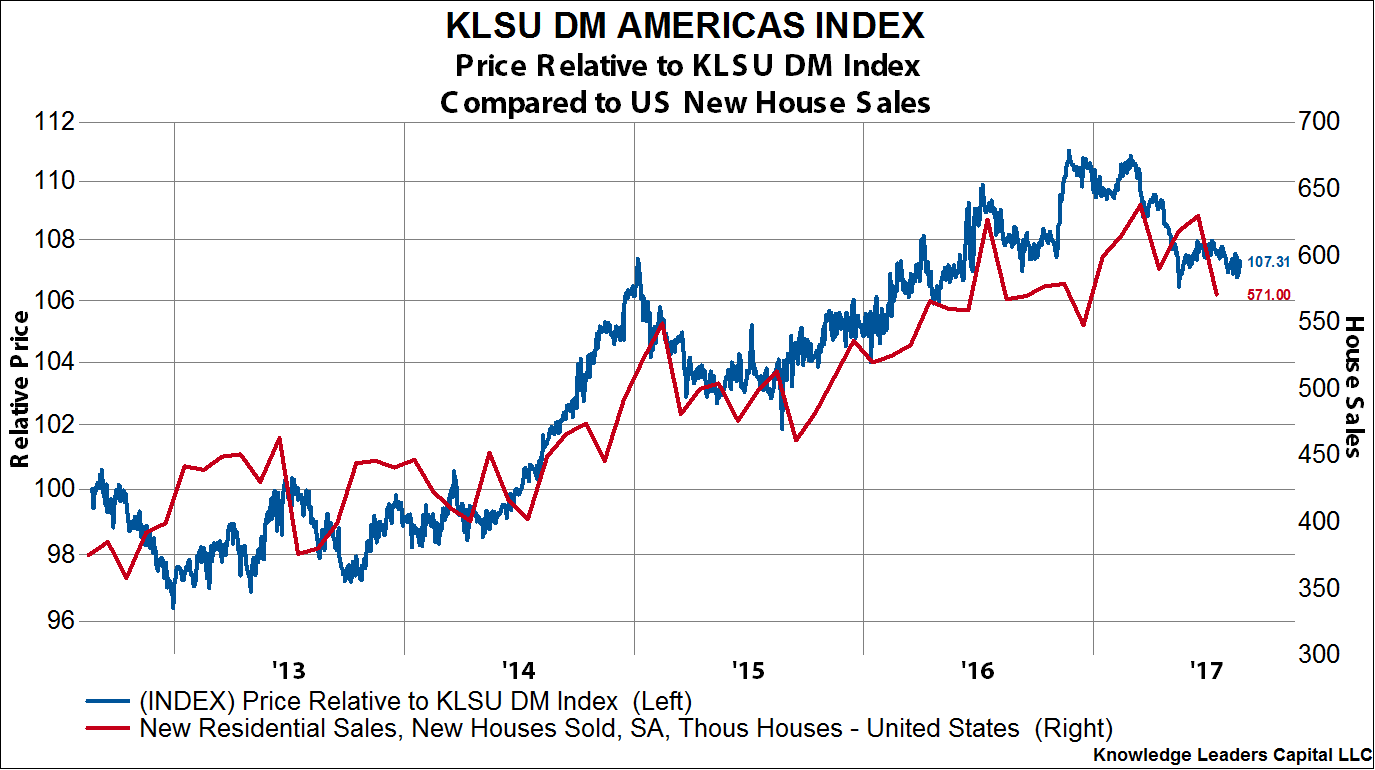
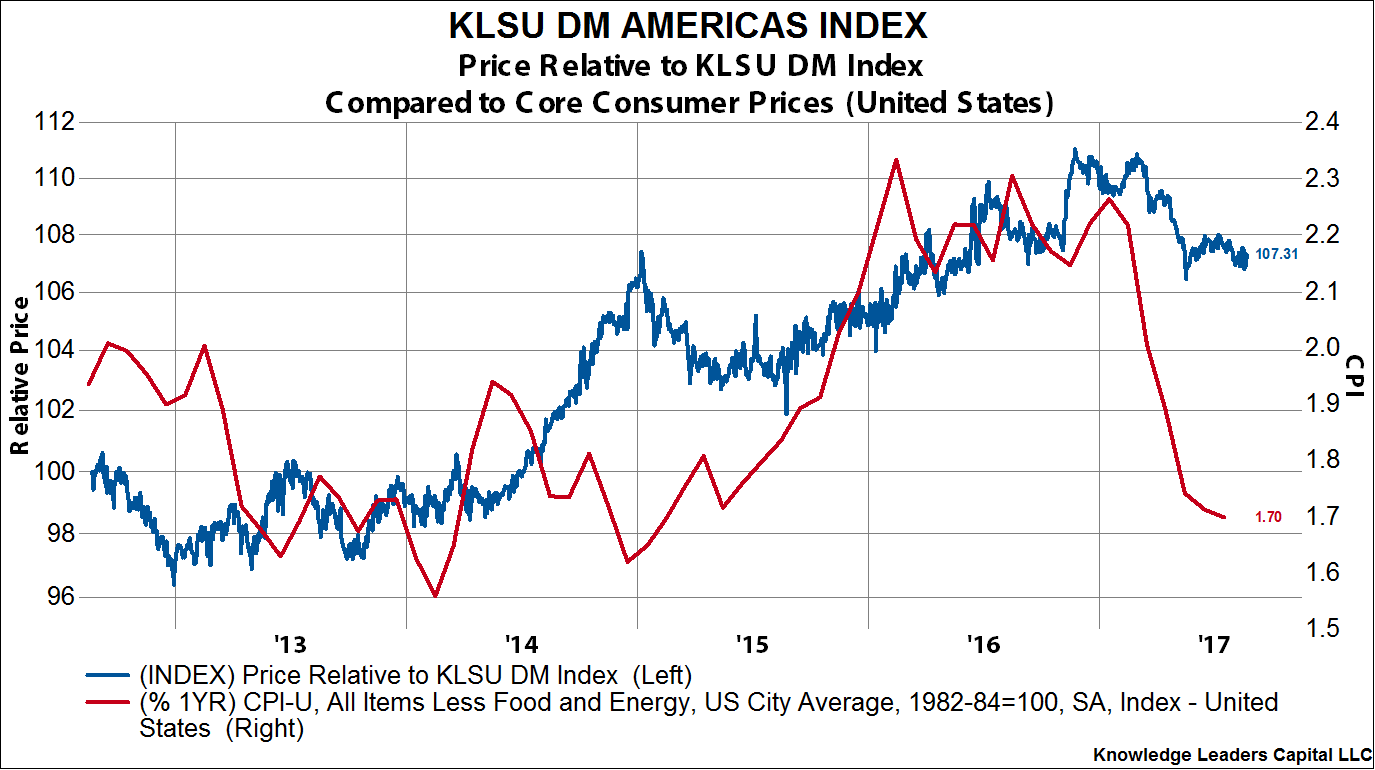
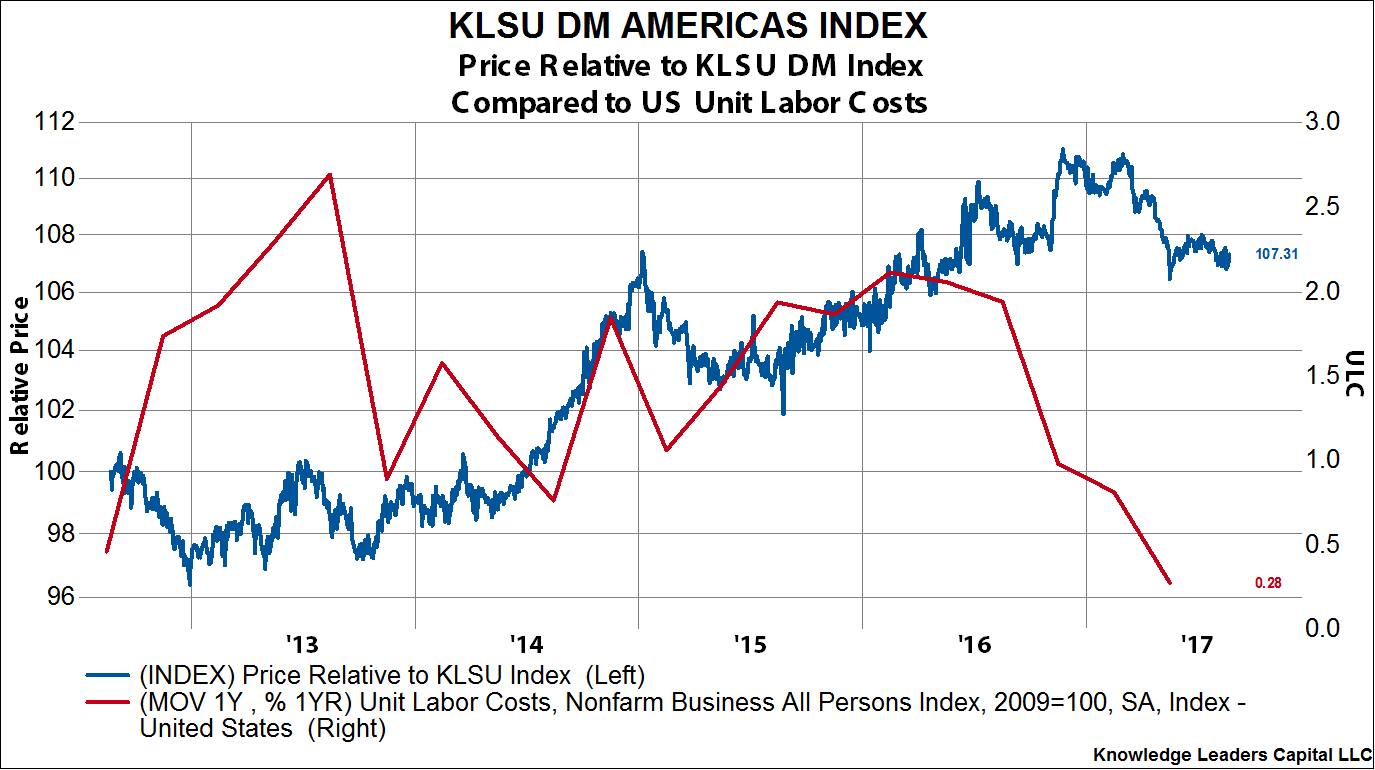
In the charts below, we compare the relative performance of our KLSU North America Index to various economic variables. Our KLSU North America Index captures the top 85% of the market cap in North America, is a market cap weighted index and USD based. Our KLSU DM Index captures the top 85% of the market cap of all 22 developed countries. It also is a market cap weighted index and USD based.


1. Auto sales have rolled over recently, having peaked at 18.05 million units in December 2016. The current run rate is 16.69 million units.


2. New house sales have stalled out. New house sales peaked in March at 638,000 units. July figures were released today showing sales have fallen to a level of 571,000 units.


3. Core inflation has slipped significantly lately, dropping from an annualized rate of 2.26% in January to a current level of 1.7%.


4. Driving the drop in inflation is the recent lower revision to compensation, which in turn caused a big revision down in corporate unit labor costs.


5. The US budget deficit is rolling over and beginning to widen again. After peaking at 2.21% of GDP in February 2016, the annualized budget deficit is now over 1% wider at 3.32% of GDP.


6. Lastly, it appears consumer confidence is waning, helping explain the weak retail figures we’ve seen.


*  *  *


ZH: But apart from that, BTFD!

Friday, August 18, 2017

European Stocks Have Never, Ever Been This Cheap Relative To American Markets

European stocks are offering the biggest discount on record relative to U.S. peers, according to one metric.


Members of the Stoxx Europe 600 Index are trading at 1.8 times the value of their assets, almost half that of S&P 500 Index constituents, the largest gap since Bloomberg started tracking the data in 2002.


World-beating gains in U.S. equities since the bull market kicked off in 2009 has widened the distance between the two, while recent volatility has also rendered its derivatives the most expensive relative to Europe since August 2015"s China deval collapse...


However, it appears Europe"s macro surprise data is rolling over and catching down to US macro surprise data...


And perhaps worse still, EURUSD is rolling over (just as it did in 2013), ready to catch down to its rates-implied level, crushing USD-relative returns...


But of course, it"s what happens next here that really matters...


Yellen and Draghi next week in Jackson Hole may hint ath whether this is the end of the beginning or the beginning of the end.

Thursday, August 3, 2017

India's Economy Crashes After "Mind-Bogglingly Inane" Tax System Strikes Back

With just a hint of schadenfreude, we note that, following our discussion of "how to destroy an economy", India"s Composite PMI collapsed to 46.0 in July - its lowest on record (well below the kneejerk lows after demonetization in November) as the "mind-bogglingly inane" new tax system and demonetization efforts continue to crush the poor and feed the wealthy.


As Goldman Sachs notes India"s Nikkei Markit services PMI contracted in July after reaching a 8-month high in June, following a decline of manufacturing PMI on Tuesday. The fall was led by a significant decline in new business, suggesting a worsened business sentiment after the GST implementation on July 1.


Main points:


  • India"s Nikkei Markit services PMI contracted to 45.9 (the lowest reading since September 2013). Combined with the manufacturing PMI reported on Tuesday, the July composite PMI fell to 46.0, the lowest reading since March 2009.

  • Among subcomponents, the new business index fell the most to 45.2 (from 53.3 in June), reflecting disruptions caused by the GST.

  • As the press release from Markit Economics mentioned, “Most of the contraction was attributed to the implementation of the goods & services tax and the confusion it caused".

  • The employment index for services fell to 48.9 (from 51.8 in June).

  • That said, the index for business expectations rose to a 11-month high to 62.3, suggesting optimism from services providers about the future once they have more clarity about the new tax system.

  • The output price index rose to 54.6 (from 51.0 in June), while the input price index moderated to 51.7.

  • Overall, PMI data for July suggest a significant drag on new business activity post the GST implementation. That said, optimism expressed by both manufacturers and services providers about the future is encouraging and suggest a potential improvement in activity once businesses adjust to the new tax system.

From 8-month highs to record lows... why does any one put any faith in the useless "soft" surveys?


But expect more of this insanity to come, as one Indian businessman told us...


Given that the incumbent government has been winning elections despite steps like demonetization and the opposition is in complete disarray (Modi is a great orator), they have been emboldened to introduce measures that would be viewed as draconian by normal standards.


In this context, I have to mention Modi has been able to mesmerize voters to an extent that he can make even pain appear as something that is pleasurable and he has been able to conquer state after state and has an invincible aura about him now.


Such acts always bring Goebbels to my mind.


Monday, July 31, 2017

Dallas Fed Activity Improves But Respondent Warns "Prospects For Better Are Dimming"

After peaking in February, Dallas Fed"s Manufacturing Outlook has slid almost constantly until July which just saw it bounce modestly from 15.0 to 16.8 (stil below May"s levels)


Reading The Dallas Fed"s breakdown reports,  one wuld think everything is awesome!.


The production index, a key measure of state manufacturing conditions, rose 11 points to 22.8, indicating output grew at a faster pace than in June.


Other measures of current manufacturing activity also indicated a pickup in growth. The new orders and the growth rate of orders indexes rose several points each, coming in at 16.1 and 12.2, respectively. The capacity utilization index moved up to 18.1 and the shipments index increased three points to 11.6.


Perceptions of broader business conditions improved again in July, with a sharp pickup in outlooks. The general business activity index edged up to 16.8, marking a 10th consecutive positive reading. The company outlook index jumped 15 points to 25.9, reaching its highest level since 2010.


Labor market measures indicated slightly stronger employment gains and longer workweeks this month. The employment index has been positive all year and edged up to 11.2, its highest reading since the end of 2015. Twenty-one percent of firms noted net hiring, compared with 9 percent noting net layoffs. The hours worked index ticked up to 9.8.


Prices and wages continued to rise in July. The raw materials prices index held steady at 15.5, while the finished goods prices index moved up slightly to 5.6. The wages and benefits index remained somewhat elevated at 20.6.


Expectations regarding future business conditions continued to reflect optimism. The indexes of future general business activity and future company outlook held steady at 31.6 and 34.8, respectively. Other indexes of future manufacturing activity showed mixed movements but remained solidly in positive territory.


But, respondents did not seem to be so exuberant...


  • The foreign competition for new equipment is extremely competitive and our company is not able to match their selling prices.

  • Things are going poorly in the economy. We have no projects, and business is slow.

  • We are experiencing the summertime blues. Business is very dull July to date.

  • We are feeling more confident about the economy improving. More buyers seem to be more confident and placing orders with increased volumes and deliveries further into the future.

  • One huge order has spurred our manufacturing. However, nothing similar is expected in the near future.

  • There has been a notable decline in orders from energy industry customers over the past 30 days given the drop in oil prices. There is very little visibility on customer demand in the second half of the year.

  • The drop in oil prices in 2015 forced us out of our comfort zone and into new industries and locations. We have found that manufacturing technology from the oil industry applies equally well to defense, aerospace, heavy vehicle manufacturing and power generation. As oil recovers, we will also benefit from working in these new markets.

  • The increases in business are small but measurable. We have been trying to add employees over the last six months, with no qualified candidates available.

  • Grocery store deli and fast-food chain activity remains fairly slow. We are seeing increased activity, with convenience store remodels driven by increased food offerings.

And what about this!!


  • I cannot explain it, but we are slower than we have ever been at this time and it seems like we are not the only ones. This is crazy how summer-vacation mindset seems to have set in and companies are just not committing to projects. Most everyone I have spoken to in the graphic arts community is complaining of the same thing. If this doesn’t turn around quickly, there will be some significant cutbacks around here—something that will be very painful, as we are down to only talented workers with no fat to trim.

And finally there"s this...


  • Washington, D.C., is still a significant contingent factor for a better or worse outlook. Prospects for better are dimming.

Saturday, May 6, 2017

These Are The Most Expensive (And Best) Cities Around The World

Every year Deutsche Bank releases its fascinating index of real-time prices around the world which looks at the cost of goods and services from a purchase-price parity basis, to determine the most expensive - and in this year"s edition, best - cities. As have done on several occasions in the past, we traditionally focus on one specific subindex: the cost of "cheap dates" in the world"s top cities.


The index consists of i) cab rides, ii) dinner/lunch for two at a pub or diner, iii) soft drinks, iv) two movie tickets and a v) couple of beers. Deutsche Bank"s advice to those in Zurich is either to marry young or choose your blind dates carefully as its "cheap date" index continues to see Zurich as the most expensive place for courtship. Tokyo climbs to second and Oslo, Copenhagen and Stockholm make up the top 5. Indeed these 5 cities are also the most expensive for a haircut so the pre-date investment costs are also high!


If you"re in the Philippines, Indonesia, Malaysia, India and Mexico a date is around a quarter of the cost of that in Zurich and a haircut about a tenth of the price. So if you"re young, free and single in Zurich, depending on how much you date it might be profitable to migrate to parts of Asia even after the salary sacrifice, the German bank suggests.


And while traditionally we end it here, focusing merely on the most (and least) expensive cities part of the study, this year it is worth expanding because what started off as a pet project for Jim Reid back in 2011 has turned into a purchase-price parity masterpiece, as well as a crowdsourced "quality of life" index, which ranks some 50 of the world"s top cities on par with any of the rankings seen in various other, more popular rankings such as that by Mercer. As the London-based banker writes, "We continue to add new cities, refine our methodology and while it’s impossible to exactly match products and services around the world we try to ensure as much uniformity as possible and then convert prices back to USD."


Some further details:


This year Deutsche has added a few new series. In particular average after-tax salaries, average 2-bed apartment rental costs and finally a quality-of-life index that is the most subjective measure in the report and will probably cause most arguments, debates and disagreements. A lot of the data in the report is crowdsourced (including this new quality-of-life index). Wellington, NZ comes out on top out of the 47 cities we cover based on purchasing power, crime, healthcare, cost of living, house prices, commuting time, pollution and climate. Edinburgh, Vienna, Melbourne, Zurich and Copenhagen are next. Of our 47 cities, the "mega cities" like Tokyo (rank 27), NYC (28), Paris (30), London (33), Shanghai (37) and Mumbai (45) rank very low mostly due to high living costs, crime, pollution and commuting time. Megacity dwellers may also forsake short-term quality of life for aspirational reasons with these cities providing more upside rewards from the average for those most successful.


Looking simply at most expensive cities, Reid finds that Zurich remains the most expensive place to do and buy a lot of things but does have the highest average salaries, followed by several US cities and then Sydney. London has slipped out of the top 10 post the Brexit-FX fall.  


Rents are highest in San Fran, HK, NYC, London and then Zurich. Of note: the difference for a 2 bedroom rental between the most expensive city, San Francisco, and India"s Bangalore, when indexed in USD is a whopping 12 times.


Zurich is home to the highest ‘disposable income after rents’ and at the top of the purchasing power index.


However it might depend on how many dates and haircuts you have in a month (see top chart) as to how wealthy you feel. At the other end of the scale if you"re in Jakarta, Manila, Rio, New Delhi and Istanbul and a job comes up in Zurich then you could potentially increase your salary by ten-fold. Mind the cost of living increases though.


Global brands continue to be relatively cheaper in the US than across its DM peers. The top 10 most expensive regions across goods and services remain dominated by European cities. Swiss and Nordic/Scandinavian cities in particular require a tolerant bank manager to enable consumption. If you find yourself on holiday in Turkey, Brazil, Russia or Greece try to avoid the Apple store as iPhones are  25-50% more expensive than in the US - still the cheapest place to buy. Japan, Hong Kong, Malaysia and Canada only see a small premium over US prices.


The "weekend getaway" index reflects the general cost of living around the world but is perhaps biased by hotel costs.


Milan is the new number-one (very expensive hotels), followed by Copenhagen, Zurich, London, Stockholm, Vienna and NYC. Much lower hotel costs in Asia continue to keep these cities as attractive holiday destinations.


The "bad habits" index of cigarettes and beers is most costly in Australia, NZ and Singapore. At the opposite end of the spectrum it’s very cheap to indulge in such habits in the Czech Republic and South Africa.


If you relocate to Singapore, Copenhagen or Oslo consider a bike rather than a new car as duties etc. make the cost very prohibitive.


Avoid car rentals in Amsterdam and try not to get thirsty in Oslo (beer or coke)...


... and refrain from buying jeans and trainers in Copenhagen.


Petrol costs most in HK and public transport most in London.


Zurich also tops the rankings for most expensive movie tickets, while those who want to stay in shape will spend the most in Tokyo (with Zurich 2nd).


Hungry? A basic dinner will set up back some $73.70 in Zurich, while a full course dinner for two is most expensive in Oslo and costs just about $130.


Finally, new to this year’s study is a quality-of-life index of the 47 major cities DB collected prices for across the rest of this document. Figure 1 shows the overall index level plus the ranks for the individual components. The data has been collected by www.numbeo.com - a large crowd-sourced information database on global prices, quality of living etc. The data is based on the following 8 variables; purchasing power, safety, healthcare, cost of living, house prices/income, commuting time, pollution and climate.


Monday, March 13, 2017

Trader Warns: Fed Rate Hike Will Be The "Death Knell" For Reflation Trades

Thanks to commodities, Bloomberg"s Mark Cudmore warns that the Fed meeting is more likely to be the death knell for reflation trades rather than mark their moment of victory.


This week is set to provide confirmation that we’re in the midst of a true tightening cycle in the U.S., with rate hikes in consecutive quarters for the first time since 2006.


10-year Treasury yields hover just below the two-year high, but I don’t see them breaking higher in an environment where commodity prices are plunging.


Oil was just the latest victim last week, with prices falling the most in four months. The broader Bloomberg Commodity Index topped out a month ago, with everything from metals to agricultural goods turning sharply lower since then.


This undermines the reflation trade in three ways.


  1. Most directly, it’s hard for inflation to keep accelerating when input prices are slumping.

  2. It also suggests that real demand is not growing as quickly as hoped, which provides caution on economic optimism.

  3. Finally, while cheaper commodity prices are a long-term positive for economic growth, the more immediate wealth/portfolio effect is negative.

Price data from the U.S. this month has validated the suspicion that inflation is not rising as fast as forecast, with the PCE deflator coming in below expectations.


This isn’t an environment that supports much higher long- term yields. Add in the context that speculative short positions in Treasuries remain near record levels and it appears to be a market ripe for a squeeze.


Furthermore, as Bloomberg"s Richard Breslow concludes:


The abrupt about-face by the Fed has dealt a severe blow to the efficacy of forward guidance.


Markets will understandably assume that central banks are now using commentary as a tactical device to control the moment rather than a way of describing a strategic plan based on long-term forecasts.


It means we are in for a lot more false steps, conspiracy theories and greater volatility


Wednesday, February 15, 2017

As Le Pen Odds Surge; French Stock Market Risk Hits 5-Year High, Credit Risk Spikes

Marine Le Pen"s French election victory odds reached their highest level of the campaign overnight and it appears global investors are starting to panic-bid protection against the consequences for French stocks...


Oddschecker indicates Le Pen"s incessant rise in popularity...


And as Bloomberg notes, as the French prepare to choose their next president, investors are paying up to hedge against swings in the nation’s shares.


The cost of three-month options on the CAC 40 Index has rallied to a five-year high relative to those on the regional Euro Stoxx 50 Index.


The first round of elections will be on April 23 and the second on May 7... one wonders how much higher this "relative" risk can go before it spills over into something systemic... because French credit risk is now at its highest in 4 years...


Monday, January 30, 2017

Trumphoria Is All 'Soft' Data - RBC Warns "Now The Rubber Needs To Meet The Road"


RBC"s head of US cross-asset strategy Charlie McElligott asks "Is US economic data beginning to ‘mean-revert’ lower?"


It’s an inherent property of economic surprise indices, as they reflect relative to expectations, which are in a constant state of “true up” to actuals. 


Yesterday’s and today’s US data from the headline level has sent various “economic surprise indices” for US lower, with Bloomberg’s index nearing YTD lows. In fact, Citi"s index suffered its worst week since October...


The US data has been running at such a clip as a matter of fact it’s an increasingly (and massively rhetorical) popular question asked by clients: when do analyst / strategist expectations begin to overshoot?


Tied-into this, the Bloomberg “econ surprise” series gives an interesting breakout of the drivers of the directional data surprises, and it crystalizes one ‘area’ that Mark Orlsey and I have been paying a lot of attention to with regards to where the largest ‘beats’ are coming from.


The economic surveys and “animal spirits” indicators have been ‘en fuego’ (see Friday’s U Mich Confidence printing highs since 2003!), and the chart below captures just how much of the “surprise index” upside that surveys have been dictating - it’s visually stunning, and reiterates that “rubber needs to meet road” in coming-months.


“ANIMAL SPIRITS” ARE DRIVING MUCH OF THE U.S. DATA SURPRISES: Per the Bloomberg Economic Surprise Monitor.


Indeed, as the following chart shows, it has been a one-way street of hope in the surveys - a very different picture to the economic view painted by "real" data...


In fact, the spike in "soft" survey data is second only in history to the exuberance experienced in early 2011...


That did not end well for stocks...


And so, as RBC"s McElligott explains, "the rubber needs to hit the road" shortly as "soft" macro data mean-reverts and needs to be covered by a resurgence in real "hard" data.