Showing posts with label DJ Euro Stoxx 50. Show all posts

Saturday, October 14, 2017

The Curious Case Of Missing The Market Boom

Authored by Raul Ilargi Meijer via The Automatic Earth blog,


“The Cost of Missing the Market Boom is Skyrocketing”, says a Bloomberg headline today. That must be the scariest headline I’ve seen in quite a while. For starters, it’s misleading, because people who ‘missed’ the boom haven’t lost anything other than virtual wealth, which is also the only thing those who haven’t ‘missed’ it, have acquired.


Well, sure, unless they sell their stocks. But a large majority of them won’t, because then they would ‘miss’ out on the market boom… Some aspects of psychology don’t require years of study. Is that what behavioral economics is all about?


And it’s not just the headline, the entire article is scary as all hell. It reads way more like a piece of pure and undiluted stockbroker propaganda that it does resemble actual objective journalism, which Bloomberg would like to tell you it delivers. And it makes its point using some pretty dubious claims to boot:


The Cost of Missing the Market Boom Is Skyrocketing


Skepticism in global equity markets is getting expensive. From Japan to Brazil and the U.S. as well as places like Greece and Ukraine, an epic year in equities is defying naysayers and rewarding anyone who staked a claim on corporate ownership. Records are falling, with about a quarter of national equity benchmarks at or within 2% of an all-time high.


If equity markets in places like Greece and Ukraine, ravaged by  - in that order - financial and/or actual warfare, are booming, you don’t need to fire too many neurons to understand something’s amiss. Some of their companies may be doing okay, but not their entire economies. Their boom must be a warning sign, not some bullish signal. That makes no sense. Stocks in Aleppo may be thriving too, but…


“You’ve heard people being bearish for eight years. They were wrong,” said Jeffrey Saut, chief investment strategist at St. Petersburg, Florida-based Raymond James, which oversees $500 billion. “The proof is in the returns.” To put this year’s gains in perspective, the value of global equities is now 3 1/2 times that at the financial crisis bottom in March 2009.


If markets crash by, pick a number, 20-30-50% next week, will Mr. Saut still claim “The proof is in the returns”? I doubt it. Though this time he might be right. As for the ‘value’ of global equities being 250% (give or take) higher than in March 2009, does that mean those who were -or still are- bearish were wrong? Or is there some remote chance that the equities are part of a giant planetwide bubble?


Aided by an 8% drop in the U.S. currency, the dollar-denominated capitalization of worldwide shares appreciated in 2017 by an amount – $20 trillion – that is comparable to the total value of all equities nine years ago. And yet skeptics still abound, pointing to stretched valuations or policy uncertainty from Washington to Brussels. Those concerns are nothing new, but heeding to them is proving an especially costly mistake.


$20 trillion. That’s a lot of dough. It’s what all equities in the world combined were ‘worth’ 9 years ago. It’s also, oh irony, awfully close to the total increase in central bank balance sheets, through QE etc. Might the two be related in any way?


Clinging to such concerns means discounting a harmonized recovery in the global economy that’s virtually without precedent – and set to pick up steam, according to the IMF. At the same time, inflation remains tepid, enabling major central banks to maintain accommodative stances.


‘Harmonized recovery’ is a priceless find. But you have to feel for anyone who believes it. And it’s obviously over the top ironic that central banks are said to be ‘enabled’ to keep rates low precisely because they fail to both understand and raise inflation. Let’s call it the perks of failure.


“When policy is easy and growth is strong, this is an environment more conducive for people paying up for valuations,” said Andrew Sheets, chief cross-asset strategist at Morgan Stanley. “The markets are up in line with what the earnings have done, and stronger earnings helped drive a higher level of enthusiasm and a higher level of risk taking.”


Oh boy. He actually said that? What have earnings done? He hasn’t read any of the warnings on P/E (price/earnings) for the (US) market in general –“the Shiller P/E Cyclically Adjusted P/E, or CAPE, ratio, which is based on the S&P 500’s average inflation-adjusted earnings from the previous 10 years, is above 30 when its average is 16.8”– or for individual companies (tech) in particular?


The CAPE ratio has been higher than it is now only twice in history: right before the Great Depression and during the dotcom bubble, when tech companies didn’t even have to be able to fog a mirror to attract billions in ‘capital’. And the chief cross-asset strategist at Morgan Stanley says markets are in line with earnings? Again, oh boy.


No, it’s not earnings that “..helped drive a higher level of enthusiasm and a higher level of risk taking.” Cheap money did that. Central banks did that. As they were destroying fixed capital, savings, pensions.


The numbers are impressive: more than 85% of the 95 benchmark indexes tracked by Bloomberg worldwide are up this year, on course for the broadest gain since the bull market started. Emerging markets have surged 31%, developed nations are up 16%. Big companies are becoming huge, from Apple to Alibaba.


Look, emerging markets and developed economies have borrowed up the wazoo. Because they could. Often in US dollars. That may cause a -temporary- gain in stock markets, but it casts a dark spell over the reality of these markets. If it’s that obvious that a substantial part of your happy news comes from debt, there’s very little reason to celebrate.


Technology megacaps occupy all top six spots in the ranks of the world’s largest companies by market capitalization for the first time ever. Up 39% this year, the $1 trillion those firms added in value equals the combined worth of the world’s six-biggest companies at the bear market bottom in 2009. Apple, priced at $810 billion, is good for the total value of the 400 smallest companies in the S&P 500.


To cast those exact same words in a whole different light, no, Apple is not ‘good for the total value of the 400 smallest companies in the S&P 500’. Yes, you can argue that Apple’s ‘value’ has lifted other stocks too, but this has happened in a time of zero price discovery AND near zero interest rates. That means people have no way to figure out if a company is actually doing well, so it’s safer to park their cash in Apple.


Ergo: Apple, and the FANGs in general, take valuable money out of the stock market. At the same time that they, companies with P/E earnings ratios to the moon and back, buy back their stocks at blinding speeds. So yeah, Apple may be ‘good’ for the total value of the 400 smallest companies in the S&P 500, but at the same time it’s not good for that value at all. It’s killing companies by sucking up potential productive investment.


And Apple’s just an example. Silicon Valley as a whole is a scourge upon America’s economy, hoovering away even the cheapest and easiest money and redirecting it to questionable start-up projects with very questionable P/E ratios. But then, that’s what you get without price discovery.


Overall, U.S. corporate earnings are expected to rise 11% this year, on track to be the best profit growth since 2010. And after years of disappointments, European profits are set to climb 14% in 2017, Bloomberg data show. The expectations for both regions are roughly in line with forecasts made at the beginning of the year, defying the usual pattern of analysts downgrading their estimates as the months go by.


Come on, the European Central Bank has been buying bonds and securities at a rate of €60 billion a month for years now. How can it be any wonder that officially stock markets are up 14%? Maybe we should be surprised it’s not 114%. Maybe the one main point in all of this is that the ECB is still buying at that rate, and thereby signaling things are still as bad as when they started doing it.


Meanwhile, Asia is home to some of the world’s steepest rallies, led by Hong Kong stocks that are up 29% this year. Shares in Tokyo also hit fresh decade highs this week, bolstered by investor confidence before the local corporate earnings season and a snap election this month. “Asia will benefit from continued improving regional growth, stable macroeconomic conditions and undemanding valuations,” said BNP Paribas Asset Management’s head of Asia Pacific equities Arthur Kwong. Any pullback in Asian equities after the year-to-date rally presents a buying opportunity for long-term investors, he wrote in a note.


In Japan, so-called investor confidence is based solely on the Bank of Japan continuing to purchase anything that’s not bolted down. In China, the central bank buys the kitchen sink as well. How, knowing that, can you harp on about increased investor confidence? As if central banks taking over entire economies either isn’t happening, or makes no difference to economies? Buying opportunity?


Global economic growth has been robust in most places, with Europe finally joining the party and the euro-area economy on track for its best year since at least 2010. The region’s steady recovery has eclipsed worries about populism, which a few years ago would have been enough to derail any stock market rally.


No, global economic growth has not been ‘robust’. Stock market growth perhaps has been, but that’s only due to QE and buybacks. Still, stock markets are not the economy.


“I’ve never been so optimistic about the global economy,” said Vincent Juvyns, global market strategist at J.P. Morgan Asset Management. “Ten years after the financial crisis, Europe is recovering and we have synchronized economic growth around the world. Even if we get it wrong on a country or two, it doesn’t change the big picture, which is positive for the equity markets.”


Oh man. And at that exact moment the ECB announces it wants to cut its QE purchase in half by next year.


Nowhere is the shifting sentiment more pronounced than in Europe, where global investors began the year with a election calendar looming like a sword of Damocles. Ten months later, the Euro Stoxx 50 Index is up 10%, Italy’s FTSE MIB Index is up 17% and Germany’s DAX Index is up 13%. The rally is even stronger when priced in U.S. dollars, with the Euro Stoxx 50 up 23% since the start of the year.


Sure, whatever. I don’t want to kill your dream, and I don’t have to. The dream will kill itself. You’ll hear a monumental ‘POP’ go off, and then you’re back in reality.

Saturday, September 30, 2017

Gold Matches S&P 500 Performance In First 3 Quarters; Up 12% 2017 YTD

Editor Mark O"Byrne


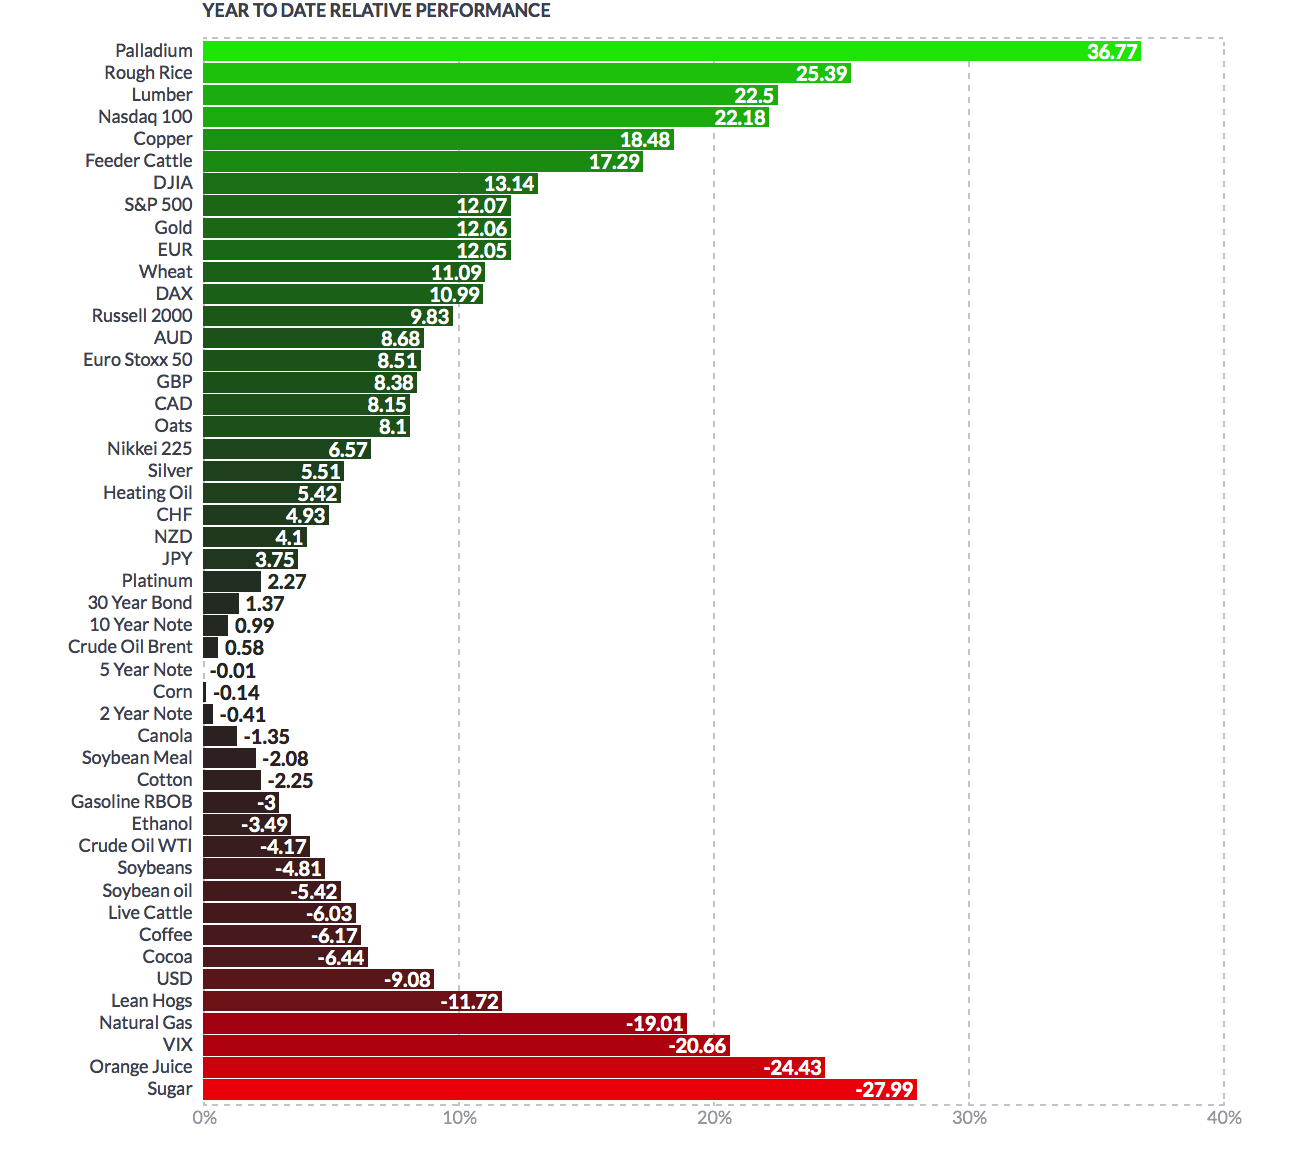
- Gold climbs over 12% in YTD, matching S&P500 performance
- Palladium best performing market, surges 36% 2017 YTD
- Gold outperforms Nikkei 225, Euro Stoxx 50, FTSE and ISEQ
- Geo-political concerns including Trump and North Korea supporting gold
- Safe haven demand should push gold higher in Q4
- Owning physical gold not dependent on third party websites and technology remains essential


Click to enlarge. Source Finviz.com


In the year-to-date the gold price performance has matched the S&P 500, climbing over 12%.


Gold"s matching of the S&P 500 is particularly impressive when you consider the record-breaking performance of the benchmark stock market index in the last year. Yesterday it advanced 0.1% to 2510.06, a new all time record high price.


It is also impressive considering sentiment towards stocks is shall we say "irrationally exuberant", while sentiment towards gold remains muted despite gold eking out gains in 2016 and now again in 2017.


The precious metal has performed well predominantly due to rising uncertainties regarding North Korea, Trump and the political mess in the U.S. and other geopolitical tensions.


Its strong performance is despite noise from the US Federal Reserve regarding its alleged plans to tighten money supply and increase rates. Other major central banks have also provided similar indications.


Elsewhere, gold has outperformed both the Euro Stoxx 50 and Nikkei 225 which are 8.5% and 6.5% higher respectively. The UK"s FTSE and Ireland"s ISEQ are underperforming and have the hallmarks of markets that are topping out.


The FTSE and the ISEQ are 2.5% and 4.25% higher year to date.


Silver, platinum and palladium up 5.5%, 2% and 37%  YTD respectively


Gold wasn"t the only precious metal that performed well in the last three quarters. All four precious metals have climbed in price.


Palladium has been the headline grabbing asset in the last year. In the year-to-date the industrial precious metal is up by nearly 37%. Holdings in exchange-traded funds backed are close to the highest since the beginning of the year.


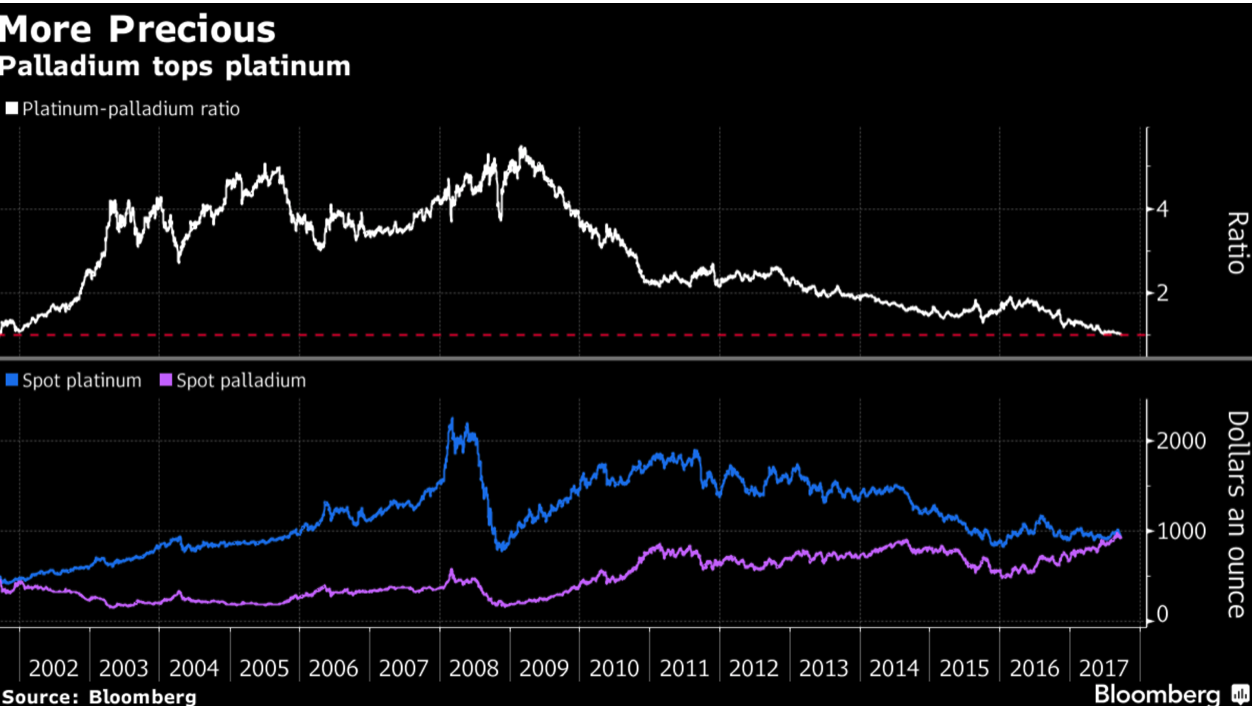
This week for the first time since 2001, palladium topped the platinum price. Palladium is predominantly used in pollution-control devices for gasoline-powered cars and trucks. In contrast platinum is used in diesel-powered engines.


Governments have been slowly clamping down on diesel due to concerns over its role in pollution and emissions scandals. Platinum is up by only 2% this year. Some believe the metal has been oversold in recent days and there is too much heat in the palladium market.palladium tops platinum
Meanwhile silver is refusing to go below $16/oz. Some investors may feel disappointed that it has failed to break above $19/oz this year, despite strength in gold.


Investors in silver must continue to take heart that silver does still stand to gain whenever the U.S. dollar loses strength or concerns about the stock market creates demands for assets to hedge risk with.


Geo-political concerns with North Korea and elsewhere fuel demand


In a recent Bank of America Merrill Lynch survey the biggest "tail risk" seen by investors was North Korea"s missile risk.


This was ahead of policy missteps in central banks of the US and China, and credit tightening in China.


However, worries over nuclear war are not the only concern fuelling the price of gold. Uncertainty regarding political haggling and stalemate in Washington are also providing key support.


Trump cronyism


Critics of President Trump are concerned that he and his team have achieved very little since his inauguration. Any plans that have been proposed are seemingly poorly devised and quickly shot-down.


This week the Republicans failed once again to defeat Obamacare, a key component of Trump"s election promises. Also the White House announced a plan for a lower corporate tax rate and to cut the highest individual income tax rate.


Critics argued however that the plan was awash with cronyism and helped the wealthy. There was also little indication given as to how the tax cuts would be funded amid risks that deepening U.S. deficits may further weaken the dollar.


Expect more safe haven demand next quarter 


As we all know, gold is a barometer for uncertainty. With a 12% climb in the last year and no sign of risks abating, there is little reason to not expect the price to continue to climb.


Should gold reach $1,400, then this will be a four-year high and a sure sign of a bullish breakout for the precious metal.


We shouldn"t invest in gold because of some ambulance-chasing punt on geopolitical disaster. Gold should play a key role in your investment portfolio as a tool for protecting against risk and hedging declines in stock and other markets and currency devaluations.


In truth, there is still a huge amount of uncertainty regarding the outlook for the global economy and global markets.


No one knows how central banks" attempts to unwind the last decade of monetary policy will play out, nor does anyone know how President Trump"s government will survive in an America that will continue to feel more pressure from the likes of Russia and China.


Investors need to stay focused on the medium and especially the long-term and the bigger picture.


Editors Conclusion


Sentiment in the gold market remains quite poor. Most of the public remains on the sidelines  and there is very little positive coverage of gold.


Nor is there an appreciation of the scale of economic, geo-political and monetary risks facing investors and savers today.


There remains a fundamental lack of knowledge of the still very strong supply and demand factors driving the physical gold market and a lack of understanding as to why gold remains a vitally important asset to own in a portfolio.


Many stock markets are at record highs. Many bond markets are at record highs. Many property markets are at record highs. This makes gold which is remains nearly 33% below its record high very attractive from a hedging and diversification perspective.


Real diversification through owning allocated and segregated gold not dependent on third party websites and technology remains essential.


The old Wall Street adage to always keep 10% of your wealth in gold and hope that it does not work remains prudent.


Lets hope for the best but be prepared for less benign financial scenarios...


Gold and Silver Bullion - News and Commentary


Gold steady, on track for first monthly loss in three (Reuters.com)


Dollar Pressured After Strong Week; Bonds Advance: Markets Wrap (Bloomberg)


India May Have a Spot Gold Exchange in 12 to 18 Months (Bloomberg)


Gold rebounds from 6-week low as dollar drops (Reuters.com)


U.S. trade deficit shrinks in August, but the gap has widened in 2017 (Marketwatch)


 Source: Zerohedge


Gold and cash reign as U.S. fund investors sell stocks: Lipper (Reuters)


Is This The Real Driver Of Gold"s Recent Weakness? (Zerohedge)


Here’s what this “old school” investor thinks of bitcoin… (Stansberry CH)


You"re Likely A Lot Less Prepared For Crisis Than You Realize (Peak Prosperity)


Rickards Warns "Cracks In The Dollar Are Getting Larger" (Zerohedge)


Gold Prices (LBMA AM)


29 Sep: USD 1,286.95, GBP 963.15 & EUR 1,090.82 per ounce
28 Sep: USD 1,284.30, GBP 961.04 & EUR 1,091.40 per ounce
27 Sep: USD 1,291.30, GBP 963.83 & EUR 1,099.54 per ounce
26 Sep: USD 1,306.90, GBP 969.59 & EUR 1,105.38 per ounce
25 Sep: USD 1,295.50, GBP 957.89 & EUR 1,089.26 per ounce
22 Sep: USD 1,297.00, GBP 956.15 & EUR 1,082.09 per ounce
21 Sep: USD 1,297.35, GBP 960.56 & EUR 1,089.00 per ounce


Silver Prices (LBMA)


29 Sep: USD 16.86, GBP 12.60 & EUR 14.27 per ounce
28 Sep: USD 16.82, GBP 12.53 & EUR 14.28 per ounce
27 Sep: USD 16.89, GBP 12.58 & EUR 14.38 per ounce
26 Sep: USD 17.01, GBP 12.67 & EUR 14.43 per ounce
25 Sep: USD 16.95, GBP 12.57 & EUR 14.27 per ounce
22 Sep: USD 16.97, GBP 12.52 & EUR 14.18 per ounce
21 Sep: USD 16.95, GBP 12.58 & EUR 14.24 per ounce


Recent Market Updates


- Gold Standard Resulted In “Fewer Catastrophes” – FT
- Financial Advice From Man Who Made $1+ Billion in 1929 – Importance Of Being Patient and “Sitting”
- “Gold prices to reach $1,400 before the end of the year” – GoldCore
- Commodities King Gartman Says Gold Soon Reach $1,400 As Drums of War Grow Louder
- Bitcoin “Is A Bubble” but Gold Is Money Says World’s Biggest Hedge Fund Manager
- Pensions and Debt Time Bomb In UK: £1 Trillion Crisis Looms
- Gold Investment “Compelling” As Fed May “Kill The Business Cycle”
- “This Is Where The Next Financial Crisis Will Come From” – Deutsche Bank
- Global Debt Bubble Understated By $13 Trillion Warn BIS
- Bitcoin Price Falls 40% In 3 Days Underlining Gold’s Safe Haven Credentials
- Gold Up, Markets Fatigued As War Talk Boils Over
- Oil Rich Venezuela Stops Accepting Dollars
- Massive Equifax Hack Shows Cyber Risk to Deposits and Investments Today

Saturday, July 1, 2017

Wall Street Strategists Forecast Most-Bearish Second Half Since 1999

Despite a hiccup in the last week or so, global stocks survived as the best-performing asset class of the year (with the MSCI All-Country World Index wrapping up its best first half in 19 years)...


But, as Bloomberg reports, Wall Street strategists are fighting historic odds when urging investors not to chase the rally in the U.S. stock market.


They’re predicting the S&P 500 Index will see momentum fade in the second half after shares climbed 8.2 percent for the best first-half performance since 2013.


The average year-end prediction, 2,439, represents a 0.6 percent increase by December, the least bullish forecast at this time of year since 1999, data compiled by Bloomberg show.


Among the 20 strategists surveyed by Bloomberg, stretched valuations and decelerating profit growth are often cited as reasons for caution. Yet stocks have shrugged off everything from monetary tightening to oil’s slump to drama at the White House, surging past Wall Street forecasts that at the start of the year were the least bullish in more than a decade.


Of course there are always those who remain serial extrapolators...


Laszlo Birinyi, a steadfast bull during the eight-year equity rally, said the prevailing caution among strategists is one reason why he’s optimistic. The president of Birinyi Associates Inc. recently said his firm would buy calls betting on the S&P 500 to reach 2,500 by September.


“Wall Street continues to be unenthusiastic regarding the market,” Birinyi wrote to his clients this week. “New highs are generally greeted with a yawn. Especially encouraging is the fact that investors have cash,” he said. “As the year proceeds, we are actually feeling better about the market.”


Others are sticking to bearish calls.


Tom Lee, Fundstrat Global Advisors co-founder who’s the most bearish with a prediction of 2,275, last week slashed his S&P 500 earnings forecasts for this year and next, citing weaker inflation, rising labor costs and a delay in President Trump’s growth agenda.


And while VIX just had its biggest intraday surge since last year’s Brexit vote result, it just posted its second quarterly decline, with a 7.5% drop. The VIX came within 5% of its record low earlier in June and averaged 11.4 in the past three months, the lowest quarterly average since 2006.


And it is not just US equities that are concerning, the cost to hedge against European stock swings just saw its biggest monthly surge since January 2016.


The VStoxx Index jumped 21 percent in June, reaching its highest level since before the French election in April. The Euro Stoxx 50 Index is poised for a quarterly decline on growing speculation the region’s central banks will tighten policy -- something that would likely trigger market turmoil in the medium term, JPMorgan said.


Of course Wall Street strategists aren"t alone in their skepticism of US equity exuberance...


"Transitory"

Wednesday, June 7, 2017

Trader Warns ECB "It's Strange Optics To Bail-In A Bank One Day & Hike The Next"

We used to think of forward guidance as an important, long-term, device in the central bank tool box. As Bloomberg"s Richard Breslow explains It was meant to direct investor, business and consumer behavior through the vicissitudes and noise created by what seem seminal but are often random events. It was what convinced investors that buy and hold, augmented by gobbling up every dip, was a winning, and protected strategy. A way of saying, you can listen to every speech on the schedule but this is what the people that matter are telling you.


But, as Breslow details below, this is in the process of morphing into a much more tactical tool and it’s worth keeping up with the changes.


As the timing of global central bank actions diverges, it won’t always mean the same thing at the same time to everyone.


For years we were meant to understand that low, lower, lowest rates was where we were going and staying. That was easy. No one had to do anything. Then it changed to yes, but not forever, a message skewed by Chairman Bernanke’s initial missteps. Eventually that became we’re making a change. But we all knew their bluff could be called easily.


We’ve entered the latest iteration and it’s going to require actually paying attention. They want to tell you exactly what they intend right now. It means they’re unlikely to be dissuaded from their message absent truly exigent circumstances.


For good reason, we’ve gotten used to taking everything with a grain of salt. It’s probably better to err now on giving them a serious dose of the benefit of the doubt. Of course, if you believe you’re a better forecaster than they are, make your own assumptions and bets. This is a very healthy development.


Which brings us to today, the eve of what’s being taken as quite an important ECB meeting. Will they signal the beginning of the end of their aggressive quantitative easing reign? Lo and behold, Bloomberg News just reported that the economics staff will be proposing lowering inflation forecasts right through 2019. And, yes, the market reacted. Even though it’s said to be the result of lower oil prices. Which should, if you think about it, be laughable.


Brent crude was $57 a couple of months ago. Today it sits just under $50. It gyrates, it flies around, it’s largely unpredictable, and they’re tearing up the playbook on it? Not hardly. They’re giving their latest iteration of tactical forward guidance and have found a plausibly deniable way to do it. And the Germans have to acknowledge the fact even while muttering “Verdammt, foiled again.”


It’s just that it’s not the time to upset the apple cart, no matter that the numbers have been getting better. You have to admit that it’s strange optics to bail out a bank one day and hike the next.


But while they’ve probably signaled their short-term intention, you’re free to make your own forecasts for the fall. Watching how markets react is relevant.


The euro sold off on the news, but has so far held 1.12 to the dollar, an important pivot. Euro Stoxx 50 futures jumped, as equities are apt to do on such news, but stalled out at the quite useful 21-day moving average. Another pivot. Bund yields are slightly lower but closed the gap left on April 24 after the French election, settling at another important level at 25 basis points.


And of course, as Breslow concludes, for all those US investors so comfortable buying FANG stocks while looking across the pond - Europe isn’t an island. What goes on elsewhere will have big effects on these assets, as well.


Thursday, May 18, 2017

US Volatility Spikes To 21-Month Highs (Relative To Europe)

Today"s sudden "Minsky Moment" in markets has pushed US equity risk perceptions to their highest relative to Europe since August 2015, back to old "norms".


As Bloomberg notes, U.S. politics are taking center stage as risks recede in Europe following the French presidential election. With Donald Trump facing the deepest crisis of his presidency, the CBOE Volatility Index surged on Wednesday, while Europe’s VStoxx Index rose less than 5 percent.


Volatility expectations for the S&P 500 Index are near their highest since August 2015 relative to the Euro Stoxx 50 Index.


And it is starting at the short-end of the VIX curve (i.e. this is systemic and not an event-timing risk issue).


And has pushed Equity risk back to its old pre-Trump "norms" against bond risk...


Monday, May 15, 2017

Too Far, Too Fast? Strategists Expect European Stocks To Tumble By Year-End

Equity strategists are cooling on the prospects for further gains in European stocks just as investors poured a record amount of money into the region’s equity funds...


After a French election victory for centrist Emmanuel Macron and analysts suggesting that optimism over better profits is largely priced in, forecasters now see fewer triggers for the rally to continue in 2017.


Equity strategists, “having been torched for their prior optimism in the past, might be cautious in continuing to call Europe up after a very good run,” saidMichael Ingram, a market strategist at BGC Partners in London.


“It’s difficult to identify any near-term catalysts for continued outperformance as most of the political tripwires appear to have been negotiated, easy monetary policy is priced in and the European earnings season is essentially done.”


As Bloomberg reports, the Euro Stoxx 50 Index of the biggest euro-area stocks will finish the year at 3,498, 3.8 percent lower than Friday’s close, according to the average in asurvey of 15 banks compiled by Bloomberg. For the Stoxx 600, nine banks expect the gauge to end the year 2.4 percent lower than Friday’s level, a mean of their predictions shows.

Sunday, March 26, 2017

Hedge Fund CIO: "The Market Doesn’t Care About Health Care. Poor People Care About Health Care"

From Eric Peters, CIO of One River Asset Management, here is a topical anecdote, as well as a review of the key events in the past week.


Weekend Notes


“Where’s the beef?” bellowed Biggie Too. “Health care, regulation reform, tax cuts – where’s it at?” continued the Chief Global Strategist for one of those too big to fail affairs.


“You boys were always gonna face this moment,” barked Biggie, sliding into a slow groove.


“But here’s the thing brotha. The market doesn’t care about health care - you know that. Poor people care about health care. And the market doesn’t care about poor people. No one cares about poor people.” Biggie nodded, smiled, a big golden smile.


And pulled out a roll; crisp $100 notes. “The market only cares about taxes, regulations baby. It’s all about the Benjamins.”


Overall:


  • “You cannot spend all the money on drinks and women, then ask for help,” said some Dutch dude with an utterly unpronounceable name, trying on a little Trump, just to see how it feels to call it as you see it. “Dijsselbloem lost a great opportunity to be quiet,” responded Italy’s failed former prime minister Renzi. “Dijsselbloem’s European vision is evident in the union’s policies: a presumed economic, moral and even cultural superiority coming from northern countries, to the detriment of the South,” announced the Five Star Movement, memories of Berlusconi’s Bunga Bunga parties echoing off the ruins of Caligula’s castle.

  • “It’s worth bearing in mind that the UK helped restructure Germany’s post-war debts at the 1953 London conference,” said Sir Bill Cash, presiding over the EU Exit Committee, reminding Europeans of the devastation inflicted by Germany. You see, Sir Cash wants nothing of the E60bln Brexit bill. “It might be worth tactfully reminding people - not one of my strongest points - that there’s a realistic position here that we don’t really owe anything to the EU,” concluded Cash, Europe’s endless war with itself always a scratch below the surface.

  • The European Central Bank urged Brussels to toughen sanction procedures against governments who persistently fall foul of its economic rules, as over 90 per cent of its reform recommendations had been ignored by member states last year.

  • “If they weren’t ashamed, they would revive the gas chambers,” said Turkish President Erdogan, referring to the Dutch and Germans for their opposition to his revival of the Ottomon Empire. “Turks in Europe should have five children, not three, because you are the future,” ordered Erdogan, fanning the Far Right’s anti-Islam flames. And in America, the Republican majority refused to deny 24mm poor people health care. Then moved on to our only real problems, like over-regulation and complex taxation.

Week-in-Review (expressed in YoY terms):


Mon: May to trigger Article 50 on Mar 29th, German PPI +3.1% (5yr high), Macron takes lead in 1st round poll with 25.5% (Le Pen 25.0%), Comey testifies on Russia links to Trump (discredits Trump claims of Obama wiretapping and other conspiracy theories), S&P -0.2%; Tue: Japan sovereign CDS hits 2008 lows (45bps), RBA warns of housing market froth, Macron performs well in debate (Le Pen shows poorly), UK CPI +2.3% (3.5yr high), UK home prices +6.2%, US Q4 current account deficit -0.1 to 2.4%, fears rise that Trump running into legislative obstacles, Trump record low 37% approval rating (58% disapproval), small-cap stocks surrender 2017 gains, S&P -1.2% (largest fall since Oct); Wed: Chinese banks ordered to rein in home loan growth (iron ore -6%), Japan exports +11.7% (+28.2% to China, +0.4% to US) imports +1.2%, UK terror attack (4 dead), EU current account surplus 15mth low, US oil stocks jump (imports surge), existing home sales slow (limited supply, high prices), S&P +0.2%; Thur: EU banks borrow E223bln from TLTRO, UK retail sales +3.7% (online +20.7%), Fed’s Williams “3-4 rate hikes make sense in 2017,” new home sales rise most since July, unemployment claims +15k to 258k (highest since Jan), S&P -0.1%; Fri: Japan PMI -0.7 to 52.6, Egypt’s Hosni Mubarak released, Russia cuts 25bps to 9.75% (1st cut in 7mths), EU PMIs hit 6yr high, Le Pen meets Putin and says “Russia will not interfere in French elections,” Pope Francis urges Europe to “show solidarity” as the antidote to populism, Portuguese budget deficit 40yr low of 2.1%, US drillers wkly rig count +21 to 652 (vs 372 last March), US M&A deals -21% vs Feb 2016, Trump approves Keystone pipeline, Republicans abandon healthcare vote (Trump moves on to tax reform), VIX index jumps to 2017 high of 14.16 (settled 12.96), Mnuchin “Tax reform much simpler than healthcare,” durable goods orders rise, S&P -0.1%; Sat: 60th anniversary for the EU.


Weekly Close:


S&P 500 -1.4% and VIX +1.68 at +12.96. Nikkei -1.3%, Shanghai +1.0%, Euro Stoxx -0.5%, Bovespa -0.6%, MSCI World -1.0%, and MSCI Emerging +0.2%. USD rose +1.0% vs Australia, +0.6% vs Brazil, and +0.2% vs Canada. USD fell -1.6% vs Mexico, -1.3% vs Yen, -0.8% vs Turkey, -0.7% vs Sterling, -0.6% vs Euro, -0.5% vs Russia, -0.3% vs China, -0.3% vs Chile, -0.1% vs Indonesia, and -0.1% vs India. Gold +1.3%, Silver +2.0%, Oil -2.3%, Copper -1.8%, Iron Ore -7.9%, Corn -3.3%. 5y5y inflation swaps (EU -3bps at 1.65%, US -2bps at 2.39%, JP flat at 0.49%, and UK +8bps at 3.51%). 2yr Notes -6bps at 1.26% and 10yr Notes -9bps at 2.42%.


YTD Equity Indexes:


Poland +20.9% priced in US dollars (+14.1% priced in zloty), Argentina +18.9% in dollars (+16.5% in pesos), Mexico +18.1% (+7.5%), Chile +16.5% (+14.7%), Korea +15.9% (+7.0%), India +15.6% (+11.3%), Taiwan +14.3% (+7.0%), Spain +12.9% (+10.2%), Singapore +12.9% (+9.1%), Turkey +12.9% (+15.7%), South Africa +12.3% (+1.7%), Austria +10.7% (+8.1%), Brazil +10.7% (+6.0%), HK +10.5% (+10.7%), Czech Republic +9.2% (+6.6%), Netherlands +8.4% (+5.9%), NASDAQ +8.3% (+8.3%), Malaysia +7.8% (+6.3%), Germany +7.6% (+5.1%), Switzerland +7.6% (+4.8%), Italy +7.5% (+5.0%), Sweden +7.4% (+4.1%), Australia +7.2% (+1.5%), Euro Stoxx 50 +7.2% (+4.7%), Indonesia +6.9% (+5.1%), Belgium +6.4% (+3.9%), China +6.2% (+5.3%), Japan +6.0% (+0.8%), Thailand +5.9% (+2.0%), France +5.8% (+3.3%), Finland +5.0% (+2.5%), Philippines +4.9% (+6.3%), Denmark +4.7% (+2.3%), S&P 500 +4.7% (+4.7%), New Zealand +4.1% (+2.8%), UK +4.0% (+2.7%), Israel +4.0% (-1.3%), Ireland +3.9% (+1.5%), Portugal +3.9% (+1.4%), Colombia +3.3% (-0.4%), Hungary +2.4% (+0.3%), Norway +2.4% (+0.8%), Canada +1.6% (+1.0%), Greece +1.2% (-1.2%), Russell -0.2% (-0.2%), UAE -1.1% (-1.1%), Russia -1.9% (-8.6%), and Saudi Arabia -4.5% (-4.6%).

Monday, March 20, 2017

Credit Suisse "Climbs The Wall Of Worry", Raises S&P Target To 2,500 From 2,350

Following bearish reports from Goldman (which tactically downgraded stocks to Neutral for the next three months just hours before the Fed rate hike), RBC and JPM"s head quant Marko Kolanovic over the past week, overnight Credit Suisse decided to take the other side of the trade and hiked its year end forecasts for the S&P500, and pretty much every other risk asset, noting that it is happy to "climb the wall of worry", and prefers equities to bonds. The reason for the Swiss bank"s optimism, as strategist Andrew Garthwaite explains, is that "following the reaching of our mid-year S&P 500 target, we raise both our mid-year and year-end S&P targets to 2,400 and 2,500, respectively (from 2,350 and 2,300)." He adds that "our clear-cut view is that investors should be overweight equities versus bonds and credit. We now see less chance of a second-half correction in equities and thus raise our mid-year and year-end targets to 2,400 and 2,500, from 2,350 and 2,300, respectively. We stick to our mid-year targets of 3,500 on Euro Stoxx 50 and 20,500 on Nikkei 225."


In terms of near-terms moves, CS - unlike Goldman - sees "a clear-cut risk that we get an overshoot to the upside in equities that then reverses later on; more realistically, this reversal is likely to be a very late-2017 or 2018 event."


Some more details behind the bank"s revised targets:


"We leave our mid-year targets on the Euro Stoxx 50 and the Nikkei 225 in place at 3,500 and 20,500, respectively, but on the back of the change to our S&P 500 target, we also increase our year-end targets for the Euro Stoxx 50, the FTSE 100 and Nikkei 225 up to 3,700, 7,500 and 21,000, respectively (from 3,450, 7,000 and 19,800). We also revise our FTSE 100 mid-year target to 7,400 from 7,100."


Where does this optimism come from:


The big-picture positives: (i) US wage growth has been more muted than expected, making us believe the unemployment rate consistent with full employment is probably 4.2%, not 4.8%. This is critical because cycles peak when unemployment is 50-100bps below NAIRU; (ii) for the first time in 30 years the five-year risk-adjusted return of equities is better than that for bonds and realised equity volatility is now below that of bonds; this should encourage a bond for equity switch yet equity inflows are still below 2013 peak levels; (iii) earnings revisions remain positive (we raise our US EPS growth forecast to 8.7% from 6%); (iv) we think inflation expectations will rise closer to 3% (2.2% currently) and equities do not de-rate until inflation rises above 3%; (v) above all, equities remain the least expensive major asset class: the ERP is 5.4% vs warranted of 4.1%; and (vi) excess liquidity is consistent with re-rating.


The tactical issues that don"t worry us: (i) lead indicators are peaking (but c71% of the time on a 3-month view the S&P can rise); (ii) some sentiment indicators are becoming excessive (e.g. bull-bear/insider selling, but our aggregate measure isn"t); and (iii) the market has typically risen c5% in the 6 months after the third Fed rate hike.


Unlike other banks, CS does not an imminent market peak:


We see few of the catalysts for a major market peak: Prior to most market peaks (c.90% of the time), credit spreads widen, for an average of 7 months (they have widened marginally in the US, but not in Europe). Otherwise, the catalysts have been one of: very clear overvaluation (average ERP at peak of 2.5%); over-investment; equities peak 4 months ahead of a recession; negative earnings revisions; high retail inflows; talk of a "new paradigm"; and a sharp narrowing of breadth.


But before CS clients rush to buy up another several billion in SPY ETFs, Garthwaite makes the following cutious notes:


Two events that could make us turn negative: (i) if the unemployment rate falls 50-100bps below NAIRU and wage growth rises above 3%. This increasingly looks like a 2018 event; and (ii) if the 10-year UST yield rises to 3.0-3.5%. We think we are in the late stages of the bull market, so ultimately most of the rise in the next year would reverse into the next bear market.


Credit Suisse also notes the following tactical indicators we do worry about and that require close monitoring:


1. Non-financial cyclicals have started to underperform defensives, even as the bond yield has:


The ratio of US cyclicals to defensives has started to roll over from extended levels, even as bond yields have risen. Looking at all the significant cyclical-to-defensive peaks since 2004, it is notable that a peak in cyclicals and defensives has 83% of the time led to a local peak in the S&P within a month. This time, since the peak in cyclicals a month ago, the S&P 500 is up 3%. For a list of all recent peaks in cyclical and  defensives and the following reaction in the S&P, please see Appendix 2.


While this is slightly worrying, we would highlight that we still believe that bond yields will rise further (as discussed at the end of this report). We think this should allow banks to outperform, and potentially take over market leadership from non-financial cyclicals (banks constitute 11.9% and 6.5% of European and US market cap, respectively). Banks have also – at least in Europe – lagged the performance of non-financial cyclicals and been able to outperform in the past month while non-financial cyclicals have been underperforming.


2. Corporate net buying is slowing down


From a fund flow perspective and an earnings perspective, corporate buying has been a very substantial support for equities; corporates have been the biggest buyers since 2012 and, according to data from Credit Suisse HOLT®, buybacks have accounted for a third of EPS growth in the US.


Buyback activity appears to be slowing. The 13-week moving average is close to a sevenyear low, at the same time as buyback as a style is once again underperforming. This is also coming at a time when corporate leverage is on some measures back to previous peaks.


This doesn"t worry us too much because: First, as stressed later on, we find that even after capital spending, buybacks and dividends, the US market is still cash flow positive and the earnings yield of the S&P is still around 90bps above the BAA corporate bond yield. Second, while leverage has picked up, there are still pockets of firepower for the corporate sector. For example, according to data from Preqin, there is still about $1.4trn of private equity dry powder and some $800bn of cash (pre tax) could be repatriated into the US following corporate tax reform.


3. High speculative positions in oil, and oil being correlated to reflation


The oil price has recently experienced a sharp correction lower, and this comes at a time when speculators are very long, as we can see below. When speculators are long and speculative positions fall – which we would expect to be the case given the nearbackwardation in the 2-year section of the futures curve – the oil price tends to fall too. Historically, a decline in the oil price has been a negative for equities, and in general the reflation trade. However, we note the relationship between the price of oil and the stock market is not stable and the correlation, which was strongly positive throughout 2016, has recently started to fall.


For now, however, according to CS these are the key "tactical issues to focus on:"


(i) corporate net buying slowing and buybacks as a style underperforming (but FCF after dividends and buybacks is still positive); (ii) speculators are very long oil while the market has been moving against them, and the oil price has had a strong correlation over the past two years with risk assets (but our house view is $62pb by year-end and the correlation between equities and oil has started to fall); and (iii) cyclicals underperforming, which leads to the S&P 500 falling c73% of the time in the next 3 months (though it has not done so in the past month).


For now, however, have no fear as Credit Suisse will promptly advise its clients when to sell.

Wednesday, February 15, 2017

As Le Pen Odds Surge; French Stock Market Risk Hits 5-Year High, Credit Risk Spikes

Marine Le Pen"s French election victory odds reached their highest level of the campaign overnight and it appears global investors are starting to panic-bid protection against the consequences for French stocks...


Oddschecker indicates Le Pen"s incessant rise in popularity...


And as Bloomberg notes, as the French prepare to choose their next president, investors are paying up to hedge against swings in the nation’s shares.


The cost of three-month options on the CAC 40 Index has rallied to a five-year high relative to those on the regional Euro Stoxx 50 Index.


The first round of elections will be on April 23 and the second on May 7... one wonders how much higher this "relative" risk can go before it spills over into something systemic... because French credit risk is now at its highest in 4 years...


Friday, January 20, 2017

"Take Advantage Of Uncertainty While It Lasts" - Trader Warns "No One 'Knows' Anything At The Moment"

There’s a big disconnect for traders. Everyone keeps telling Bloomberg"s Richard Breslow that there"s so much uncertainty out there that it"s too dangerous to trade. They also assume every time we get yet another flailing gyration in a given day’s price action that someone knows something -- and it’s big.


The truth is, no one knows anything at the moment. There are enormous uncertainties on every continent and where the ball stops bouncing is anybody’s guess. And your guess is as good as the next guy’s.


The irony is, while we have been ascribing tremendous insight as the cause of every random walk, there has been the simultaneous dismissal of those who might actually have an idea. Or affect outcomes. It’s a characteristic of our times to more heavily discount what experts are saying, but you can take it too far.


The weird and unintuitive truth is since the beginning of this year the deafening roar of investors’ fear of being wrong has drowned out the fact that nothing is going on. Everyone is psyching themselves out instead of trading.


And it’s a shame because given the enormity of the potential news-set down the road, this might be one of those times where it’s easier to trade the rumor rather than the fact. Especially because so many of those hypothetical facts could be digital events.


Oh my God, oh my God, the pound is collapsing. No, no, it’s having its best day in years. As London staggers in this morning, GBP/USD is about 25 pips from its year-to-date average price. Which we might have seen in today’s trading if the range wasn’t so small.


Trump trades have collapsed? Not yet. The 10-year U.S. Treasury yield is set to debut in Europe today a mere two basis points from its YTD average.


The S&P 500, Euro Stoxx 50 and Topix indices are all within touching distance of their average price. And on and on. Big daily volatility, signifying nothing used to be trading desks’ bread-and-butter.


Janet Yellen hedged herself pretty well yesterday. Bullish on the economy, unwilling to commit to anything. Yesterday’s ECB meeting saw Draghi say as little as possible. Why? Because they are uncertain. Start using this to your advantage.