Showing posts with label Dallas Fed. Show all posts

Sunday, December 3, 2017

Blow.Off.Top.

Authored by Sven Henrich via NorthmanTrader.com,


No period is worse for bears than when it’s the best time to sell stocks. It’s the polar opposite of when conditions are worst for bulls, right when it’s the best time to buy as it was in January-March 2009. The exhaustion factor is enormous. It’s called capitulation as moves get stretched to the extreme even though the set-up is valid.


November’s close marked the 13th consecutive month straight up for global markets. Nothing but up with fewer and ever smaller dips in between. Deutsche Bank’s Reid illustrated the point: “We’ve never had such a run with data going back over 90yrs”. I’d say that qualifies as the worst of time for bears.


Yet we could be sitting on a generational opportunity to sell equities as it could be argued that conditions will never be better for bulls as the game of offering carrots of free money is coming to an end. Indeed it could be argued that the prospect of tax cuts is the final carrot the free money scheme has to offer. The carrot top. No more carrots.


Consider the central banking liquidity game has peaked and is dropping off:


The 2016/2017 period saw the largest amount of central bank intervention ever. Ever. Over 8 years after the financial crisis.


The slow reduction in central bank liquidity has been supplemented by record ETF inflows this year. Retail went long and continues to buy the most expensive market since 1900 according to Goldman:


Even now via @jennablan: “U.S.-based money market funds attract inflows of $33 bln in week ended nov 29, largest inflows for the year”.


And leverage has never been higher either. Via @Schuldensuehner: 


“Dow Jones Industrial closed >24k for the first time ever. Wall St record has occurred in tandem w/record margin debt. Margin debt now at $561bn, double amount of tech bubble of 2000, 47% > than in 2007”:


Retail is in and we see it in various data charts:


Via @BN:


The Rydex bull/bear allocation data shows the most bullish allocation into equities ever:


Don’t tell me it’s the most hated bull market ever. The data says otherwise.


Markets are in big time pig time mode. The prospect of imminent tax cuts keeps investor salivating and allocating cash into all time highs as markets drenched in 8 years of artificial liquidity find tax cuts to be the next carrot to push markets caps into the stratosphere:


A blow-off top perhaps setting us up us for something more sinister than a correction. What’s the biblical phrase? Forgive them for they do not know what they are doing?


Look, the tax narrative is that tax cuts will pay for themselves, that companies will hire more people as a result, and that middle class will benefit greatly from it, that GDP will swell to 4% and Trump claimed that these tax cuts will actually personally hurt himself financially. None of these things are true. Not a one. In fact everything is precisely the opposite. The math says so.


While extreme political tribalism encourages ideology over facts math is true whether you believe in it or not. And these tax cuts will add greatly to the deficits. I won’t belabor the point here as I’ve outlined my thoughts on the subject in detail in Tax Cut Scam.


The deficit will increase, many will see actual tax increases over time and/or lose benefits and the big tax cut benefits go precisely to people such as Trump and corporations already sitting on record cash positions. As far as GDP growth the FOMC doesn’t believe it either as incoming Fed Chair Powell affirmed a 2.5% GDP outlook for 2018 and many companies are on the record that they will use the extra cash for dividends and buybacks not hiring. This tax bill will exacerbate wealth inequality.


And hiring? Forget it. Structurally we’re looking at the great firing to come: 800 million people might be out of a job by 2030 because of automation


Precise numbers are to be taken with a grain of salt but it’s coming, whether you want to believe it or not.


And this perhaps is the biggest lie of the entire construct: That it’s done for the benefit of the middle class. It’s not. It’s done for wealthy donors who have threatened to cut off donations if they don’t see results. It’s big time pig time. Greed at its finest consequences be damned.


So the odds are the tax cut bill will end up passing in one form or another unless someone stands up and says they’re not voting for something that’s based on a lie.


Deficits will keep expanding before even a new recession hits. I’ve said for a long time that market levels and economic growth have been bought with debt and stimulus producing multiple expansion. See below multiple expansion in context of price and aggregate GAAP earnings:


We do not know what organic growth is without permanent intervention. That was true with the past administration and it is true with this one.


Except now we see increased in defense spending and a cutting of the revenue structure. This year’s deficit was already $666B and that’s without tax cuts. The deficit will be expanding to $900B by 2019 according to JPMorgan.


Even Janet Yellen felt compelled to comment on the debt:


“I would simply say that I am very worried about the sustainability of the U.S. debt trajectory,” Yellen said.


“It’s the type of thing that should keep people awake at night,” she added.”


Cute, especially coming from her who was a key contributor to the easy money train. The context is glaringly obvious:


But Janet Yellen is not alone in suddenly getting concerned about the sustainability of debt expansion.


Dallas Fed president Kaplan came out this week and basically highlighted many of the concerns I’ve been talking about for a long time. A shockingly rare admission of the truth. Quite a statement:


“As a central banker, I want to be vigilant to imbalances and distortions that can build as a result of accommodative monetary policy. I have argued that monetary policy accommodation is not “free” —there are costs to accommodation in the form of distortions and imbalances in consumer decisions as well as in investing, hiring and other business decisions. More specifically, experience suggests that the greater the overshoot of full employment, the more difficult it is to unwind imbalances when growth ultimately slows—as it certainly must.


When excesses ultimately need to be unwound, this can result in a sudden downward shift in demand for investment and consumer-related durable goods. There are surprisingly few historical examples of “soft landings” in cases where employment has risen above its maximum sustainable level.


It is of course possible that “this time will be different,” but as I assess the condition of the U.S. economy, I am carefully monitoring evidence that might suggest growing risks of real imbalances, which could threaten the sustainability of the current economic expansion. For example, the headline unemployment rate has fallen by 70 basis points over the past year, nearly matching the average rate of decline over the prior seven years of the expansion. If this rate of decline continues, this will further tighten labor market conditions and would likely add to excesses and imbalances accumulating in the economy.


Excesses can also manifest themselves in financial imbalances. While I would prefer to rely primarily on macroprudential policy tools to manage financial imbalances, I am nevertheless monitoring various measures of potential financial excess. I monitor these and other market measures because I am aware that, as excesses build, we are more vulnerable to reversals which have the potential to cause a rapid tightening in financial conditions, which in turn, can lead to a slowing in economic activity. Examples of potential excesses might include:


  • The U.S. stock market capitalization now stands at approximately 135 percent of GDP, the highest since 1999/2000.[3]Correspondingly, commercial real estate cap rates and valuation measures of debt and other markets appear notably extended.

  • Measures of stock market volatility are historically low.[4] We have now gone 12 months without a 3 percent correction in the U.S. market.[5] This is extraordinarily unusual.

  • While household debt to GDP has improved over the past eight years, corporate debt is now at record highs.[6] I am not overly concerned about current levels of corporate debt because, importantly, financial sector leverage has declined substantially since the Great Recession. However, U.S. government debt now stands at approximately 75 percent of GDP,[7] and the present value of unfunded entitlements now stands at approximately $49 trillion.[8] In my view, the projected path of U.S. government debt to GDP is unlikely to be sustainable—and has been made to appear more manageable due to today’s historically low interest rates.

  • Debt and equity securities trading volumes have markedly declined over the past several years. For example, NYSE equity trading volume on average for 2017 is down 51 percent from 2007 levels, while the NYSE market cap has increased 28 percent over the same time period.[9] I would also note that margin debt is now at record-high levels.[10] In the event of a sell-off, high levels of margin debt can encourage additional selling, which could, in turn, lead to a more rapid tightening of financial conditions. Sufficient market trading liquidity is key to managing the resulting increased volume. I am cognizant that lower trading volumes may be due, in part, to low levels of market volatility and may also be due to regulations such as the Volcker rule.”

So he’s watching markets closely and looking at some of the very same trends and factors we are.


In essence he is affirming one of the key cornerstones of the bear case: We are late in the cycle and low unemployment is not sustainable:


Again:  “There are surprisingly few historical examples of “soft landings” in cases where employment has risen above its maximum sustainable level”.


And neither is the debt build up and he knows it just like Yellen: “In my view, the projected path of U.S. government debt to GDP is unlikely to be sustainable —and has been made to appear more manageable due to today’s historically low interest rates”.


The chart above outlines the argument I’ve been making for a long time. This hyper bull market has not only been enabled by low rates but is the end product. Low rates enabled unprecedented debt expansion. And without low rates it can’t be sustained.


In this context then the concern is what happens if the 10 year were to rise above its 30 year trend line. Note the 2 most recent market tops came at a time when the 10 year was approaching its upper trend line. It is doing so again now.


And it’s doing it in context of a flattening yield curve:


The Fed is paying attention and it’s very concerned:


“Federal Reserve Bank of St. Louis President James Bullard on Friday warned that more rate increases by the central bank would raise the risk the U.S. economy could fall into recession.”


The key question: How sensitive is the entire construct to rising rates in context of record debt. The macro charts I keep tracking suggest stress building underneath.


And so the question then becomes not if it unwinds, but when and from where.


Morgan Stanley came out this week and raised its own concerns:


“An unprecedented central bank unwind… We think there is way too much complacency regarding what is a notable and growing shift in central bank policy globally. Remember, monetary policy has been massive in this cycle, and extremely supportive for credit markets. The Fed is now tightening in an untested way, through the balance sheet, while also pushing rates near restrictive territory. Markets expect a seamless unwind. We do not.


…with markets late cycle, and very dependent on ultra-easy liquidity… It is not a coincidence that fundamental problems are becoming more apparent in one sector after the next, as the Fed withdraws liquidity. In fact, we see late-cycle risks popping up all over the place, and as is often the case near a top, these risks are mistakenly (we think) being rationalized as purely ‘idiosyncratic’ problems. Defaults should remain low in 2018, but that is expected. Credit markets anticipate defaults one year ahead of time, and we think a cycle turn is closer than many believe.


…and valuations very rich: Spreads are near all-time tights, adjusting for the quality deterioration in the indices over time. Yes, the technicals have been strong, but that may change as the Fed’s balance sheet shrinks faster. We note, a recession is not necessary to see negative excess returns, especially in the second half of a cycle, and particularly late in a Fed tightening cycle. Credit markets have not experienced three straight years of positive excess returns in over 20 years.


More than anything else, we firmly believe that central banks have been THE driver of credit in this cycle, stimulating markets like never before. Now they are attempting to tighten in a completely untested way, and yet credit is pricing in a seamless unwind. At the least, we expect a bumpier 2018, with a tougher setup anyway we slice it. Growth will decelerate, while the Fed continues tightening into a low-inflation environment, driving a completely flat yield curve (per our rates forecasts). Additionally, the year is beginning with booming confidence, as hopes for tax cuts rise, thus the bar to positively surprise is high, while “Goldilocks” is firmly in the price across most risk assets.


We would not rule out the scenario in which financial conditions could tighten materially next year as the Fed withdraws stimulus in this unprecedented way, especially if growth expectations decline at the same time, pushing us from late cycle to end of cycle (though not our economists’ base case). And for those expecting the Fed to come to the rescue any time volatility picks up, remember that, with the balance sheet now effectively set on “auto-pilot,” reversing course, in our view, is a last resort.”


You may note how these comments compliment the concerns Kaplan is raising himself. All of this fits with the larger macro analysis I’ve been outlining all year.


There is a reason the Fed has been oh so careful in tinkering and hand wringing. There’s a reason the ECB and the BOJ keep printing. They all know the construct is fragile and they are all worried. They actually say so:


From the recent FOMC minutes: “They worried that a sharp reversal in asset prices could have damaging effects on the economy.”


That’s it. Asset prices are now so elevated that a correction is viewed as a clear and present danger to the global economy. It’s actually all quite simple and obvious. They’ve created a monster and are worried about pissing it off. So the entire construct is held up by low rates and there is a moment where the balance breaks. But we don’t know the when and the where although as my previous chart showed $SPX just hit its 1987 trend line this week which could make any further advances rather challenging or perhaps mark a key pivot.


Here’s the closer view:


Note this tag is coming in context of a $VIX that keeps pinging its upper trend line as it did again this week:


The monthly view via Mella:


These charts continue to signal that volatility will eventually break higher and perhaps violently so.


Now in context of $TNX and the $SPX I’ve created a ratio chart looking at the interplay between $SPX and $TNX:


Note that since the 2009 lows a trend line established itself and it was broken in 2016. Indeed in 2017 it rejected trying to recapture the trend line. Furthermore we can observe a potential right shoulder building. With a significant lower high. Why is that? Well because despite $SPX printing new highs $TNX is not printing new lows. So if $TNX breaks higher it will take massive higher market gains to avoid a break lower in the ratio. This pattern is massive and it would accelerate to the downside if markets broke lower with yields rising. In essence the scenario that Kaplan and Morgan Stanley expressed concerns about.


Bottomline: The macro analysis of the entire construct remains spot on. Central banks have created the TINA effect (there is no alternative) asset prices have become amplified via multiple expansion in lieu of any other investment alternatives and now with the prospect of tax cuts all sellers have disappeared. For now.


Markets have proven they can rally with the loosest financial conditions in this cycle along with continued M1 money supply expansion:


They have yet to prove they can do without.


But after tax cuts there are no more carrots to dangle in front of markets hence we’re finding ourselves in an environment of an imminent carrot top.


The watershed moment will come when people want to sell. How will markets handle a situation with sellers suddenly appearing? Nobody knows. But clearly the Fed is worried about it.


*  *  *


For our market products please visit Services.


Saturday, November 18, 2017

The Great Retirement Con

Authored by Adam Taggart via PeakProsperity.com,


Frankly put: retirement is now a myth for the majority...


The Origins Of The Retirement Plan


Back during the Revolutionary War, the Continental Congress promised a monthly lifetime income to soldiers who fought and survived the conflict. This guaranteed income stream, called a "pension", was again offered to soldiers in the Civil War and every American war since.


Since then, similar pension promises funded from public coffers expanded to cover retirees from other branches of government. States and cities followed suit -- extending pensions to all sorts of municipal workers ranging from policemen to politicians, teachers to trash collectors.


A pension is what"s referred to as a defined benefit plan. The payout promised a worker upon retirement is guaranteed up front according to a formula, typically dependent on salary size and years of employment.


Understandably, workers appreciated the security and dependability offered by pensions. So, as a means to attract skilled talent, the private sector started offering them, too. 


The first corporate pension was offered by the American Express Company in 1875. By the 1960s, half of all employees in the private sector were covered by a pension plan.


Off-loading Of Retirement Risk By Corporations


Once pensions had become commonplace, they were much less effective as an incentive to lure top talent. They started to feel like burdensome cost centers to companies.


As America"s corporations grew and their veteran employees started hitting retirement age, the amount of funding required to meet current and future pension funding obligations became huge. And it kept growing. Remember, the Baby Boomer generation, the largest ever by far in US history, was just entering the workforce by the 1960s.


Companies were eager to get this expanding liability off of their backs. And the more poorly-capitalized firms started defaulting on their pensions, stiffing those who had loyally worked for them.


So, it"s little surprise that the 1970s and "80s saw the introduction of personal retirement savings plans. The Individual Retirement Arrangement (IRA) was formed by the Employee Retirement Income Security Act (ERISA) in 1974. And the first 401k plan was created in 1980.


These savings vehicles are defined contribution plans. The future payout of the plan is variable (i.e., unknown today), and will be largely a function of how much of their income the worker directs into the fund over their career, as well as the market return on the fund"s investments.


Touted as a revolutionary improvement for the worker, these plans promised to give the individual power over his/her own financial destiny. No longer would it be dictated by their employer.


Your company doesn"t offer a pension? No worries: open an IRA and create your own personal pension fund.


Afraid your employer might mismanage your pension fund? A 401k removes that risk. You decide how your retirement money is invested.


Want to retire sooner? Just increase the percent of your annual income contributions.


All this sounded pretty good to workers. But it sounded GREAT to their employers.


Why? Because it transferred the burden of retirement funding away from the company and onto its employees. It allowed for the removal of a massive and fast-growing liability off of the corporate balance sheet, and materially improved the outlook for future earnings and cash flow.


As you would expect given this, corporate America moved swiftly over the next several decades to cap pension participation and transition to defined contribution plans.


The table below shows how vigorously pensions (green) have disappeared since the introduction of IRAs and 401ks (red):


(Source)


So, to recap: 40 years ago, a grand experiment was embarked upon. One that promised US workers: Using these new defined contribution vehicles, you"ll be better off when you reach retirement age.


Which raises a simple but very important question: How have things worked out?


The Ugly Aftermath


America The Broke


Well, things haven"t worked out too well.


Three decades later, what we"re realizing is that this shift from dedicated-contribution pension plans to voluntary private savings was a grand experiment with no assurances. Corporations definitely benefited, as they could redeploy capital to expansion or bottom line profits. But employees? The data certainly seems to show that the experiment did not take human nature into account enough – specifically, the fact that just because people have the option to save money for later use doesn"t mean that they actually will.


First off, not every American worker (by far) is offered a 401k or similar retirement plan through work. But of those that are, 21% choose not to participate (source).


As a result, 1 in 4 of those aged 45-64 and 22% of those 65+ have $0 in retirement savings (source). Forty-nine percent of American adults of all ages aren"t saving anything for retirement.


In 2016, the Economic Policy Institute published an excellent chartbook titled The State Of American Retirement (for those inclined to review the full set of charts on their website, it"s well worth the time). The EPI"s main conclusion from their analysis is that the switchover of the US workforce from defined-benefit pension plans to self-directed retirement savings vehicles (e..g, 401Ks and IRAs) has resulted in a sizeable drop in retirement preparedness. Retirement wealth has not grown fast enough to keep pace with our aging population.


The stats illustrated by the EPI"s charts are frightening on a mean, or average, level. For instance, for all workers 32-61, the average amount saved for retirement is less than $100,000. That"s not much to live on in the last decades of your twilight years. And that average savings is actually lower than it was back in 2007, showing that households have still yet to fully recover the wealth lost during the Great Recession.


But mean numbers are skewed by the outliers. In this case, the multi-$million households are bringing up the average pretty dramatically, making things look better than they really are. It"s when we look at the median figures that things get truly scary:


Nearly half of families have no retirement account savings at all. That makes median (50th percentile) values low for all age groups, ranging from $480 for families in their mid-30s to $17,000 for families approaching retirement in 2013. For most age groups, median account balances in 2013 were less than half their pre-recession peak and lower than at the start of the new millennium.


(Source)


The 50th percentile household aged 56-61 has only $17,000 to retire on. That"s dangerously close to the Federal poverty level income for a family of two for just a single year.


Most planners advise saving enough before retirement to maintain annual living expenses at about 70-80% of what they were during one"s income-earning years. Medicare out-of-pocket costs alone are expected to be between $240,000 and $430,000 over retirement for a 65-year-old couple retiring today.


The gap between retirement savings and living costs in one"s later years is pretty staggering:


  • Nearly 83% of retired households have less saved than Medicare costs alone will consume.

  • One-third of retired households are entirely dependent on Social Security. On average, that"s only $1,230 per month a hard income to live on. (source)

  • 34 percent of older Americans depend on credit cards to pay for basic living expenses such as mortgage payments, groceries, and utilities. (source

As for Medicare, the out-of-pocket costs could easily soar over retirement. The Wall Street Journal reports that the current estimate of Medicare"s unfunded liability now tops $42 Trillion. Such a mind-boggling gap makes it highly likely that current retirees will not receive all of the entitlements they are being promised.


And the denial being shown by baby boomers entering retirement is frightening. Many simply plan to work longer before retiring, with a growing percentage saying they plan to work "forever". 


But the data shows that declining health gives older Americans no choice but to leave the work force eventually, whether they want to or not. Years of surveys by the Employment Benefit Research Institute show that fully half of current retirees had to leave the work force sooner than desired due to health problems, disability, or layoffs.


Add to this the nefarious impact of the Federal Reserve"s prolonged 0% interest rate policy, which has made it extremely hard for retirees with fixed-income investments to generate a meaningful income from them.


The number of Americans aged 65 years and older is projected to more than double in the next 40 years:


Will the remaining body of active workers be able to support this tsunami of underfunded seniors? Don"t bet on it.


Especially since their retirement savings prospects are even more dim. With long-stagnant real wages and punishing price inflation in the cost of living, Generation X and Millennials are hard-pressed to put money away for their twilight years:


(Source)


Public Pensions: Broken Promises


And for those "lucky" folks expecting to enjoy a public pension, there"s a lot of uncertainty as to whether they"re going to receive all they"ve been promised.


Due to underfunded contributions, years of portfolio under-performance due to the Federal Reserve"s 0% interest rate policy, poor fund management, and other reasons, many of the federal and state pensions are woefully under-captialized. The below chart from former Dallas Fed advisor Danielle DiMartino-Booth shows how the total sum of unfunded public pension obligations exploded from $292 billion in 2007 to $1.9 trillion by the end of 2016:


(Source)


And the daily headlines of failing state and local pension funds (Illinois, Kentucky, New JerseyDallas, Providence -- to name but a few) show that the problem is metastasizing across the nation at an accelerating rate.


Affording Your Future


The bottom line when it comes to retirement is that you"re on your own. The vehicles and the promises you"ve been given are proving woefully insufficient to fund the "retirement" dream you"ve been sold your whole life.


That"s the bad news.


But the good news is that the dream is still attainable. There are strategies and behaviors that, if adopted now, will make it much more likely for you to be able to afford to retire -- and in a way you can enjoy.


In Part 2: Success Strategies For Retirement, we detail out these best practices for a solvent retirement, including providing 14 specific action steps you can start taking right now in your life that will materially improve your odds of enjoying your later years with grace. For far too many Americans, "retirement" will remain a perpetual myth. Don"t let that happen to you. Click here to read Part 2 of this report (free executive summary, enrollment required for full access)


Tuesday, August 29, 2017

Are You Prepared For These Potentially Disruptive Economic Storms?

Hurricane Harvey


Here in San Antonio, grocery stores were packed with families stocking up on water and canned food in preparation for Hurricane Harvey, which has devastated Houston and coastal Texas towns. I hope everyone who lives in its path took the necessary precautions to stay safe and dry—this storm was definetely one to tell your grandkids about one day.


Similarly, I hope investors have took steps to prepare for some potentially disruptive economic storms, including this past weekend’s central bank symposium in Jackson Hole, Wyoming, and the possibility of a contentious battle in Congress next month over the budget and debt ceiling.


As you’re probably aware, central bankers from all over the globe visited Jackson Hole this past weekend to discuss monetary policy, specifically the Federal Reserve’s unwinding of its $4.5 trillion balance sheet and the European Central Bank’s (ECB) ongoing quantitative easing (QE) program. Janet Yellen gave what might be her last speech as head of the Federal Reserve.


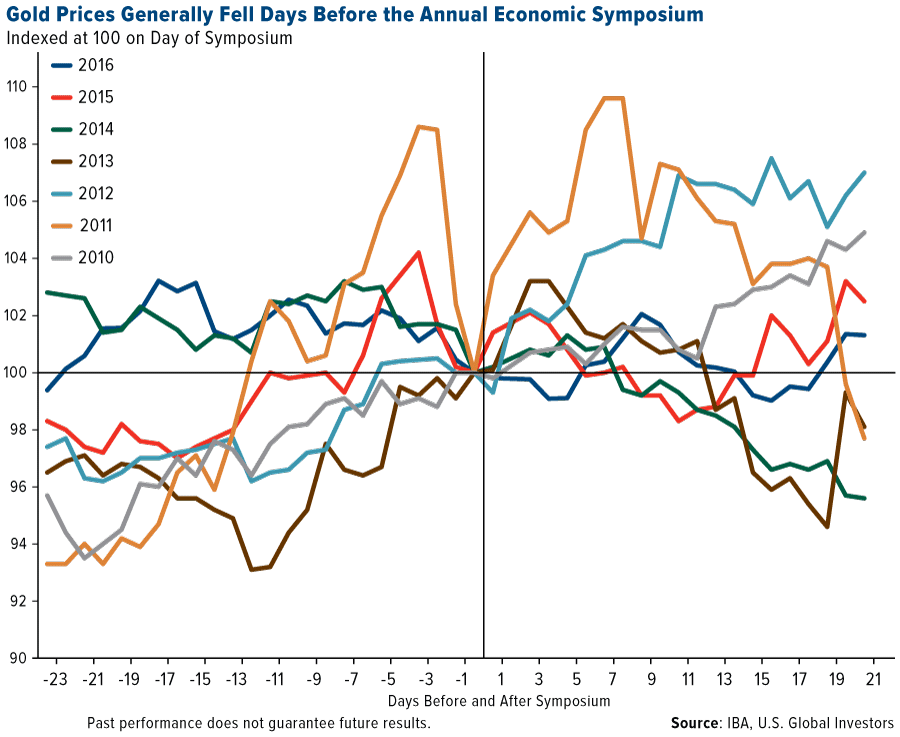
As I told Daniela Cambone on last week’s Gold Game Film, there are some gold conspiracy theorists out there who believe the yellow metal gets knocked down every year before the annual summit so the government can look good. I wouldn’t exactly put money on that trade, but you can see there’s some evidence to support the claim. In most years going back to 2010, the metal did fall in the days leading up to the summit. Gold prices fell most sharply around this time in 2011 before rocketing back up to its all-time high of more than $1,900 an ounce.


Many of the economic and political conditions that helped gold reach that level in 2011 are in effect today. That year, a similar Congressional skirmish over the debt ceiling led to Standard & Poor’s decision to lower the U.S. credit rating, from AAA to AA+, which in turn battered the dollar. The dollar’s recent weakness is similarly supporting gold prices.


In August 2011, the real, inflation-adjusted 10-year Treasury was yielding negative 0.59 percent on average, pushing investors out of government bonds and into gold. Because of low inflation, we might not be seeing negative 10-year yields right now, but the five-year is borderline while the two-year is definitely underwater. Bank of America Merrill Lynch sees gold surging to $1,400 an ounce by early next year on lower long-term U.S. interest rates.


Are Government Inflation Numbers More “Fake News”?


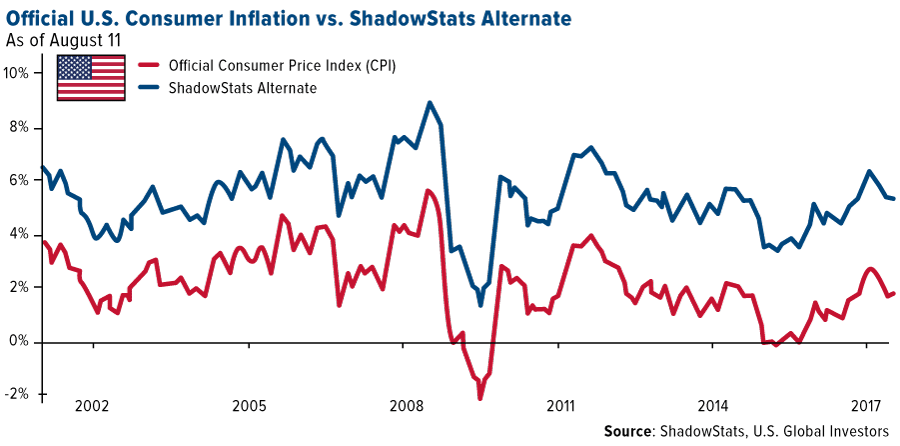
If we use another inflation measure, though, yields of all durations look very negative. For years, ShadowStats has published alternate consumer price index (CPI) figures using the methodology that was used in 1980. According to economist John Williams, an expert in government economic reporting, “methodological shifts in government reporting have depressed reported inflation” over the years. The implication is that inflation might actually be running much higher than we realize, as you can see in the chart below.


If you believe the alternate CPI numbers, it makes good sense to have exposure to gold.


Recently I shared with you that Ray Dalio—manager of Bridgewater, the world’s largest hedge fund with $150 billion in assets—was one among several big-name investors who have added to their gold weighting in recent days on heightened political risk. That includes Congress’ possible failure to raise the debt ceiling and, consequently, a government shutdown. Dalio recommends as much as a 10 percent weighting in the yellow metal, which is in line with my own recommendation of 10 percent, with 5 percent in physical gold and 5 percent in gold stocks, mutual funds and ETFs.


Falling Dollar Good for U.S. Trade


Returning to the dollar for a moment, respected CLSA equity strategist Christopher Wood writes in this week’s edition of GREED & fear that it’s “hard to believe that the political news flow in Washington has not been a factor in U.S. dollar weakness this year.”


The U.S. media certainly wants you to believe that Trump is bad for the dollar. Take a look at this chart, showing the dollar’s steady decline alongside President Donald Trump’s deteriorating favorability rating, according to a RealClearPolitics poll.


However, a weak dollar is good for America’s economy. I’ve commented before that Trump likes a falling dollar, because it is good for the country’s export trade of quality industrial products. It’s also good for commodities, which we see in a rising gold price and usually energy prices.


Ready for a Big Fight?


You might have watched the Mayweather vs. McGregor fight, but have you been watching the fight between Trump and the Fed?


At the symposium in Jackson Hole, Fed Chair Janet Yellen squared up directly against Trump when she defended the strict regulations that were put in place after the financial crisis. Echoing these comments was Dallas Fed chief Robert Kaplan. This is the opposite of what Trump has been calling for, which is the streamlining of regulations that threaten to strangle the formation of capital.


Hurricane Harvey


It’s important to recognize that the market is all about supply and demand. The number of public companies in the U.S. has been shrinking, with about half of the number of listed companies from 1996 to 2016. Readers have seen me comment on this previously, and I believe that the key reason for this shrinkage is the surge in federal regulations. The increasingly curious thing is that we are seeing the evolution of more indices than stocks, as the formation of capital must morph.


As I told CNBC Asia’s Martin Soong this week, there is a huge amount of money supply out there, and investors are looking for somewhere to invest. The smaller pool of stocks combined with the greater supply of money means that the market has seen all-time highs. In addition, major averages were regularly hitting all-time highs not necessarily on hopes that tax reform would get passed, but on strong corporate earnings, promising global economic growth and the weaker U.S. dollar.


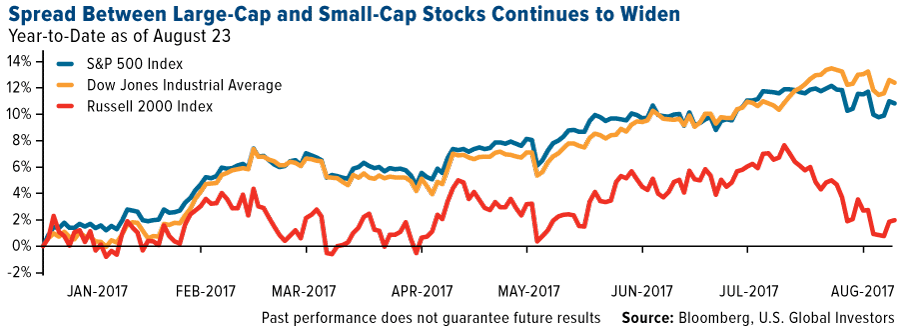
Meanwhile, small-cap stocks are effectively flat for 2017 and heading for their worst year since 1998 relative to the market, according to Bloomberg. Hedge funds’ net short positions on the Russell 2000 Index have reached levels unseen since 2009. Remember, these are the firms that were expected to be among the biggest beneficiaries of Trump’s “America first” policies.


However, the weakness in U.S. manufacturing has a great impact on the growth of these stocks, as indicated by the falling purchasing managers’ index (PMI). The slowdown in manufacturing is offset by strength in services, shown by the Flash composite PMI score of 56.0 which came out this week. Though there is a spread between large-cap and small-cap stocks, historically this strong score is an indicator of growth to come.


Some big-name investors and hedge fund managers are turning cautious on domestic equities in general. On Monday, Ray Dalio announced on LinkedIn that he was reducing his risk in U.S. marketsbecause he’s “concerned about growing internal and external conflict leading to impaired government efficiency (e.g. inabilities to pass legislation and set policies).” Pershing Square’s Bill Ackman and Pimco’s Dan Ivascyn have also recently bought protection against market unrest, according to the Financial Times. Chris Wood is overweight Asia and emerging markets.


Stay Hopeful


It’s important to keep in mind that there will always be disruptions in the market, and adjustments to your portfolio will sometimes need to be made.

Wednesday, August 23, 2017

Jackson Hole Preview: Market Reactions, And Why UBS Says "Don't Skip Lunch"

Historically the annual Jackson Hole symposium has been a major market-moving event as it has traditionally been the venue where central banks make critical announcements such as Bernanke"s preview and hints of QE2 and QE3 in 2012, as well as Draghi"s suggestion of the ECB"s QE in 2014. As shown in the chart below, market reactions following these events have been material.


This year, however, while there was a sharp build-up in expectations after several media trial balloons suggested that Draghi would unveil the ECB"s taper, the fact that the market sent the EUR just shy of 1.20 in frontrunning of this announcement, prompted the ECB head to abort the entire affair, "leaking" that no material announcement would be made this week in Wyoming after all. Which is why, in previewing potential market moves, Barclays says that "the risk for the EUR around the event is biased to the downside, and that EUR bulls might be disappointed by a lack of meaningful hints on ECB monetary policy normalisation."


ING is quick to take the fun out of this week"s annual meeting: "this year"s major speakers, Fed Chair Janet Yellen and the ECB President Mario Draghi, are likely to keep their cards close to their chest. Both speeches are likely to be fairly "high level" and lack any major hints about future policy."


As Deutsche Bank"s Jim Reid echoes, "there might be a few less nerves about the next few days in markets than many felt a few weeks ago. Back then, Thursday"s commencement of the annual Jackson Hole Symposium seemed to be a natural place for Mr Draghi to signal that exit from QE was soon to be accelerated. However a combination of still soft global inflation data and the Euro"s recent ascent has made it unlikely that the event will be a watershed moment. Expect him to be upbeat on the economy but the hawkish/dovishness indicator might be swayed one way or the other on how much attention the Euro gets in his remarks."


What about the Fed side of things? Here, according to UBS there will be nothing of market-moving either, and as the bank"s economist Seth Carpenter writes "Don"t expect news at Jackson Hole. Chair Yellen has told us what she wants to about normalization, for now. Financial stability matters, but it isn"t new" and as such it will be "nothing to skip lunch over."  Carpenter elaborates that "the annual Jackson Hole Symposium features Chair Yellen on Friday speaking on "Financial Stability." The conference has in recent years been a venue for big news in monetary policy, but this time around it is likely to be undramatic. We expect the Chair"s speech to keep to well-trod financial stability topics—some excesses may exist, but the system is safe—and eschew discussion of potential near-term policy actions."


Deutsche Bank is a little less sanguine:


Our Fixed Income Strategists now actually think that the Fed could be more important at Jackson Hole. The running theme of this year’s symposium is “Fostering a Dynamic Global Economy” and the full line up of speakers and presentations will be released at 4PM EST on Thursday. Mrs Yellen will be speaking Friday morning at 10AM EST on financial stability. Our strategists noted that in the US there is a tension between softer inflation and easy financial conditions and given the topic of Yellen"s speech is "financial stability" she may lean towards prioritising one side or the other. Overall the market will probably be most sensitive as to whether a December hike is more or less likely after her comments. The imminent halting of reinvestment seems to be considered a fine deal."


But why is UBS convinced that Friday"s events (a full logisitcal breakdown is below) will be a snooze fest? Here is the explanation"


The FOMC has told us what they want us to know on monetary policy


The FOMC has increased its communication and transparency about the normalization of its balance sheet. The big news is out. The outlook for rate hikes, Chair Yellen and the FOMC have told us, depends on the realized and expected path of inflation. Some technical details about implementation remain to be disclosed, but Jackson Hole would not be the venue. The FOMC has also been clear that they will put off decisions on the terminal size of the balance sheet until after implementation has begun.


"Financial stability" matters, but isn"t new


As we noted, the Minutes of the June and the July meetings both discussed financial stability issues. In July, "a number" of participants noted that very low long-term yields could snap back abruptly or induce excessive risk taking. Moreover, the FOMC discussed equity valuation as a possible source of financial instability along with commercial real estate. On net, however, the FOMC seems comfortable with current financial stability risks, even though they will continue to monitor developments.


So what will she say about financial stability?


We suspect that Chair Yellen will take this opportunity to discuss the distinction between financial stability considerations and financial conditions more broadly. She will take stock of the signal from historically low interest rates and the forces that determine those rates. These factors include slower potential GDP growth than historically was the case, global savings demand for very safe assets, and the Fed"s balance sheet that continues to put some downward pressure on rates. She will note that equity valuations are high by some metrics, but by others may be justified. She will spend time on tight credit spreads, especially in the context of the Fed"s monetary policy, the ongoing expansion, and generalized risk taking. Finally, she will acknowledge that parts of the Committee see commercial real estate as potentially pointing to excessive risk taking.


Well, what about financial conditions?


The Chair will take some time to differentiate financial conditions from financial stability concerns. The high level of equity prices, tight credit spreads, and low longer-term Treasury yields are much in discussion. She will note that the easy financial conditions are not, in and of themselves, a problem for monetary policy. Rather, they are one factor among many that inform her outlook for the economy. Easier financial conditions should, all else equal, support aggregate demand. In fact, as noted in Fedspeak, the Committee"s outlook for ongoing gains and higher inflation over time is supported by these conditions, not hampered by them.


What should we take away?


Very little. Overall, Chair Yellen"s speech will articulate more clearly how the FOMC thinks about financial stability issues, there should be very little that informs us on the near-term outlook for monetary policy. She will likely reiterate that the post-Crisis regulation has made the system safer. She will embrace the idea that there is room for some adjustment to the existing regulation, but she will push back against the idea of wholesale financial deregulation.


Of course, if UBS is right, any hopes of a spike in cross-asset volatility at the end of the week can be postponed yet again. Market outcomes aside, what is the agenda and logistics? Here, courtesy of Goldman, is a full breakdown:


Starting with the basics, the conference runs from the night of Thursday, August 24 through Saturday afternoon. Each year, the conference centers around one broad theme (this year it is “Fostering a Dynamic Global Economy”) and all of the presentations should be a mix of current policy discussions and the conference theme.


The full program will be released here on Thursday night at 8pm NY time. In addition to timing, this schedule will include speaker names and the title of papers they will be discussing (if applicable). It is probably worth mentioning that because the conference is in Wyoming, all times are listed in Mountain Time. That is two hours behind the US East Coast and seven hours behind London.


None of the conference is broadcast. For all of the published speeches and papers, text will be released at the scheduled time for the panel or speech and there is no televised Q+A. However, there are usually a series of sideline TV interviews across major business networks. These are conducted throughout the day with a number of Federal Reserve officials (usually around five), international central bankers and academics. Because the speeches often have more of an academic slant, these interviews can  often be the most relevant short-term news events of the day. The last couple years, Vice Chair Fischer has done an interview on CNBC during the first coffee break around 11:30 NY time.


The main events start Friday morning at 10am with the keynote speech, which we now know will be delivered by Fed Chair Yellen. So far, the Fed has only said that her speech will be on the subject of “Financial Stability.” It is obviously hard to forecast a freeform speech, so we will just make a few logistical points.


  • First, since it is the keynote speech for the conference, the content of the speech should be closely tied to the conference theme of Fostering a Dynamic Global Economy.

  • Second, the subject of the speech alone is not a sufficient indicator for whether or not she will comment on current policy. Last year, the subject of Yellen’s speech was listed as “The Federal Reserve’s Monetary Policy Toolkit” but she decided to include an opening section on the “Current Economic Situation and Outlook” that could just as well have been omitted.

  • Third, keep in mind that this is an academic setting above all else. Although Yellen certainly knows the weight that her words carry, the Jackson Hole keynote tends to be 10-15 pages long and can include multiple pages of academic references and footnotes; this is not the kind of thing that is easily distilled into a few news headlines. Last year’s speech, with its explicit section on current policy, was probably an exception to that rule.

The keynote speech is just one aspect – albeit an important one – of a busy conference.


So far, we also know that ECB President Draghi will deliver the luncheon address on Friday at 3pm NY time. The text of his speech should be released at that time. While this could certainly change, the rest of the speaking slots on Friday are usually reserved for academics. In past years, there has also been a closing panel on Saturday around 12:25 NY time that features speeches from two or three G10 central bankers and  one from EM.


On the other end of the spectrum, the academic papers (and the topic of the conference itself) could potentially have the longest-lasting impact on the policy discussion. However, these will also be the hardest to immediately interpret. As with the speeches, the text of the academic papers will not be released until the time of the relevant panel. The title and author names will be on the program released on Thursday night.


As Goldman further adds, given the number of Federal Reserve comments likely to come out of Jackson Hole on Friday, the bank is providing its usual table of recent Fed comments with a bit of a longer history as a quick reference point. For example, Dallas Fed President Kaplan’s comment last week that he is going to be “patient” on future rate hikes was a repeat of comments he made in July.


* * *


Finally, for those who are not convinced that Draghi, who is scheduled to speak on Friday just before the market close, won"t steal the spotlight after all, Deutsche Bank reminds us that the ECB head is warming up for the trip by speaking at the Lindau economics symposium in Germany tomorrow, August 23 "and as such he could front run himself." In other words, tomorrow"s conference could be more market-moving than what happens on Friday.

Friday, August 18, 2017

"It Is A Battle Between Data And Theory" - Fed PhDs Second-Guess Inflation Model After 5 Years Of Failure

Federal Reserve officials are finally waking up to the fact that there’s something wrong with their inflation models. It only took them five years.


As Bloomberg points out, the minutes from the Fed’s July policy meeting, released yesterday, included a debate about whether the models that help the central bank set its inflation target are no longer functioning properly.


“Federal Reserve officials are looking under the hood of their most basic inflation models and starting to ask if something is wrong.


Minutes from the July 25-26 Federal Open Market Committee meeting showed a revealing debate over why the economy isn’t producing more inflation in a time of easy financial conditions, tight labor markets and solid economic growth.


The central bank has missed its 2 percent price goal for most of the past five years. Still, a majority of FOMC participants favor further rate increases. The July minutes showed an intensifying debate over whether that is the right policy response.”


Some economists worry that if the Fed begins to publicly question their methods, it could ruin what little credibility the central bank has left.


“These minutes to me were troubling,” said Ward McCarthy, chief financial economist at Jefferies LLC in New York. “They don’t have their confidence in their policy decisions; and they don’t have confidence that they can provide the right kind of guidance.”


Of course, Fed officials did everything in their power to communicate that these questions were being raised by a small minority on the FOMC, and didn’t represent anything resembling an official opinion.


“In several passages, the minutes asserted that “most” officials were sticking with a forecast that higher inflation would eventually show up. However, the debate over resource slack models and whether standard data sources were telling them the whole story also showed convictions about their forecast are fraying.”


As Bloomberg explains, prices have been resistant to any upward movement even as the US unemployment rate has fell to a 16-year low of 4.3 percent in July. The U.S. consumer price index rose 1.7 percent for the 12 months ending July, while the PCE price index, the Fed’s preferred measure, which is tied to consumption, rose 1.4 percent in June. Another gauge calculated by the Dallas Fed, which trims index outliers to highlight the underlying price trend, rose 1.7 percent for the 12 months ending June. That was the same as May, which was down from 1.74 percent in April.


A few officials pointed out what many investors have believed for years: That the Fed"s inflation forecasting model is totally useless.


“The minutes said “a few” officials described resource slack models as “not particularly useful” while “most” thought the framework was valid.


Members also questioned whether there’s another theory that might better explain the inertia in prices.


The committee also pondered a number of theories as to why inflation wasn’t responding to tightening labor resources, such as “the possibility that slack may be better measured by labor market indicators other than unemployment.”


One notable economist described it as “a battle between data and theory.”


“It is a battle between data and theory,” said Ethan Harris, head of global economic research at Bank of America Corp. in New York.


But it almost doesn’t matter that the Fed’s vaunted inflation models no longer make any sense, because, the Fed is going to keep hiking no matter what now that the risks have struck the “appropriate balance” – at least that’s what one member of the leadership (probably Chairwoman Yellen) believes.   


“The minutes also included an unusual signal that someone - possibly a member of the committee’s leadership - saw additional rate increases as striking the “appropriate balance” on policy goals, dedicating two sentences to the views of “one participant.”


“That seems like an awful lot of air time as well as a very definitive answer coming from a mere ‘one participant’ - unless that single person happened to be someone really important - like, I don’t know, maybe the Chair?,” Stephen Stanley, chief economist at Amherst Pierpont Securities in New York, wrote in a note to clients, referring to Janet Yellen.”


Maybe in whatever model they concoct to replace this one, the Fed should include a metric probably more relevant today than economists realize: The amount of time Americans’ spend on Instagram per day.
 

Friday, August 11, 2017

Goldman Cuts Rate Hike Odds After 5th Consecutive Inflation Miss

The Fed is becoming increasingly trapped: despite the FOMC"s "best intentions" to telegraph that the economy is improving with the unemployment rate at a paltry 4.3% - because otherwise it clearly wouldn"t be hiking, right - CPI has now missed consensus estimates for 5 consecutive months, and what worse, the biggest historical driver of inflation in recent years, shelter and rent inflation, appears to have peaked and is now declining. Worse, wage inflation is nowhere to be found, much as one would expect from a bartender and waiter-led "recovery."


Of course, never one to miss a scapegoat, earlier today Dallas Fed president Robert Kaplan blamed the lack of inflation on technology, saying at an event in Texas that technological disruption is "a new and powerful structural factor that is influencing inflation" and finally noticing that "technology is increasingly replacing people in the jobs market" while "allowing consumers to change shopping habits, and is limiting the pricing power of businesses. That - in addition to global factors - has an impact on inflation."


Predictably there was no discussion of how it is the Fed"s trillions in excess liquidity that has allowed VCs to invest tens if not hundreds of billions in money-losing ventures, which have made this tech-driven deflation possible.


As an aside, while the BLS-reproted CPI continues to deteriorate, the Atlanta Fed reported that its own sticky-price consumer price index —a weighted basket of items that change price relatively slowly—rose 2.6% annualized in July, following a 2.2% increase in June. The 12-month percent change in the index remained at 2.1%. Then again, the Fed is known to avoid any indicator that defies the prevailing groupthink, which now seems to be that inflation is lower than the Fed would like it to be.


So while the Fed ponders how to escape this trap it has created for itself, in which zombie companies refuse to die and where cash burning tech companies push inflation ever lower, at least until rates rise enough to crush the VC party once and for all, here is Goldman which moments ago once again cut its forecast for a rate hike possibility in 2017.


The consumer price index rose 0.11% in July in both the headline and the core, missing expectations for the fifth consecutive month. The primary sources of weakness were lodging away from home and new vehicle prices, and we suspect the former will rebound in coming months. Nonetheless, we now estimate that the core PCE price index rose just 0.08% month-over-month in July, or 1.40% from a year earlier, down from +1.5% in June. Accordingly, we now place the subjective odds of a third hike this year at 55% (vs. 60% previously).


The details:


  1. The consumer price index (CPI) rose 0.11% month-over-month in both the headline and the core (excluding food and energy), below expectations for the fifth consecutive month. Food prices rebounded (+0.2%) but energy prices edged down (-0.1%), providing offsetting impacts for the headline CPI, where the year-over-year rate moved up a tenth to +1.7% (vs. consensus of +1.8%). Relative to our expectations, the sources of weakness in core inflation this month were lodging away from home (-4.2% mom) and new car (-0.5%) prices, which together reduced month-over-month core inflation by -0.07pp. The lodging decline was the largest on record (back to the 1960s) and appears at odds with continued firmness in the PPI and industry measures. Despite the overall weakness, month-over-month inflation was generally firm in the large and persistent housing and medical care categories, with increases in medical services (+0.3%), medical commodities (+1.0%), and owners’ equivalent rent (+0.27% vs. +0.28% in June) prices, despite the sequential deceleration in rent of primary residence (+0.24% from +0.35% in June).

  2. Based on details in the PPI and CPI reports, we estimate that the core PCE price index rose just 0.08% month-over-month in July, or 1.398% from a year earlier (vs. +1.505% in June). Additionally, we expect that the headline PCE price index rose 0.08% in July, or +1.392% from a year earlier.

  3. Despite encouraging component detail, the overall CPI report was clearly disappointing. We lowered our Fed probabilities accordingly, with subjective odds for a third hike this year at 55% (vs. 60% previously). In terms of timing, we place the odds of the next hike at less than 5% for September (vs. 5% previously), less than 5% for November (vs. 5% previously), and 55% cumulatively by December (vs. 60% previously).

At the current rate of economic disappointments, that 55% will hit zero in about 4-6 weeks.

Monday, July 31, 2017

Dallas Fed Activity Improves But Respondent Warns "Prospects For Better Are Dimming"

After peaking in February, Dallas Fed"s Manufacturing Outlook has slid almost constantly until July which just saw it bounce modestly from 15.0 to 16.8 (stil below May"s levels)


Reading The Dallas Fed"s breakdown reports,  one wuld think everything is awesome!.


The production index, a key measure of state manufacturing conditions, rose 11 points to 22.8, indicating output grew at a faster pace than in June.


Other measures of current manufacturing activity also indicated a pickup in growth. The new orders and the growth rate of orders indexes rose several points each, coming in at 16.1 and 12.2, respectively. The capacity utilization index moved up to 18.1 and the shipments index increased three points to 11.6.


Perceptions of broader business conditions improved again in July, with a sharp pickup in outlooks. The general business activity index edged up to 16.8, marking a 10th consecutive positive reading. The company outlook index jumped 15 points to 25.9, reaching its highest level since 2010.


Labor market measures indicated slightly stronger employment gains and longer workweeks this month. The employment index has been positive all year and edged up to 11.2, its highest reading since the end of 2015. Twenty-one percent of firms noted net hiring, compared with 9 percent noting net layoffs. The hours worked index ticked up to 9.8.


Prices and wages continued to rise in July. The raw materials prices index held steady at 15.5, while the finished goods prices index moved up slightly to 5.6. The wages and benefits index remained somewhat elevated at 20.6.


Expectations regarding future business conditions continued to reflect optimism. The indexes of future general business activity and future company outlook held steady at 31.6 and 34.8, respectively. Other indexes of future manufacturing activity showed mixed movements but remained solidly in positive territory.


But, respondents did not seem to be so exuberant...


  • The foreign competition for new equipment is extremely competitive and our company is not able to match their selling prices.

  • Things are going poorly in the economy. We have no projects, and business is slow.

  • We are experiencing the summertime blues. Business is very dull July to date.

  • We are feeling more confident about the economy improving. More buyers seem to be more confident and placing orders with increased volumes and deliveries further into the future.

  • One huge order has spurred our manufacturing. However, nothing similar is expected in the near future.

  • There has been a notable decline in orders from energy industry customers over the past 30 days given the drop in oil prices. There is very little visibility on customer demand in the second half of the year.

  • The drop in oil prices in 2015 forced us out of our comfort zone and into new industries and locations. We have found that manufacturing technology from the oil industry applies equally well to defense, aerospace, heavy vehicle manufacturing and power generation. As oil recovers, we will also benefit from working in these new markets.

  • The increases in business are small but measurable. We have been trying to add employees over the last six months, with no qualified candidates available.

  • Grocery store deli and fast-food chain activity remains fairly slow. We are seeing increased activity, with convenience store remodels driven by increased food offerings.

And what about this!!


  • I cannot explain it, but we are slower than we have ever been at this time and it seems like we are not the only ones. This is crazy how summer-vacation mindset seems to have set in and companies are just not committing to projects. Most everyone I have spoken to in the graphic arts community is complaining of the same thing. If this doesn’t turn around quickly, there will be some significant cutbacks around here—something that will be very painful, as we are down to only talented workers with no fat to trim.

And finally there"s this...


  • Washington, D.C., is still a significant contingent factor for a better or worse outlook. Prospects for better are dimming.

Friday, July 7, 2017

June Payrolls Preview: With The Fed On Autopilot, You Can Skip This One

After a poor March jobs report, followed by an April scorcher, then another debacle in May, the June payrolls report due at 8:30am will be... very much irrelevant, because as Citi pointed out earlier, the Fed is now data-independent and will keep hiking until financial conditions finally tighten (read: stocks drop). In other words, with the Fed on autopilot, feel free to skip this one - it hardly matters. For what it"s worth, here are the consensus expectations for tomorrow"s report:


  • June Nonfarm Payrolls Exp. 179K vs May 138K

  • Unemployment Rate Exp. 4.3% vs May 4.3%

  • Average Hourly Earnings M/M Exp. 0.3%, vs May 0.2%; Y/Y Exp. 2.60%, vs May 2.50%

Courtesy of RanSquawk, here is a detailed breakdown of expectations:


HEADLINE NFP: Analysts expect 179k nonfarm payrolls will be added to the US economy in June, against 138k added in May. Headline payroll growth has eased: The three-month rolling-average of the headline is running at a 121k clip, the slowest since July 2012, suggesting the pace of slack erosion is easing.


  • Analysts at Barclays, who are more-or-less in line with the consensus view, write “factors influencing our forecast include initial claims, which continue to point to low rates of job separation, and the timing of the survey week in May.” The bank says claims have been pointing toward stronger payroll growth for some time too, but add that “in the other direction are calendar-day effects that we believe held back reported employment last month.”

JOBLESS RATE: The unemployment rate is seen steady at 4.3%; the FOMC has forecast that the jobless rate will end-2017 at that level, while it recently cut its projection of NAIRU (non-accelerating inflation rate of unemployment) to between 4.5-4.8%; in June 2016, that estimate stood at between 4.7-5.0%. Given that the jobless rate is beneath the NAIRU estimate, many are once again focusing on the U6 measure of unemployment, which was running at 8.4% in May.


WAGE GROWTH: Given that the labor market supposedly is tight, and the path of monetary policy is contingent on the progress of inflation, attention will be on the gauges of wage growth. The consensus view looks for average hourly earnings Y/Y to decrease to 2.6% from 2.5%, but the M/M measure is seen rising by 0.1ppts to 0.3% due to calendar effects.


  • Analysts at CitiFX suggest that the USD is most sensitive to surprises on wages. But the bank notes that “a strong wage print would still not allay concerns on inflation where shelter, healthcare and apparel have represented a bigger drag than expected,” but add “a stronger wage print would strengthen conviction however that slack has been exhausted and potential growth is falling.”

  • The market pricing of interest rate hikes is more pessimistic than the FOMC’s projections, with the former pricing in three hikes through 2019 versus the Fed’s forecast looking for seven. One theory explaining this discrepancy is that the Fed’s longer-term projection of the Federal Fund rate around 3% is too optimistic, and a lack of growth in the medium term may mean that the peak in the cycle is lower than its projection. Another part of this is that with weak inflationary pressures, there isn’t much reason for rates to jump higher. Accordingly, inflation data, as gauged by PCE, core PCE, CPI and wage growth, will be key in shaping expectations of inflation, and thus the trajectory of Fed policy.

* * *


Goldman"s summary:


We estimate nonfarm payrolls rose 180k in June, following a 138k increase in May and compared to three- and six-month moving averages of 121k and 161k, respectively. Labor market fundamentals were mixed in June. While business employment surveys remained at strong levels and the Conference Board’s labor market differential rose to a new cycle high, initial jobless claims drifted higher and continuing claims increased for five consecutive weeks. In terms of one-off effects, we expect payroll growth to benefit from the arrival of students and recent graduates into the labor force, following a pronounced drop in youth participation rates in May likely caused by the timing of the survey week. While this would suggest scope for reacceleration in payroll growth, it would also suggest upward pressure on the unemployment rate, as students begin their summer job searches. While we expect the unemployment rate to remain stable at 4.3%, we note potential upside risks accordingly.


On wages, Goldman is optimistic this time, mostly due to a favorable calendar effects;


We estimate average hourly earnings increased 0.3% month over month and 2.6% year over year in June, reflecting the interaction of firming wage growth with somewhat favorable calendar effects. We view the risks to the year-over-year number as skewed to the upside. The June payroll period ended on the 17th, which in our model is associated with somewhat above-average wage growth, and we are constructive on wage growth more generally, exemplified by the acceleration in the employment cost index to a cycle-high pace in Q1.


Factors arguing for a stronger report:


  • Youth Employment Rebound. We believe some of the May weakness in both payrolls and labor force participation reflected the timing of student summer hiring. Details of the household survey show that job growth and participation were particularly weak among young people: despite representing less than 15% of the workforce, 16-24-year-olds drove three fifths of the overall drop in household employment (-158k of -252k, mom sa) and three quarters of the drop in the labor force (-306k of -419k). As a result, the unemployment rate among this segment declined sharply to its lowest level in nearly 50 years (-0.6pp to 8.8%). In contrast, unemployment rates were stable among respondents 25 years and older. We suspect the relatively early May survey week may have contributed here. As shown in Exhibit 1, the size of the youth labor force is relatively volatile and mean-reverting, and sharp moves in May tend to reverse in June (correlation of -0.60 in May/June since 1990). The same relationship holds for youth monthly employment growth in those months (correlation of -0.49). The unwinding of these effects suggests scope for accelerating job growth (in both the household and establishment survey) and potentially upward pressure on the unemployment rate (reflecting a possible rebound in labor force participation).

Exhibit 1: Youth Labor Force Entry Should Put Upward Pressure on Payrolls


  • Manufacturing sector surveys. Employment components of manufacturing sector surveys were generally encouraging on net in June. The ISM manufacturing employment component improved for a second month (+3.7pt to 57.2), and both the Dallas Fed and Kansas City Fed employment subindices also moved higher. However, the Philly Fed, NY Fed, Richmond Fed, Chicago Fed and Markit PMI employment components all fell in June. Our overall manufacturing employment tracker edged higher by 0.3pt to 56.0. Manufacturing payroll employment edged down 1k in May, its first outright decline in seven months, and has increased 12k on average over the last six months.

  • Service sector surveys. Service-sector employment surveys have been mixed in June but remained at generally high levels, with the ISM non-manufacturing survey falling to 55.8 in June (from a one year high of 57.8 in May). Our overall non-manufacturing employment tracker increased 0.7pt to 54.8 in June, with gains in the Philly Fed and Dallas Fed employment subindices but deterioration in the New York Fed and Richmond Fed measures. Encouragingly, the key labor market subcomponent of the Consumer Confidence report strengthened 3.1pt to 14.8, a 16-year high. Service sector payroll employment grew 131k in May and has increased 122k on average over the last six months.

Factors arguing for a weaker report:


  • Jobless claims. Initial claims for unemployment insurance benefits rebounded somewhat, averaging 243k during the five weeks between the May and June payroll survey periods, up from a cycle low of 241k on average during the prior-month period. Additionally, continuing claims rose by 21k from survey week to survey week and have now risen for five consecutive weeks.

  • Continued retail weakness. Retail employment growth has fallen from its historical trend of 15-20k per month to -20k on average over the past four months. We believe the structural shift of retail sales from brick and mortar stores toward less labor-intensive e-commerce firms will continue to weigh on payrolls growth in that industry, with the impact on the order of 10k per month relative to its previous trend. This drag on retail employment has appeared particularly pronounced recently, and we note the possibility that weak brick and mortar sales trends this year may be accelerating the pace of this structural shift.

Neutral Factors:


  • ADP. The payroll processing firm ADP reported a 158k increase in private payroll employment in June – below consensus expectations and its slowest pace of the year. However, we believe that some of the sequential softness in the report likely reflected weakness in the financial and economic indicators also used in the ADP model, making it difficult to tease out the underlying signal regarding the pace of job growth. Exhibit 2 shows the relationship between ADP surprises (vs. consensus based on first-reported ADP) and non-farm payrolls surprises, which appears rather limited outside of large surprises.

Exhibit 2: Limited Relationship between ADP and Payrolls, but Don’t Completely Ignore Large ADP Surprises


  • Labor supply constraints. We view the labor market as close to full employment, and as slack diminishes further, this should exert both upward pressure on wages and downward pressure on job growth. However, labor supply constraints historically appear less binding in June, perhaps reflecting the entry of students and recent graduates into the labor force. As shown in Exhibit 3, in years with relatively tight labor markets, payroll growth tends to slow during the spring but then reaccelerate in June/July. One potential driver of this June reacceleration is that firms may hire more graduates and students on summer vacation if they had difficulty filling positions earlier in the year.

Exhibit 3: Labor Supply Constraints Are Historically Less Binding in June


  • Job availability. The Conference Board’s Help Wanted Online (HWOL) report showed a 1.0% pullback in June online job postings following May’s 4.2% increase. However, we continue to place limited weight on this indicator at the moment, in light of research by Fed economists that suggests the HWOL ad count has been depressed by higher prices for online job ads.

  • Job cuts. Announced layoffs reported by Challenger, Gray & Christmas after our seasonal adjustment declined modestly (-5k to 35k), near the middle of its recent range. On a year-over-year basis, announced job cuts declined by 8k.

  • Seasonals. Since 2010, June payroll growth has surprised positively relative to consensus in four of the seven instances with an average surprise of +14k. We don’t view this as compelling evidence of a systematic bias in June.

* * *


Other Labor Market Considerations:


CLAIMS: On a four-week moving average basis, initial jobless claims are at 243k going into June’s employment situation report; though that is technically a touch higher than the 239.75k four-week moving average heading into May’s employment report, it is essentially flat, and stable. Continuing claims have, however, edged up on the four-week moving average basis to 1.944mln from 1.918mln before the previous NFP report.


ADP: The ADP reported 158k payrolls were added to the US economy in June; analysts had expected a print of 185k versus the prior (downwardly revised) 230k. However, the report is “very likely to understate the official payroll number,” write analysts at Pantheon Macroeconomics. Pantheon explains that “ADP"s number is generated from a model which includes lagged official payroll numbers, so the soft May number, 147K for private payrolls, has pulled down today"s ADP”. It adds that May"s official number was hit be a seasonal adjustment issues, which likely won"t reverse in full in June, but definitely will not be repeated. “Payrolls should therefore revert to the trend implied by a host of survey data, at least.”


JOB CUTS: US employers announced intentions to trim payrolls by 31,105 jobs in June, Challenger reported, which is the lowest monthly total in 2017, 6% lower than May’s number, and 19% lower than June 2016. The consultancy also reported that job cuts had declined 28% in the first half of the year. “The pace of job cutting is significantly slower compared to the first half of last year,” Challenger said, adding “in a tight labour market, it’s no surprise companies are holding on to their existing workforces. Companies are also waiting to see how proposed regulations from the Trump administration may impact business going forward.”


BUSINESS SURVEYS: The non-manufacturing ISM report indicated a slight easing in labour market conditions, with the employment sub-index falling by 2 points to 55.8, though the measure has been in expansion (above 50) for 40 consecutive months. Markit, another survey compiler, noted that in its own services PMI, employment growth remained strong in June, with the pace of job creation at the fastest since February. The manufacturing ISM, meanwhile, reported an acceleration in labour market conditions, with the employment sub-index rising by 3.7 points to 57.2 to print the ninth straight month in expansion.