Showing posts with label Energy policy. Show all posts

Thursday, November 30, 2017

About That Sensationalist Bitcoin Electrical Consumption Story

Authored by Charles Hugh Smith via OfTwoMinds blog,


Check the context before uncritically accepting sensationalist conclusions.


Let"s start with a primer on how to write a sensationalist story that can be passed off as "journalism:"


1. Locate credible-sounding data that can be de-contextualized, i.e. sensationalized.


2. Present the data as "fact" rather than data that requires verification by disinterested researchers.


3. Exaggerate the data as much as possible and set the tone and context with emotionally laden words: "shocking," etc.


4. Select a context that sensationalizes the conclusion.


Now let"s take a look at a story that has been swallowed whole, with little to no fact-checking or disinterested inquiry: bitcoin"s electrical consumption, i.e. the electricity consumed by mining/maintaining bitcoin"s blockchain.


One Bitcoin Transaction Now Uses as Much Energy as Your House in a Week


Let"s start by stipulating that energy consumption is a consequential matter worthy of serious inquiry. It"s important to measure the energy consumption of all the systems that operate within the current status quo, and compare the consumption levels of these systems.


With that in mind, let"s take a look at the story.


Right off the bat, the context we"re offered to grasp the enormity of bitcoin"s mining consumption is the electrical consumption of Nigeria, a nation, we"re breathlessly informed, with 186 million residents. Wow! That"s a crazy amount of electrical consumption, right?


Let"s do some very basic fact-checking before we accept sensationalist conclusions, shall we?


Nigeria consumes about 24 billion kWh annually, while the U.S. consumes 3,913 billion kWh annually.


So Nigeria uses 3/5th of 1% (0.6%) of the electricity the U.S. consumes.


Now let"s compare that electrical consumption with the amount of electricity consumed in the U.S. by residential devices and chargers on stand-by, i.e. appliances, devices, chargers, gizmos, etc. that aren"t in use and doing no work but that are still consuming electricity.


About a quarter of all residential energy consumption is used on devices in idle power mode, according to a study of Northern California by the Natural Resources Defense Council. That means that devices that are “off” or in standby or sleep mode can use up to the equivalent of 50 large power plants’ worth of electricity and cost more than $19 billion in electricity bills every year.


source: Just How Much Power Do Your Electronics Use When They Are ‘Off’? (May 7, 2016, New York Times)


(Please read the article to find out just how much power the 50+ gadgets in your home consume doing absolutely zero work.)


According to the U.S. Energy Information Administration, annual residential electrical consumption totals 1,410 billion kWh.


So 25% (the amount of household electricity consumed by stand-by devices) of 1,410 billion equals 352 billion kWh consumed annually by residential appliances and devices on stand-by in the U.S.


Now let"s compare the annual electrical consumption of Nigeria (24 B kWh) with the annual residential electrical consumption of devices on stand-by in the U.S.


The annual electrical consumption of Nigeria (24 B kWh) is 6.8% of the annual electrical consumed by household devices on stand-by in the U.S. That means the supposed consumption of bitcoin mining is 1/14th of the power lost to residential devices on stand-by in the U.S., devices doing essentially nothing.


Now let"s add in all the appliances and devices in government and private-sector offices on stand-by. Let"s conservatively estimate another 150 B kWh lost to all this stuff on stand-by.


Now let"s multiply the total of electricity lost to stuff on stand-by mode (doing no work whatsoever) in the U.S., 500 B kWh annually, by five, since the U.S. consumes roughly 20% of all electricity globally.


Electricity production 2016 (Enerdata)


The United States’ share of world energy consumption (EIA)


This gives us an estimate of all the electrical power lost to electrical appliances and devices on stand-by globally every year: 2,500 billion kHh. 1% of that wasted electricity is 25 billion kHh. If you reckon this seems high, let"s shave these totals to 1,500 billion kHh and 15 billion kHh.


Let"s go back to the story about bitcoin"s consumption of electricity which tells us "a shocking 215 kilowatt-hours (KWh) of juice (is) used by miners for each Bitcoin transaction."


But then a few paragraphs down, we discover the electricity per transaction might only be 77 kWh-- nobody really knows for sure. Hmm. 77 is 36% of 215, so the "shocking" consumption might overstate actual consumption by a factor of three?


Let"s choose a number between 77 and the "shocking" 215, since nobody really knows what the real number is: shall we guesstimate 135, or 2/3 of the high guesstimate? That would drop the annual consumption of bitcoin mining from 24 B kWh annually to 15 B kWh, less than 1% of the electricity wasted annually on stand-by devices doing no work whatsoever.


And so, um, bitcoin mining is a threat to the planet because it consumes less than 1% of all the electricity squandered by appliances and devices on stand-by? If we want to stop wasting so much energy, perhaps we should start by mandating near-zero stand-by power consumption for the hundreds of millions of devices which are not in use that are nonetheless sucking up electricity every second of every day.


Here"s another thought: check the context before uncritically accepting sensationalist conclusions.


*  *  *


If you found value in this content, please join me in seeking solutions by becoming a $1/month patron of my work via patreon.com. Check out both of my new books, Inequality and the Collapse of Privilege ($3.95 Kindle, $8.95 print) and Why Our Status Quo Failed and Is Beyond Reform ($3.95 Kindle, $8.95 print, $5.95 audiobook) For more, please visit the OTM essentials website.


Tuesday, November 14, 2017

Ruble, Real Tumble As Oil Slumps On Weaker IEA Outlook

WTI Crude is tumbling this morning, breaking down below $56 following a monthly report Tuesday from the International Energy Agency that said 2017 price gains along with milder-than-normal winter weather are slowing demand growth. This drop is weighing on oil-producers with the Ruble and Real dropping most...


The IEA reduced its demand estimate for next year by 200,000 barrels a day to 98.9 million a day, according to projections in its report. Forecasts for demand growth next year also fell by 100,000 barrels a day to 1.3 million a day.


“The market balance in 2018 does not look as tight as some would like, and there is not in fact a new normal” that would buoy prices above $60, said the Paris-based agency.


“If you put two and two together, it shows that we are going to be a little bit oversupplied in 1Q,” Michael Loewen, a commodities strategist at Scotiabank in Toronto, said by telephone referring to the IEA report. “Traders in the market are focusing on that right now. We rallied too far, too quick.”


This oil move has pushed the Ruble down to 3-month lows...back over 60 Ruble per USD...


Wednesday, August 30, 2017

How Trading Renewable Energy Will Grow the Industry

As the world becomes more environmentally aware, all eyes are on finding sustainable, long-term solutions to replace the use of non-renewable materials such as fossil fuels. Great steps are being taken to reduce greenhouse gases, notably carbon emissions, with recruiters like NES constantly looking to place talented individuals into key positions within the energy industry – but what could Europe’s renewable energy revolution have in store for the industry?


International power grid


Believe it or not, a relatively quiet mission is currently underway to create an economically significant and internationally successful power grid. It will help many countries benefit from natural resources like never before. It may sound like something from a futuristic movie, but an impressively intricate project has already begun to connect Britain to Norway’s huge hydroelectric power supplies.


The project will take years to complete, but when finished power lines running through a Norwegian mountain near Kvilldal will connect to Blythe in Northumberland via the longest undersea power cable in the world, stretching 450 kilometers.


The plan? To allow the UK and Norway to import and export natural power sources. The UK could import 1400 megawatts of electricity, enough to power over 750,000 homes. Norway will benefit from wind energy exported from the UK in a scheme that’s both intelligent and efficient.


The trade of surplus energy


The trade of surplus energy from one country to another forms the backbone of Europe’s renewable energy revolution. Using power interconnectors to link nations together in an eco-friendly way is a logical step when it comes to reducing emissions. But what does this mean for the future of energy usage?


An international power grid can theoretically produce more reliable energy supplies by helping to reduce the effects of intermittent energy produced by renewables such as wind and solar power.


Northern European countries, for instance, that produce large amounts of energy from the wind can trade electricity with sunnier European climates offering reliable and efficient solar power. The use of surplus energy is an innovative and forward-thinking approach to reducing the carbon footprint here on Earth and, if successful, could go a long way to reducing greenhouse gases. A successful international network of natural power could also drive down wholesale energy prices as people are given an alternative to how they fuel their lives.


Interconnectors already in use


With the Norwegian-UK project well underway, it’s also worth noting that interconnectors are already being used. The UK is connected to electricity sources in France and Ireland. Interconnectors in multiple other countries, including Belgium are in the advanced stages of planning or construction. Indeed a new interconnector linking the UK with France has recently been approved and looks set to power up to two million homes ensuring Britain’s energy supply is continuously resilient.


Europe’s large-scale renewable energy revolution will potentially make the world a greener environment with cleaner living gathering momentum across the globe.


Pay with rays

Wednesday, July 26, 2017

Visualizing What Energy Sources Power The World?

There are many types of maps out there, but one of the most telling ones is a simple satellite image of the Earth at night. As "s Jeff Desjardins writes, on these powerful images, the darkness is a blank canvas for the bright city lights that represent the vast extent of human geography. The bright spots help us understand the distribution of population, as well as what areas of the world are generally wealthier and more urban. Meanwhile, the big dark spots – such as over the wilderness in northern Canada, the Amazon basin, or in Niger – show areas that are not densely populated or more rural.


Here’s one image based on this principle. It comes from NASA, and is a composite made from 400 separate satellite images from 2012:


Satellite composite image of Earth


Source: Visual Capitalist


How Are These Lights Powered?


But what if we could differentiate, by “shutting off” lights that are powered by certain electricity sources?


Today’s visualizations come from a nifty interactive website put together by GoCompare.com, and they breakdown the world’s electricity by source: fossil fuels, renewables, or nuclear fission.


Fossil Fuels


To start, here are the places on Earth that are powered by fossil fuels.


(Click image to see larger version)
Fossil Fuels only


Source: Visual Capitalist


Globally, fossil fuels represent about two-thirds of electricity usage. It’s also worth noting that fossil fuels also make up the majority of non-electrical sources needed for things like automobiles, aircraft, and ships, which are not shown on the map.


For further interest, we have previously shown the evolution over time of total U.S. energy usage, as well as a detailed breakdown of current U.S. usage – both which are still dominated by fossil fuels such as oil, natural gas, and coal.


Nuclear Only


Here are the places on Earth powered by nuclear fission.


(Click image to see larger version)
Nuclear only


Source: Visual Capitalist


Nuclear makes up about 10% of all global electricity usage – and France is the world’s most reliant country, getting about 74% of its power mix from nuclear. Also noteworthy is Japan, which has switched its major electrical source from nuclear to fossil fuels since the Fukushima incident in 2011.


Nuclear is a major source of energy in the rest of Europe as well.


Belgium (51%), Sweden (43%), Hungary (51%), Slovakia (55%), Czech Republic (35%), Slovenia (33%), Ukraine (43%), and Finland (33%) all draw significant amounts of their electricity from nuclear reactors.


Renewables


Last, but not least, are renewables.


(Click image to see larger version)
Renewables only


Source: Visual Capitalist


It’s important to remember here that hydroelectricity is the largest renewable energy source by far, and that countries like Canada and Brazil rely on hydro extensively.


Outside of hydro, Italy is a leader in solar generation (6% of all electricity). Meanwhile, just eight countries host over 80% of all installed wind power: France, Canada, United Kingdom, Spain, India, Germany, USA, and China.


Finally, it’s worth noting that there are four smaller countries that get all, or nearly all, of their electricity from renewable sources. Those include Iceland (72% hydro, 28% geothermal), Albania (100% hydro), Paraguay (100% hydro), and Norway (97% hydro, 2% fossil fuels, and 1% other).

Friday, July 14, 2017

This Nation Just Became The World's Newest Energy Superpower

Authored by Dave Forest via OilPrice.com,


Lots of news this week on energy companies from one particular spot on Earth.


India.


In Lebanon — where reports suggest Indian state oil firm ONGC will bid for offshore blocks. In Canada — where Indian officials are said to be negotiating coking coal supplies. And even in Venezuela, where the cash-strapped government is seeking to sell ONGC a 9 percent stake in the key San Cristobal oil field.


And a new study released this week suggests it’s not coincidence we’re hearing so much about Indian companies on the energy stage.


In fact, India has quietly become one of the world’s biggest energy investors.


That revelation came from the International Energy Agency (IEA) — which released a report yesterday on energy investment trends for 2016. Showing that India’s investment in energy projects surged during the past year.


All told, India’s spending on electricity, oil and gas, coal and renewables jumped by 7 percent in 2016, as compared to the previous year. Reaching nearly $100 billion.


As the chart below shows, that rise was enough to vault India into third place globally for energy investment. Edging out oil giant Russia. India moved into third place globally for energy spending in 2016.


(Click to enlarge)


Of course, India’s energy spending is still a long way off second-place U.S. and top investor China. But the rapid rise of energy investment here shows this is an up-and-coming spot for project funding in oil and gas, and beyond.


IEA attributed India’s ascent to new government policies helping to modernize and expand the economy. Further evidence the country is “getting its act together” in becoming a true natural resource superpower.


That’s an important point of note for project developers globally. Especially given Indian firms seem to have appetite for places further out on the risk spectrum — evidenced by this week’s action in places like Lebanon and Venezuela.


As a final point of interest, the IEA study also showed that — for the first time ever — electricity passed oil and gas as the top energy sector for investment in 2016. Coming as capital spending in the global petroleum space plunged 38 percent between 2014 and 2016.


The group says however, that petro-spending should jump in 2017. Watch for Indian companies to be a big part of those deals and new projects.

Sunday, July 9, 2017

The Inevitability Of DeGrowth

Even though we don"t know precisely how the future will unfold, we know a few things about it:


  1. Of the 7.5 billion humans on the planet, virtually every individual wants to enjoy a high-energy consumption “middle-class” lifestyle. As a generous estimate, 1.5 billion people enjoy a high-energy consumption lifestyle today; the remaining six billion are aspirants hungry for all the goodies enjoyed by the 1.5 billion—all goodies based on affordable, abundant energy.

  2. Our dependence on debt to fuel growth—more extraction of resources, more energy, more manufacturing, more consumption and more earned income to pay for all this expansion of debt and consumption—has built-in limits: debt accrues interest and principal payments, which reduce the remaining income available to spend on consumption.  Our dependence on fast-rising debt just to maintain low rates of growth eventually limits our ability to pay for more consumption/growth. When most income is devoted to servicing debt, there isn’t enough left to buy more stuff or support additional debt.

  3. The debt needed to move the growth needle is expanding at a much higher rate than the growth it generates. While growth is stagnant, debt is expanding by leaps and bounds to unprecedented levels. (Global Debt Hits A New Record High Of $217 Trillion; 327% Of GDP)

  4. Wages are stagnating for the bottom 90% of the workforce. We can quibble about the causes, but there is no plausible evidence to support a belief that this trend will magically reverse.

  5. The cost of the most valuable energy--high-density, easy to transport—will slowly but surely become more expensive as the cheap, easy-to-extract energy sources are depleted, notwithstanding the temporary boost provided by the fast-depleting wells of the fracking “miracle.”

  6. There are limits on our exploitation of resources such as fresh water and wild fisheries. Humans can print currency (money) but we can’t print fresh water, energy, wild fisheries, etc. If one unit of currency currently buys one liter of petrol, printing 10 more units of money doesn’t create 10 more liters of fuel.  

  7. Creating currency out of thin air isn’t free in our system: all new currency is loaned into existence and accrues interest. As a result, all currency is a claim on future earnings. If we borrow enough from the future, and earnings remain flat or decline, eventually there’s not enough income left to support the debt service and the expanding consumption the status quo needs to keep itself glued together.


What’s the result if we add these up?


Simply put, debt-dependent consumption in a world in which wages stagnate for the bottom 90% and energy costs increase as demand outstrips supply is a system with only one possible end-point: collapse.


The Energy-Debt-Growth Connection


If we accept that energy will get increasingly scarce and costly, and real earned income for the vast majority of households is in structural decline, that means the global economy is in terminal trouble. As this chart shows, energy consumption per capita and GDP (gross domestic product, a measure of growth) are in near-perfect correlation: rising energy consumption per person is the foundation of economic expansion:


If energy consumption per person declines, so does GDP. If GDP/ economic expansion stalls, the global financial system--dependent as it is on the permanent expansion of debt and income to service that debt--has a problem.


In other words, energy, growth and debt are intrinsically linked. Analysts Gail Tverberg and Chris Martenson, among others, have been discussing the causal connections between energy, debt and the financial system for years. Here are recent examples of their work:


- The Looming Energy Shock (PeakProsperity.com)


- The Next Financial Crisis Is Not Far Away (OurFiniteWorld.com)


Simply put, the extraction of fossil fuel energy and the development of alt energy on a vast scale both require an equally vast expansion of interest-accruing debt, both to fund the actual extraction, processing and transport of energy and the consumers’ purchases of all the energy-intensive goods and services that keep the economy expanding.


Right now, oil and natural gas are relatively inexpensive compared to historical peaks, especially when prices are adjusted for inflation. Broadly speaking, the fracking “miracle” (based on expanding debt) has pushed supply temporarily higher than demand. (By temporary I refer to a timeline of a few years.)


The resulting collapse in energy prices, while welcome to consumers, negatively impacts energy companies" ability to seek new reserves (exploration and production), tap existing reserves that cost a lot to extract or build new alternative energy facilities on a large enough scale to matter.


As we witnessed in the 2008 spike in oil prices to $140 per barrel, soaring energy prices crush consumer spending, triggering stagflation and recession.


The solution is a Goldilocks price structure—energy prices that are not too high (for consumers), and not too low (for producers). The problem is that as energy costs ratchet higher while wages stagnate or decline, the financial capability of households and businesses to pay higher energy and debt-service costs and expand their consumption vanishes.


Something has to give: either consumption declines (triggering structural, permanent recession) or the energy sector goes bankrupt as its production costs cannot be covered by the price of energy consumers can afford to pay.


Meanwhile, the skyrocketing debt required to keep the entire status quo glued together is sapping income, reducing the every participants’ ability to pay for future growth.


These realities leave three possible futures:


  1. Energy prices move beyond what’s affordable, and the system breaks.

  2. Debt service costs rise above what’s affordable, and the system breaks.

  3. Both energy and debt service costs rise in tandem, and the system breaks. 

Magic Technology and Wishful Thinking to the Rescue


The consensus solutions to increasingly unaffordable energy are technological: new technologies are going to make energy abundant and so cheap it’s practically free.


While it’s true that there are many alternative energy technologies in development, the reality is few make financial sense and few have the potential to scale up rapidly enough to replace oil/coal/natural gas.


Take liquid fluoride thorium reactors. The consensus is that this form of nuclear energy is reliable and safe. Yet not a single working thorium reactor is in operation. (An update on the potential of LFTR power - PeakProsperity.com)


How about all those solar power technologies that are going to make electricity abundant and cheap everywhere? Magical thinking is appealing, but the reality is wind and solar make up roughly 2% of all energy consumed globally. These could double, triple, quadruple and then double again, and they wouldn"t even begin to replace fossil fuels.


Even if wind/solar became dirt-cheap to manufacture, install and maintain (in the real world, we have to measure total life-cycle costs, not just the initial purchase price), these alt energy sources are intermittent, and that"s a big problem for two reasons:


1. Batteries are not “free” and current technologies rely on scarce resources (lithium, etc.)


2. Utilities need to maintain significant power generation capacity to replace these sources during night, cloudy days, when the wind decreases, etc.


This means the entire infrastructure of fossil-fuel generated electricity must be maintained--a very costly requirement.


The other problem with the “electricity and storage will be nearly free” line of magical thinking is much of our transport system can"t be switched to electricity--aircraft, container ships, etc.


Virtually every optimistic vision of a cheap, abundant energy future overlooks these problems, or assumes each will effortlessly be solved with some new whiz-bang technology that just so happens to be dirt-cheap.


But not all technologies that work on in lab are affordable and not all technologies scale from the lab to production on a global scale.


Maybe some lab will invent a battery based on a cheap, abundant resource like silicon, but the process of manufacture may still be horrendously expensive, i.e. require a lot of energy and costly machinery. Even if batteries can be manufactured at a low cost, they’re only serving the 2% of total energy being generated by intermittent sources.


Technological solutions are always the "answer," but the actual costs of scaling up new technologies to offset the decline in conventional oil is ignored or glossed over.


If scaling up a new energy source bankrupts consumers and producers alike, is it a solution?


Magical Thinking: Debt Doesn’t Matter


The other line of magical thinking is that debt doesn’t matter, because future growth will always provide us with enough income to service debt.  As noted above, the structural stagnation of earned income means this assumption is no longer valid.


The next line of defense is that super-low interest rates will make debt practically weightless.  But back in the real world, we find even interest rates near zero eventually burden governments and economies. Consider Japan, which has been running a 25+ year experiment in “debt doesn’t matter.” In 2015, the cost of servicing its astronomical debt was the largest single item in the government’s budget:


If this is the result of near-zero .1% interest rates, imagine the eventual impact of 1% or (gasp) 2% interest rates—never mind 4% or higher.


Let’s also consider the central bank balance sheet and policy that undergirds this hyper-expansion of debt.  This is a chart of the Bank of Japan’s balance sheet. If this looks sustainable to you, hmm, you might want to dial back your happy-meds:


And what good came of this unprecedented expansion of central bank “monetary easing”? The net result is a near-zero growth stagnant economy burdened with exploding debt remained glued together, arguably rescued not by the central bank but by the collapse of energy prices and the one-off expansion of China’s economy.


These realities force fact-based observers into pondering a future that consumes less energy per person and generates less income and debt per person--a DeGrowth economy.


The status quo—highly centralized, dominated by self-serving elites gorging on a highly unequal distribution of wealth and income--cannot survive a structural decline in earned income and the resulting collapse of debt, or a reduction in energy consumption per capita.  But humanity could do just fine.


In Part 2: A Blueprint For DeGrowth, we provide the blueprint for a DeGrowth economy that’s more sustainable than the status quo, and that leaves magical thinking at the door.


The economic/political paradigm of rising energy consumption and debt required to keep the whole status quo glued together is going away.  We can’t retain the existing socio-political-financial structures of this paradigm and expect to get different results; that’s a pretty good definition of insanity.


We need new models; not just for energy consumption and distribution, but for the creation and distribution of currency and political power. The good news is: they"re out there.


Click here to read the report (free executive summary, enrollment required for full access)

Tuesday, March 14, 2017

Visualizing America's Changing Energy Mix

Today’s chart plots data from the Energy Information Administration (EIA) to show America’s changing energy mix, along with their projected mix for 2030.


Visual Capitalist"s Jeff Desjardins points out that it shows the total amount of energy used each year, along with energy use per capita. It then breaks down each year’s energy supply by source, which provides another way for us to visualize the decline of coal use, the resurgence in natural gas, and the rise of renewable energy.


Energy use per capita is measured in “gallons of gasoline equivalent per day”, which we thought was easy to relate to. (For our metric friends, a U.S. gallon is just less than four litres.)


Interestingly, solar and wind only make up about 2% of energy today according to the EIA, and they are projected to combine for 6% by 2030.


Various organizations have criticized these numbers, suggesting that the EIA is not properly accounting for green energy in America – and that it actually supplies a much bigger part of the energy mix.

Thursday, February 9, 2017

Energy Consumption Vs. Core Populations - Trending Down Together

Submitted by Chris Hamilton via Econimica blog,


In this article, I want to spend a little time reviewing two of the most relatively reliable data sets, population size/growth and energy consumption/growth.  I"ll compare the total energy consumption of nations / groupings of nations vs. their core (25-54yr/old) employed populations and total core (25-54yr/old) populations.


What"s the point?  We are in the midst of a structural, secular change and policy makers / central bankers insistence that it is just a transitory issue in need of more rate cuts and more credit to ""restart the economy" is absolutely ridiculous.  This is the story of cause (declining population, where it counts) and effect, declining energy consumption and economic activity.  And this is about to really pick up speed to the downside (more on that, China, below).  Plus, we can ponder if real economic "growth" coincident with declining consumption of energy is possible...or is that growth just debt and financialization?  Also keep in mind while viewing the charts and data below, if not for the twenty six years of Federal Reserve (& CB"s worldwide) interest rate cuts incenting all the debt creation, energy consumption would have begun declining long ago.


US-


Below, total US energy consumption (quadrillion BTU"s) vs. core employees.  Correlation?  Causation?  Anyway, just is what it is.  The US consumes 18% of global energy but US total energy consumption has been falling since 2007 and is now back to where it was 17 years ago, in 1999....likewise, the total number of 25-54yr/old employees peaked in "07 and is now back to 1999 levels.


Below, same as above but added core population through 2025 (UN assumes, perhaps wrongly, continued levels of immigration to achieve that slight population growth from now through 2025).


JAPAN -


Below, core employees vs. total energy consumption.  Japan consumes 3.5% of global energy.  Japan"s total energy consumption peaked in "06 and is now back to total levels last seen in 1992...and the total number of Japan"s core population now employed is on par with total employed in 1982.


Below, same as the above, but with core population through 2030...by 2030, there will be fewer in the core population than are total core employees now.  For a highly levered economy, disaster.


EU -


I have more difficulty finding employee data on the EU...so 25-54yr/old population vs. the energy data I can gather.  The EU consumes 14.4% of global energy.  Present EU energy consumption is now on par with levels last seen in the 1980"s.


For reference, below is the Italian core employment vs. total Italian energy consumption, as an example of what much of the EU looks like.


CHINA -


You are welcome to draw your own conclusions what the data below portends for China.  Core population vs. total Chinese energy consumption (China consumes 22% of global energy).


Taking the above on an annual change basis (chart below)...annual change in core population vs. annual change in total energy consumption.  Couple points should be evident, China"s massive growth in energy from 2000 onward was entirely against their population trends (or simply a massive credit fueled misallocation).  In the most recent year available for energy data, 2014, the Chinese core population was still growing by 10+ million annually and despite obscene debt creation, energy consumption stalled.  This year the core will only grow by 2.6 million...and soon  the massive secular contraction begins.  The implications for energy and economic growth are simply put, dire.


But the world was driven by the Chinese misallocation of capital (debt).  The chart below shows total annual change in energy consumption, China vs. the World (ex-China).  The importance of China since 2000 cannot be overstated.


From 2000-->2011, China was responsible for 55% of global growth in energy consumption...but stranger still, since China"s energy growth collapsed from 2012-->2014, China"s % of global growth in energy has increased to account for nearly 65% of all energy growth.  Or said more simply, without Chinese growth, there is no growth.  And against a collapsing core population, Chinese energy consumption (despite mountains of misallocated debt) is set to fall significantly.


Feel free to draw your own conclusions...as for me, the chart below showing Chinese annual 15-64yr/old population change (which has now turned negative), rising oil consumption via a parabolic spiral of debt is an aberration awaiting a rude return to normalcy.


INDIA-


Just to round things out...India uses 4.5% of global energy but strangely, from 2012-->2014 India"s energy consumption has declined by 7%...as if they are being pulled into the gravity of China"s credit supernova.


EURASIA-


Eurasia, with Russia at it"s heart, uses 8% of global energy.  It has some of the lowest population growth and it"s total energy consumption is essentially, amazingly, unchanged since 1980.


CENTRAL & S. AMERICA-


Central and South America account for 5.5% of global energy consumption...and their population growth trends are slowing quickly.  Brazil"s core will peak around 2030 and begin it"s long, secular decline.


AFRICA-


As for the center of all population growth, Africa, the continent uses 3% of global energy (up from 2% in 1980) but has grown at less than half the rate seen in China since 1980.  Unfortunately for Africa and the world, on a global economic basis, Africa doesn"t matter...detailed HERE.


For those interested, why America awaits it"s own, very painful, return to normalcy outlined HERE.

Wednesday, February 1, 2017

Destroying The "Wind & Solar Will Save Us" Delusion

Submitted by Gail Tverberg via Our Finite World blog,


The “Wind and Solar Will Save Us” story is based on a long list of misunderstandings and apples to oranges comparisons. Somehow, people seem to believe that our economy of 7.5 billion people can get along with a very short list of energy supplies. This short list will not include fossil fuels. Some would exclude nuclear, as well. Without these energy types, we find ourselves with a short list of types of energy — what BP calls Hydroelectric, Geobiomass (geothermal, wood, wood waste, and other miscellaneous types; also liquid fuels from plants), Wind, and Solar.


Unfortunately, a transition to such a short list of fuels can’t really work. These are a few of the problems we encounter:


[1] Wind and solar are making extremely slow progress in helping the world move away from fossil fuel dependence.


In 2015, fossil fuels accounted for 86% of the world’s energy consumption, and nuclear added another 4%, based on data from BP Statistical Review of World Energy. Thus, the world’s “preferred fuels” made up only 10% of the total. Wind and solar together accounted for a little less than 2% of world energy consumption.


Figure 1. World energy consumption based on data from BP 2016 Statistical Review of World Energy.

Figure 1. World energy consumption based on data from BP 2016 Statistical Review of World Energy.


Our progress in getting away from fossil fuels has not been very fast, either. Going back to 1985, fossil fuels made up 89% of the total, and wind and solar were both insignificant. As indicated above, fossil fuels today comprise 86% of total energy consumption. Thus, in 30 years, we have managed to reduce fossil fuel consumption by 3% (=89% – 86%). Growth in wind and solar contributed 2% of this 3% reduction. At the rate of a 3% reduction every 30 years (or 1% reduction every ten years), it will take 860 years, or until the year 2877 to completely eliminate the use of fossil fuels. And the “improvement” made to date was made with huge subsidies for wind and solar.


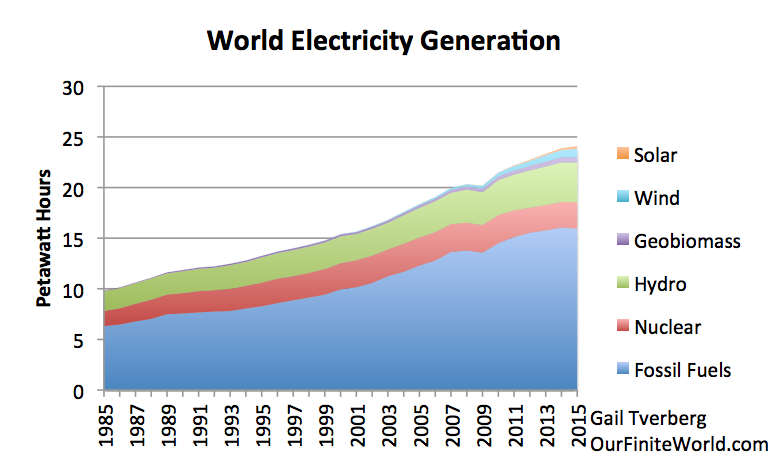
Figure 2. World electricity generation by source, based on BP 2016 Statistical Review of World Energy.

Figure 2. World electricity generation by source based on BP 2016 Statistical Review of World Energy.


The situation is a little less bad when looking at the electricity portion alone (Figure 2). In this case, wind amounts to 3.5% of electricity generated in 2015, and solar amounts to 1.1%, making a total of 4.6%. Fossil fuels account for “only” 66% of the total, so this portion seems to be the place where changes can be made. But replacing all fossil fuels, or all fossil fuels plus nuclear, with preferred fuels seems impossible.


[2] Grid electricity is probably the least sustainable form of energy we have.


If we are to transition to a renewables-based economy, we will need to transition to an electricity-based economy, since most of today’s renewables use electricity. Such an economy will need to depend on the electric grid.


The US electric grid is often called the “World’s Largest Machine.” The American Society of Civil Engineers gives a grade of D+ to America’s energy system. It says,


America relies on an aging electrical grid and pipeline distribution systems, some of which originated in the 1880s. Investment in power transmission has increased since 2005, but ongoing permitting issues, weather events, and limited maintenance have contributed to an increasing number of failures and power interruptions.


Simply maintaining the electric grid is difficult. One author writes about the challenges of replacing aging steel structures holding up power lines. Another writes about the need to replace transformers, before they fail catastrophically and interrupt services. The technology to maintain and repair the transmission lines demands that fossil fuels remain available. For one thing, helicopters are sometimes needed to install or repair transmission lines. Even if repairs are done by truck, oil products are needed to operate the trucks, and to keep the roads in good repair.


Electricity and, in fact, electricity dispensed by an electric grid, is in some sense the high point in our ability to create an energy product that “does more” than fossil fuels. Grid electricity allows electric machines of all types to work. It allows industrial users to create very high temperatures, and to hold them as needed. It allows computerization of processes. It is not surprising that people who are concerned about energy consumption in the future would want to keep heading in the same direction as we have been heading in the past. Unfortunately, this is the expensive, hard-to-maintain direction. Storms often cause electrical outages. We have a never-ending battle trying to keep the system operating.


[3] Our big need for energy is in the winter, when the sun doesn’t shine as much, and we can’t count on the wind blowing.


Clearly, we use a lot of electricity for air conditioning. It is difficult to imagine that air conditioning will be a major energy use for the long-term, however, if we are headed for an energy bottleneck. There is always the possibility of using fans instead, and living with higher indoor temperatures.


In parts of the world where it gets cold, it seems likely that a large share of future energy use will be to heat homes and businesses in winter. To illustrate the kind of seasonality that can result from the use of fuels for heating, Figure 3 shows a chart of US natural gas consumption by month. US natural gas is used for some (but not all) home heating. Natural gas is also used for electricity and industrial uses.


Figure 3. US natural gas consumption by month, based on US Energy Information Administration.

Figure 3. US natural gas consumption by month, based on US Energy Information Administration.


Clearly, natural gas consumption shows great variability, with peaks in usage during the winter. The challenge is to provide electrical supply that varies in a similar fashion, without using a lot of fossil fuels.


[4] If a family burns coal or natural gas directly for winter heat, but then switches to electric heat that is produced using the same fuel, the cost is likely to be higher. If there is a second change to a higher-cost type of electricity, the cost of heat will be even greater.  


There is a loss of energy when fossil fuels or biomass are burned and transformed into electricity. BP tries to correct for this in its data, by showing the amount of fuel that would need to be burned to produce this amount of electricity, assuming a conversion efficiency of 38%. Thus, the energy amounts shown by BP for nuclear, hydro, wind and solar don’t represent the amount of heat that they could make, if used to heat apartments or to cook food. Instead, they reflect an amount 2.6 times as much (=1/38%), which is the amount of fossil fuels that would need to be burned in order to produce this electricity.


As a result, if a household changes from heat based on burning coal directly, to heat from coal-based electricity, the change tends to be very expensive. The Wall Street Journal reports, Beijing’s Plan for Cleaner Heat Leaves Villagers Cold:


Despite electricity subsidies for residential consumers, villagers interviewed about their state-supplied heaters said their overall costs had risen substantially. Several said it costs around $300 to heat their homes for the winter, compared with about $200 with coal.


The underlying problem is that burning coal in a power plant produces a better, but more expensive, product. If this electricity is used for a process that coal cannot perform directly, such as allowing a new automobile production plant, then this higher cost is easily  absorbed by the economy. But if this higher-cost product simply provides a previously available service (heating) in a more expensive manner, it becomes a difficult cost for the economy to “digest.” It becomes a very expensive fix for China’s smog problem. It should be noted that this change works in the wrong direction from a CO2 perspective, because ultimately, more coal must be burned for heating because of the inefficiency of converting coal to electricity, and then using that electricity for heating.


How about later substituting wind electricity for coal-based electricity? China has a large number of wind turbines in the north of China standing idle.  One problem is the high cost of erecting transmission lines that would transport this electricity to urban centers such as Beijing. Also, if these wind turbines were put in place, existing coal plants would operate fewer hours, causing financial difficulties for these coal generating units. If these companies need subsidies in order to continue paying their ongoing expenses (including payroll and debt repayment), this would create a second additional cost. Electricity prices would need to be higher, to cover these costs as well. A family who had difficulty affording heat with coal-based electricity would have an even greater problem affording wind-based electricity.


Heat for cooking and heat for creating hot water are similar to heat for keeping an apartment warm. It is less expensive (both in energy terms and in cost to the consumer) if coal or natural gas is burned directly to produce the heat, than if electricity is used instead. This again, has to do with the conversion efficiency of turning fossil fuels to electricity.


[5] Low energy prices for the consumer are very important. Unfortunately, many analyses of the benefit of wind or of solar give a misleading impression of their true cost, when added to the electric grid. 


How should the cost of wind and solar be valued? It is simply the cost of installing the wind turbines or solar panels? Or does it include the all of the additional costs that an electricity delivery system must incur, if it is actually to incorporate this intermittent electricity into the electric grid system, and deliver it to customers where it is needed?


The standard answer, probably because it is easiest to compute, is that the cost is simply the cost (or energy cost) of the wind turbines or the solar panels themselves, plus perhaps an inverter. On this basis, wind and solar appear to be quite inexpensive. Many people have come to the conclusion that a transition to wind and solar might be helpful, based on this type of limited analysis.


Unfortunately, the situation is more complicated. Perhaps, the first few wind turbines and solar panels will not disturb the existing electrical grid system very much. But as more and more wind turbines or solar panels are added, there get to be additional costs. These include long distance transmission, electricity storage, and subsidies needed to keep backup electricity-generation in operation. When these costs are included, the actual total installed cost of delivering electricity gets to be far higher than the cost of the solar panels or wind turbines alone would suggest.


Energy researchers talk about the evaluation problem as being a “boundary issue.” What costs really need to be considered, when a decision is made as to whether it makes sense to add wind turbines or solar panels? Several other researchers and I feel that much broader boundaries are needed than are currently being used in most published analyses. We are making plans to write an academic article, explaining that current Energy Return on Energy Invested (EROEI) calculations cannot really be compared to fossil fuel EROEIs, because of boundary issues. Instead, “Point of Use” EROEIs are needed. For wind and solar, Point of Use EROEIs will vary with the particular application, depending on the extent of the changes required to accommodate wind or solar electricity. In general, they are likely to be far lower than currently published wind and solar EROEIs. In fact, for some applications, they may be less than 1:1.


A related topic is return on human labor. Return on human labor is equivalent to how much a typical worker can afford to buy with his wages. In [4], we saw a situation where the cost of heating a home seems to increase, as a transition is made from (a) burning coal for direct use in heating, to (b) using electricity created by burning coal, to (c) using electricity created by wind turbines. This pattern is eroding the buying power of workers. This direction ultimately leads to collapse; it is not the direction that an economy would generally intentionally follow. If wind and solar are truly to be helpful, they need to be inexpensive enough that they allow workers to buy more, rather than less, with their wages.


[6] If we want heat in the winter, and we are trying to use solar and wind, we need to somehow figure out a way to store electricity from summer to winter. Otherwise, we need to operate a double system at high cost.


Energy storage for electricity is often discussed, but this is generally with the idea of storing relatively small amounts of electricity, for relatively short periods, such as a few hours or few days. If our real need is to store electricity from summer to winter, this will not be nearly long enough.


In theory, it would be possible to greatly overbuild the wind and solar system relative to summer electricity needs, and then build a huge amount of batteries in order to store electricity created during the summer for use in the winter. This approach would no doubt be very expensive. There would likely be considerable energy loss in the stored batteries, besides the cost of the batteries themselves. We would also run the risk of exhausting resources needed for solar panels, wind turbines, and/or batteries.


A much more workable approach would be to burn fossil fuels for heat during the winter, because they can easily be stored. Biomass, such as wood, can also be stored until needed. But it is hard to find enough biomass for the whole world to burn for heating homes and for cooking, without cutting down an excessively large share of the world’s trees. This is a major reason why moving away from fossil fuels is likely to be very difficult.


[7] There are a few countries that use an unusually large share of electricity in their energy mixes today. These countries seem to be special cases that would be hard for other countries to emulate.


Data from BP Statistical Review of World Energy indicates that the following countries have the highest proportion of electricity in their energy mixes.


  • Sweden – 72.7%

  • Norway – 69.5%

  • Finland – 59.9%

  • Switzerland – 57.5%

These are all countries that have low population and a significant hydroelectric supply. I would expect that the hydroelectric power is very inexpensive to produce, especially if the dams were built years ago, and are now fully paid for. Sweden, Finland, and Switzerland also have electricity from nuclear providing about a third of each of their electricity supplies. This nuclear electricity was built long ago, and thus is now paid for as well. The geography of countries may also reduce the use of traffic by cars, thus reducing the portion of gasoline in their energy mixes. It would be difficult for other countries to create equivalently inexpensive large supplies of electricity.


In general, rich countries have higher electricity shares than poorer countries:


  • OECD Total – (Rich countries) – 2015 – 44.5%

  • Non- OECD (Less rich countries) – 2015 – 39.3%

China is an interesting example. Its share of energy use from electricity changed as follows from 1985 to 2015:


  • China – 1985 – 17.5%

  • China – 2015 – 43.6%

In 1985, China seems to have used most of its coal directly, rather than converting it for use as electricity. This was likely not difficult to do, because coal is easy to transport, and it can be used for many heating needs simply by burning it. Later, industrialization allowed for much more use of electricity. This explains the rise in its electricity ratio to 43.6% in 2015, which is almost as high as the rich country ratio of 44.5%. If the electricity ratio rises further, it will likely be because electricity is being put to use in ways where it has less of a cost advantage, or even has a cost disadvantage, such as for heating and cooking.


[8] Hydroelectric power is great for balancing wind and solar, but it is available in limited quantities. It too has intermittency problems, limiting how much it can be counted on. 


If we look at month-to-month hydroelectric generation in the US, we see that it too has intermittency problems. Its high month is May or June, when snow melts and sends hydroelectric output higher. It tends to be low in the fall and winter, so is not very helpful for filling the large gap in needed electricity in the winter.


Figure 4. US hydroelectric power by month, based on data of the US Energy Information Administration.

Figure 4. US hydroelectric power by month, based on data of the US Energy Information Administration.


It also has a problem with not being very large relative to our energy needs. Figure 5 shows how US hydro, or the combination of hydro plus solar plus wind (hydro+S+W), matches up with current natural gas consumption.


Figure 5. US consumption of natural gas compared to hydroelectric power and to compared to wind plus solar plus hydro (hydro+W+S), based on US Energy Information Administration data.

Figure 5. US consumption of natural gas compared to hydroelectric power and compared to hydro plus wind plus solar (hydro+W+S), based on US Energy Information Administration data.


Of course, the electricity amounts (hydro and hydro+S+W) are “grossed up” amounts, showing how much fossil fuel energy would be required to make those quantities of electricity. If we want to use the electricity for heating homes and offices, or for cooking, then we should compare the heat energy of natural gas with that of hydro and hydro+S+W. In that case, the hydro and hydro+S+W amounts would be lower, amounting to only 38% of the amounts shown.


This example shows how limited our consumption of hydro, solar, and wind is compared to our current consumption of natural gas. If we also want to replace oil and coal, we have an even bigger problem.


[9] If we need to get along without fossil fuels for electricity generation, we would have to depend greatly on hydroelectric power. Hydro tends to have considerable variability from year to year, making it hard to depend on.


Nature varies not just a little, but a lot, from year to year. Hydro looks like a big stable piece of the total in Figures 1 and 2 that might be used for balancing wind and solar’s intermittency, but when a person looks at the year by year data, it is clear that the hydro amounts are quite variable at the country level.


Figure 3. Electricity generated by hydroelectric for six large European countries based on BP 2016 Statistical Review of World Energy.

Figure 6. Electricity generated by hydroelectric for six large European countries based on BP 2016 Statistical Review of World Energy.


In fact, hydroelectric power is even variable for larger groupings, such as the six countries in Figure 6 combined, and some larger countries with higher total hydroelectric generation.


Figure 4. Hydroelectricity generated by some larger countries, and by the six European countries in Figure 3 combined.

Figure 7. Hydroelectricity generated by some larger countries, and by the six European countries in Figure 6 combined, based on BP 2016 Statistical Review of World Energy.


What we learn from Figures 6 and 7 is that even if a great deal of long distance transmission is used, hydro will be variable from year to year. In fact, the variability will be greater than shown on these charts, because the quantity of hydro available tends to be highest in the spring, and is often much lower during the rest of the year. (See Figure 4 for US hydro.) So, if a country wants to depend on hydro as its primary source of electricity, that country must set its expectations quite low in terms of what it can really count on.


And, of course, Saudi Arabia and several other Middle Eastern countries don’t have any hydroelectric power at all. Middle Eastern countries tend not to have biomass, either. So if these countries choose to use wind and solar to assist in electrical generation, and want to balance their intermittency with something else, they pretty much need to use something that is locally available, such as natural gas. Other countries with very low amounts of hydro (or none at all) include Algeria, Australia, Bangladesh, Denmark, Netherlands, and South Africa.


These issues provide further reasons why countries will want to continue using fossil fuels, and perhaps nuclear, if they can.


[10] There has been a misunderstanding regarding the nature of our energy problem. Many people believe that we will “run out” of fossil fuels, or that the price of oil and other fuels will rise very high. In fact, our problem seems to be one of affordability: energy prices don’t rise high enough to cover the rising cost of producing electricity and other energy products. Adding wind and solar tends to make the problem of low commodity prices worse.   


Ultimately, consumers can purchase only what their wages will allow them to purchase. Rising debt can help as well, for a while, but this has limits. As a result, lack of wage growth translates to a lack of growth in commodity prices, even if the cost of producing these commodities is rising. This is the opposite of what most people expect; most people have never considered the possibility that peak energy will come from low prices for all types of energy products, including uranium. Thus, we seem to be facing peak energy demand (represented as low prices), arising from a lack of affordability.


We can see the problem in the example of the Beijing family with a rising cost of heating its apartment. Economists would like to think that rising costs translate to rising wages, but this is not the case. If rising costs are the result of diminishing returns (for example, coal is from deeper, thinner coal seams), the impact is similar to growing inefficiency. The inefficient sector needs more workers and more resources, leaving fewer resources and workers for other more efficient sectors. The result is an economy that tends to contract because of growing inefficiency.


If we want to operate a double system, using wind and solar when it is available, and using fossil fuels at other times, the cost will be very high. The problem arises because the fossil fuel system has many fixed costs. For example, coal mines and natural gas companies need to continue to pay interest on their loans, or they will default. Pipelines need to operate 365 days per year, regardless of whether they are actually full. The question is how to get enough funding for this double system.


One pricing system for electricity that doesn’t work well is the “market pricing system” based on each producer’s marginal costs of production. Wind and solar are subsidized, so they tend to have negative marginal costs of production. It is impossible for any other type of electricity producer to compete in this system. It is well known that this system does not produce enough revenue to maintain the whole system.


Sometimes, additional “capacity payments” are auctioned off, to try to fix the problem of inadequate total wholesale electricity prices. If we believe the World Nuclear Organization, even these charges are not enough. Several US nuclear power plants are scheduled for closing, indirectly because this pricing methodology is making older nuclear power plants unprofitable. Natural gas prices have also been too low for producers in recent years. This electricity pricing methodology is one of the reasons for this problem as well, in my opinion.


A different pricing system that works much better in our current situation is the utility pricing system, or “cost plus” pricing. In this system, prices are determined by regulators, based on a review of all necessary costs, including appropriate profit margins for producers. In the case of a double system, it allows prices to be high enough to cover all the needed costs, including the extra long distance transmission lines, plus all of the high fixed costs of fossil fuel and nuclear power plants, operating for fewer hours per year.


Of course, these much higher electricity rates eventually will become unaffordable for the consumer, leading to a cutback in purchases. If enough of these cutbacks in purchases occur, the result will be recession. But at least the electricity system doesn’t fail at an early date because of inadequate profits for its producers.


Conclusion


The possibility of making a transition to an all-renewables system seems virtually impossible, for the reasons I have outlined above. I have outlined many other issues in previous posts:


The topic doesn’t seem to go away, because it is appealing to have a “solution” to what seems to be a predicament with no solution. In a way, wind and solar are like a high-cost placebo. If we give these to the economy, at least people will think we are treating the problem, and maybe our climate problem will get a little better.


Meanwhile, we find more and more real life problems with intermittent renewables. Australia has had a series of blackouts. A several-hour blackout in South Australia was tied partly to the high level of intermittent energy on the grid. The ways of reducing future recurrences appear to be very expensive.


Antonio Turiel has written about the problems that Spain is encountering. Spain added large amounts of wind and solar, but these have not been available during a recent cold spell. It added gas by pipeline from Algeria, but now Algeria has cut back on the amount it is supplying. It has added transmission lines north to France. Now, Turiel is concerned that Spain’s electricity prices will be persistently higher, because he believes that France has not taken sufficient preparations to meet its own electricity needs. If there were little interconnectivity between countries, France’s electricity problems would stay in France, rather than adversely affecting its neighbors. A person begins to wonder: Can transmission lines have an adverse impact on new electricity supply? If a country can hope that “the market” will supply electricity from elsewhere, does that country take adequate steps to provide its own electricity?


In my opinion, the time has come to move away from believing that everything that is called “renewable” is helpful to the system. We now have real information on how expensive wind and solar are, when indirect costs are included. Unfortunately, in the real world, high-cost is ultimately a deal killer, because wages don’t rise at the same time. We need to understand where we really are, not live in a fairy tale world produced by politicians who would like us to believe that the situation is under control.