Showing posts with label American Society of Civil Engineers. Show all posts

Wednesday, December 6, 2017

THE BLIND CONSPIRACY: The Gold Market Is Heading Towards A Big Fundamental Change

SRSrocco


By The SRSrocco Report,


SRSrocco


The gold market is heading towards a big fundamental change that few are prepared.  While many analysts in the alternative media community suggest that the gold price is manipulated due to Fed and Central bank intervention, there is another more obscure rationale that is the likely culprit.  I call it, "The Blind Conspiracy."


But, before I get into the details of this Blind Conspiracy, there are a few very troubling developments in the alternative media community that I would like to discuss first.  The bulk of these concerns has to do with the increasing amount of faulty analysis and misinformation as well as the peddling of lousy conspiracy theories on the internet.


Why is this a big problem?  Because a lot of readers are being misguided as to the true nature of the serious predicament we are facing.  Half of the emails that I receive are from readers who are bringing up doubts based on other analysts" faulty analysis and misinformation.  Thus, it takes a great deal of effort to provide the real facts and data to counteract the damage being done by certain individuals, even those with good intentions.


Furthermore, an increasing number of so-called precious metals analysts have switched over to Bitcoin and other cryptocurrencies, believing that gold and silver will no longer function as monetary metals.  However, some of these analysts suggest that silver will still be valuable because it will be used as critical raw material in advanced products in our new HIGH-TECH WORLD.  I find this idea of a future modern high-tech world quite amusing when we can"t even maintain the failing complex infrastructure we are currently using.


American Society Of Civil Engineers 2017:  U.S. Infrastructure Grade Is...???


According to the Amercian Society Of Civil Engineers, ASCE, they just came out with their grade this year for U.S. infrastructure.  Does anyone want to guess what overall grade we received here in the good ole U.S. of A?  The ASCE gave us a D+:


Well, at least a D+ isn"t an "F" grade.  Here is the ASCE"s Infrastructure Report Card Grading Scale for receiving a "D":


"D" GRADE = POOR, AT RISK
The infrastructure is in poor to fair condition and mostly below standard, with many elements approaching the end of their service life. A large portion of the system exhibits significant deterioration. Condition and capacity are of serious concern with strong risk of failure.


The ASCE U.S. Infrastructure Report also provides separate grades for different aspects of U.S. infrastructure.  For example, the U.S. Energy Infrastructure received a "D+" as well.  This is a brief description of the Energy Infrastructure:


Much of the U.S. energy system predates the turn of the 21st century. Most electric transmission and distribution lines were constructed in the 1950s and 1960s with a 50-year life expectancy, and the more than 640,000 miles of high-voltage transmission lines in the lower 48 states’ power grids are at full capacity.


Moreover, the report states that $4.5 trillion needs to be invested 2016-2025 to raise the U.S. infrastructure to a "B" Grade.  However, only $2.5 trillion has been budgeted.  Thus, we are $2 trillion short of the total amount needed.  Regardless, I doubt we will be able to spend anywhere close to the budgeted $2.5 trillion over the next decade for our infrastructure.  Unfortunately, I see the U.S. Government and private sector running into serious financial trouble by 2020 as the massive amount of debt and derivatives finally take down the system.


So, the question remains.  How are we going to move into a new HIGH-TECH world if we can"t even maintain our current infrastructure?


The notion that we can bring on some new "Energy Technology" fails to consider the tremendous amount of raw materials, manufacturing, transportation, and logistics to repair and maintain our current infrastructure.  You see, we have much bigger problems than just replacing an energy source or technology.  But, to understand that principle, you must look past superficial thinking and "Silver-Bullet energy technologies."


Now, if you hear certain analysts suggesting that gold and silver will no longer be used as money in the future because cryptocurrencies will take over the monetary role in our new high-tech world, you may want to contact them and provide the link to the U.S. Infrastructure D+ Grade Report.


Destroying Once Again.... Certain Myths About The Gold Market


If I collected an ounce of gold for every email that I have received about patently false gold myths and conspiracies; I could buy one hell of a lot of silver....LOL.  Gosh, if I went back to my email folder and added up all the emails on this subject, it would number well over 500 in my ten years publishing articles in the alternative media community.  However, I continue to receive the same type of emails because individuals are still being misled.


Before I begin, let me say that I focus my work on disproving the faulty analysis by other individuals, and not directing anything negative towards the person.  I am adamantly against the idea of "targeting the messenger."  Rather, I like to target the faulty message.  So, there is nothing personal in my attempt to set the record straight.


Let me start off by saying.... THERE AREN"T MILLIONS OF TONS OF HIDDEN GOLD in the world.  Anyone who continues to believe this needs to pay close attention to the following information.


One of my readers sent me the following recent YouTube video by Bix Weir, titled "Vast Gold Riches Hidden In The Grand Canyon":


In the video, Bix quotes a New York Times article published on June 19, 1912, that proclaimed vast gold riches in the Grand Canyon.  According to Bix, this massive gold find is what prompted the starting of the Federal Reserve because billions of ounces of new gold from the Grand Canyon dumped into the market would destroy the monetary system.


While this may sound plausible to the layman, if we carefully read the article and do some additional research, we will come to a much different conclusion than what Mr. Weir is suggesting.


First, Bix makes a grave error during the interview when he states "billions of ounces of gold," rather than "billions of Dollars of gold."  Here is the segment of the article:


There"s a big difference between a billion ounces of gold and a billion dollars worth of gold.  For example, the market price of gold in 1912 was $20.65 an ounce.  If we assume that $2 billion worth of gold was extracted from the Grand Canyon, it would equal approximately 100 million oz of gold.  If we take it a step further and convert it to metric tons, it would equal 3,110 metric tons.... a figure much much lower than one million tons stated by Mr. Weir.


Second, the article provides us with an idea of the very low quality of the gold found in the silt on the banks of the Grand Canyon:


As we can see, the individual in charge of the mining operation in the Grand Canyon stated that the value of gold was worth 50 cents per yard.  When gold miners refer to a "yard," they mean a cubic yard or a volume that equals 1.3 tons.  With an ounce of gold worth $20 in 1912, 50 cents a yard is a tiny amount of gold.  Thus, 50 cents worth of gold in a yard is approximately 0.025 oz or one-fortieth of an ounce of gold.


Let"s compare the supposed vast Grand Canyon gold riches worth 50 cents a yard to the gold mining that took place in Alaska during the same period.  According to the data provided by the U.S. Bureau of Mines in 1912 Report:


This chart represents "Placer" gold mining in Alaska, which was the same type of gold mining that took place on the banks of the Grand Canyon.  Placer gold mining is the process of washing gold from gravel, sand or silt.  Lode mining is extracting gold ores from veins in rock.  Here we can see that the average value of gold recovered in Alaska in 1912 was $2.10 per cubic yard.  Now, why on earth would anyone want to go to the remote location in the Grand Canyon and mine gold for 50 cents a yard when you could receive four times as much in Alaska???  Please, someone forward that information to Mr. Weir.


Third, the notion of extracting Billions of Dollars of gold from the Grand Canyon fails logistics miserably.  Let"s overlook  Mr. Weir"s error in quoting billions of ounces of gold rather than billion dollars of gold and consider the tremendous logistics of mining that amount gold out of the Grand Canyon.  According to the same U.S. Bureau of Mines 1912 Report linked above, Alaska produced a total of 7.4 million oz of gold worth $154 million between 1880 and 1912:


So, in over three decades of mining placer gold in Alaska, the total amount was $154 million.  Furthermore, the value of the gold per yard was likely much higher between 1880-1900.  Regardless, it took a great deal of human resources, energy, and capital to produce the $154 million worth of gold and the most ever produced in one year during that time-period in Alaska, was 1,066,000 oz of gold in 1906 valued at over $22 million.


Which brings us to the next logical conclusion.... was it ever possible for anyone to produce billions of dollars worth of gold valued at 50 cents a yard in the Grand Canyon when a small percentage of that amount ($154 million) took over three decades to produce in Alaska?  Hell, even during the mighty California Gold Rush of 1848, the peak year of 3.9 million ounces in 1852 was only worth $80 million.  However, the average annual gold production for the California gold rush was only 1.3 million ounces per year valued at $26 million.  It would take a great deal of time mining gold during the famous California Gold Rush to equal just $1 billion.


Even at $1 billion, that is only 50 million oz of gold or a measly 1,555 metric tons of gold.  Again, nowhere near the one million tons of gold suggested by Mr. Weir.


Lastly, the supposed vast gold riches in the Grand Canyon came to a dismal end.  That"s correct.  If we spent a few minutes doing a bit of research on the internet, we would find out The Rest Of The Ugly Story.


(American Placer Gold - Spencer Mining Operation 1911, Grand Canyon)


According to Arizona State history of gold mining at Lee Ferry in the Grand Canyon, the American Placer Gold company needed coal to process the gold.  Unfortunately, the only coal seam was 28 miles away.  So, the gold mining investors decided to incorporate a steamboat to transport the coal:


Investors decided a 92-foot steamboat would improve coal transport and gold production; it was ordered and assembled by late February 1912. Dubbed the Charles H. Spencer, the steamboat performed the way it was supposed to, but it burned most of the coal it transported in the process. Spencer also had trouble with his amalgamator and by 1912 his investors had seen enough and shut the project down. Spencer left, and his boat sank to the bottom of the Colorado River. The Charles H. Spencer is now on the National Register of Historic Places as a shipwreck in Arizona.


Just consider for a moment the type of intellectual thought process taken by these investors who couldn"t understand that the steamboat would consume most of the coal during its 28-mile trip.


Thus, the LIFE & DEATH of the Great Vast Gold Riches in the Grand Canyon came to an abrupt end, not because there were billions of ounces of gold that would destroy the global monetary system, but rather due to the typical mistake made by investors.  And that is... the belief that utterly incompetent management and miners could extract low-quality gold that is uneconomical to produce.


So, if we look at the New York Times article that Mr. Weir quotes as his source of billions of ounces of gold, we can logically assume that it was likely written by the company spokesman to get more POOR UNWORTHY INVESTOR SLOBS to purchase the American Placer Gold stock before it went belly-up.  It"s called the PUMP and DUMP.... a shady stock marketing technique that has been going on for hundreds of years.


If we can have an open mind and the ability to discern fact from fiction or lousy conspiracy theories, we can finally put an end to the notion that the world has a Million Tons of Hidden Gold in the world.


THE BLIND CONSPIRACY:  The Gold Market Is Heading Towards A Big Fundamental Change


Now that we have dispensed with certain conspiracies that don"t pass the smell test, there is a real one that very few are aware.  I call it the BLIND CONSPIRACY.  The interesting thing about this conspiracy is that nobody really knows about it.  However, it behaves like a conspiracy because many individuals and parties are manipulating the market which is providing a false sense of security to the average investor.


Thus, investors with a false sense of security, continue to invest in STOCKS, BONDS, and REAL ESTATE at amazing inflated values.  Today, the Dow Jones hit a new record high of 24,272 points:


If you look at this chart of the Dow Jones Index, it is starting to resemble the Bitcoin chart.  However, Bitcoin"s graph is moving up at a level  ten times more insane than the Dow Jones Index:


While the Dow Jones Index increased 4,200 points, or 21% since the beginning of 2017, the Bitcoin price has surged more than $9,000, or a staggering 1,125% increase.  Furthermore, the Bitcoin price doubled in just the past month.  This is completely insane.  Even though a lot of Bitcoin enthusiasts are shouting for $20,000 and $100,000 Bitcoin, if we are ever going to get there, there needs to be a serious correction first.  However, we may have already seen the top of Bitcoin at $11,400.


Folks, nothing goes straight up and then continues even higher.  I would be very cautious about investing in Bitcoin at this time.  Both the stock market and cryptocurrencies are extremely overbought... to say the least.  On the other hand, gold and silver have been selling off over the past several days and are even closer to their lows and cost of production.


Getting back to the Blind Conspiracy and the Big Fundamental Change in the gold market, investors are entirely in the dark about the dire energy predicament we are facing.  I continue to receive emails from individuals in various industries that tell me the "Situation is MUCH WORSE than you realize."  Also, there are good CLUES published in the media if you are IN-TUNE to this information.


According to this jewel, titled Oil Major: 70% Of Crude Can Be Left In The Ground, by Nick Cunnigham:


“A lot of fossil fuels will have to stay in the ground, coal obviously … but you will also see oil and gas being left in the ground, that is natural,” Statoil’s CEO Eldar Saetre told Reuters in an interview. “At Statoil we are not pursuing certain types of resources, we are not exploring for heavy oil or investing in oilsands.


If heavy oil and oil sands are to be left unproduced, then a lot of oil will need to stay in the ground. According to the USGS, about 70 percent of the world’s discovered oil reserves are in the form of heavy oil and bitumen. Much of that comes from Venezuela – one of the last places in the world that an oil company wants to do business in these days – and Canada.


Last year, Statoil abandoned Canada’s oil sands, selling off its assets to Athabasca Oil Corp. But Statoil is hardly alone in the exodus. ConocoPhillips unloaded a whopping $13.3 billion of oil sands assets to Cenovus Energy earlier this year. Shell sold off $4.1 billion in oil sands assets to Canadian Natural Resources. Meanwhile, ExxonMobil wrote off 3.5 billion barrels of oil sands from its book in February, admitting that they were unviable in today’s market.


ConocoPhillips’ CEO said that it would no longer invest in any oil project that needs a breakeven price of $50 or higher, according to the FT.


If the Major Oil Industry believes that upwards of 70% of the oil reserves should be left in the ground, how much do we really have left to produce??  Furthermore, it was quite surprising to see that the ConocoPhillips CEO said they would no longer invest in oil projects with a breakeven above $50.  Folks, there aren"t many oil discoveries available with a price tag less than $50 a barrel.


Again, the clues are all around.  Let me repost the completely awful financial results by the second largest natural gas producer in the United States.  Chesapeake Energy produced the second highest amount of natural gas during the first nine months of 2017 at 2.9 billion cubic feet per day compared to ExxonMobil"s 3.1 billion cubic feet per day.  So, what benefit did Chesapeake receive for producing the country"s second largest amount of natural gas?  Take a look at the Q3 2017 Cash Flow Statement:


After everything was considered, Chesapeake"s operations provided $273 million in cash (shown in the highlighted yellow).  For those who are not familiar with Cash Flow Statements, we subtract capital expenditures from cash from operations to arrive at their FREE CASH FLOW.  Unfortunately for Chesapeake, they spent a staggering $1.6 billion (highlighted in blue) on drilling and completion costs (capital) to produce their natural gas and oil.  Thus, Chesapeake"s Free Cash Flow was a negative $1.3 billion.


That would have been terrible news if it wasn"t for the sale of properties of worth $1,193 million ($1.2 billion.. two lines below the highlighted blue line).  Which means, the financial wizards at Chesapeake used asset sales to help pay for their natural gas drilling capital expenditures.  How long can Chesapeake sell properties to fund their drilling costs??


Are we starting to get a PICTURE here?  Regrettably, even highly trained energy analysts do not understand that the oil and gas industry is cannibalizing itself just to stay alive.  If investors do not understand just how bad our energy situation has become, they are BLINDLY investing in the worst assets (STOCKS, BONDS & REAL ESTATE) that derive their value from the burning of ENERGY.


This is the BLIND CONSPIRACY.  It"s taking place right in front of our eyes, and virtually no one sees it.


We are going to experience a Massive Fundamental Change in the gold market because investors will finally begin to understand what a true store of wealth is versus one that is an ENERGY IOU.  Stocks, Bonds, and Real Estate get their value from burning energy IN THE FUTURE, while a gold or silver coin bought today, received its value from burning energy IN THE PAST.  That is a big difference that investors, even precious metals investors fail to realize.


Lastly, if you want to pay more for precious metals, than I suggest you don"t check out our PRECIOUS METALS INVESTING section or our new LOWEST COST PRECIOUS METALS STORAGE page.


Check back for new articles and updates at the SRSrocco Report.

Monday, June 19, 2017

Stunning Footage Of American's Crumbling Infrastructure

Via StockBoardAsset.com,


It’s no secret that America’s infrastructure is in dire need of repairs. Earlier this year, America received her infrastructure report card from the American Society of Civil Engineers’ and received a repulsive D+. The ASCE guesstimates the US would need to spend $4.5 trillion by 2025 on infrastructure.


Here’s the breakdown of the report card:  


  • Aviation: D

  • Bridges: C+

  • Dams: D

  • Drinking Water: D

  • Energy: D+

  • Hazardous Waste: D+

  • Inland Waterways: D

  • Levees: D

  • Parks and Recreation: D+

  • Ports: C+

  • Rail: B

  • Roads: D

  • Schools: D

  • Solid Waste: C+

  • Transit: D-

  • Wastewater: D+

With that being said, I’ve spent the entire weekend inspecting America’s infrastructure at the Port of Baltimore.


At some locations, I was given special access to a behind the scenes view of America’s crumbling infrastructure that the public is not allowed to see. The reasons you’re left out of the know is because it destroys the mainstream narrative that everything is awesome.


Even Jack Ma, the founder of Alibaba Group says, “the US wasted trillions on warfare instead of investing in infrastructure”.


In the Sunday Edition, Alastair Williamson is on site at a marine terminal in the Port of Baltimore. He provides an interesting view of America’s deteriorating infrastructure blended with the current shape of the US economy.


In this video, Alastair is given special access to behind the scenes of America’s crumbling infrastructure. This view is rarely seen by the mainstream public. Enjoy!


Saturday, March 25, 2017

The Sad State Of America's Infrastructure In One Infographic

Every year, Americans spend a combined 600,000 years stuck in traffic, and Visual Capitalist"s Jeff Desjardins notes, if you’re thinking that time could be spent a little more productively, you’re not the only one.


In fact, even politicians are taking notice of aging and insufficient infrastructure in the United States. Recently, President Trump has started mapping out his $1 trillion plan to rebuild the country’s roads, bridges, and airports – and it is worth mentioning that infrastructure spending was also a key component of Bernie Sanders’ platform as well.


A LOOK AT AMERICA’S INFRASTRUCTURE


Today’s infographic is from HighTide Technologies, and it dives into the infrastructure situation in the United States, including a comparison of federal and state spending.


According to the American Society of Civil Engineers, the United States currently has an “infrastructure gap”. If the discrepancy is not closed between what needs to be invested in infrastructure and what is actually invested, it could ultimately create a $4 trillion drag on GDP by 2025.


As a result, between 2016 and 2025, each American household will lose $3,400 in disposable income due to infrastructure inefficiencies.


WHAT NEEDS TO BE FIXED?


Should money go to roadways, airports, water systems, broadband networks, or rail?


The biggest challenge facing America’s infrastructure problem is where to get the biggest ROI from infrastructure investments. Putting a trillion dollars towards problems that don’t really exist would be a catastrophic failure to everyone involved, with the exception of any crony capitalists that find a way to profit.


One viewpoint on this again comes from the American Society of Civil Engineers: they figure that by 2020, the U.S. needs to put $1.7 trillion towards roads, bridges and transit, $736 billion to electricity and power grids, $391 billion towards schools, $134 billion to airports, and $131 billion to waterways and related projects.


But even with these kinds of targets in place, how the decisions are actually made is another potential issue. Infrastructure investments are notoriously hard to gauge and often run overbudget. They are also capital-intensive, constrained by regulations, and disrupting to daily life at a local level, where the investments are being made.


Trump’s current plan is to provide $137 billion in tax credits to create incentives for private industry to spend the dough – but it remains to be seen how this will play out to mitigate the above risks, while solving the most important problems at both state and local levels.

Saturday, February 18, 2017

11 Deeply Alarming Facts About America's Crumbling Infrastructure

Submitted by Michael Snyder via The Economic Collapse blog,


No matter what your particular political perspective is, if there is one thing that virtually everyone in the United States can agree upon it is the fact that America’s infrastructure is crumbling


Previous generations of Americans conquered an entire continent and erected the greatest system of infrastructure that the world had ever seen, but now thousands upon thousands of those extremely impressive infrastructure projects are decades old and in desperate need of repair or upgrading.  The near catastrophic failure of the Oroville Dam is a perfect example of what I am talking about.  We should be constructing the next generation of infrastructure projects for our children and our grandchildren, but instead we are in such sorry shape that we can’t even keep up with the maintenance and upkeep on the great infrastructure projects that have been handed down to us.


Once upon a time nobody on the entire planet could even come close to matching our infrastructure, but now our crumbling infrastructure has become a joke to much of the rest of the industrialized world.  Sadly, this is just another symptom of our long-term economic collapse.  We simply are not able to put as much of our money toward infrastructure as previous generations of Americans did, and as a result we have a giant mess on our hands.  The following are 11 deeply alarming facts about America’s crumbling infrastructure…


#1 According to the American Road and Transportation Builders Association, nearly 56,000 bridges in the United States are currently “structurally deficient”.  What makes that number even more chilling is the fact that vehicles cross those bridges a total of 185 million times a day.


#2 More than one out of every four bridges in the United States is more than 50 years old and “have never had major reconstruction work”.


#3 America does not have a single airport that is considered to be in the top 25 in the world.


#4 The average age of America’s dams is now 52 years.


#5 Not too long ago, the American Society of Civil Engineers gave the condition of America’s dams a “D” grade.


#6 Overall, the American Society of Civil Engineers said that the condition of America’s infrastructure as a whole only gets a “D+” grade.


#7 Congestion on our highways costs Americans approximately 101 billion dollars a year in wasted fuel and time.


#8 According to the U.S. Department of Transportation, over two-thirds of our roads are “in dire need of repair or upgrades”.


#9 In order to completely fix all of our roads and bridges, it would take approximately 808 billion dollars.


#10 Federal spending on infrastructure has decreased by 9 percent over the past decade.


#11 According to Bloomberg, it is being projected “that by 2025, shortfalls in infrastructure investment will subtract as much as $3.9 trillion from U.S. gross domestic product.”


The quality of our infrastructure affects all of our lives every single day.  For instance, we all simply take it for granted that safe, clean drinking water is going to come out of our taps, but recent events have shown that is not necessarily always going to be the case.


Just ask the residents of Flint, Michigan.


Water pipes, sewer systems and water treatment facilities all over the nation are aging and are in desperate need of repair.  Of course the exact same thing could be said about our power grid.  It was never intended to handle so many people, and on the hottest days of the summer the strain on the grid is very evident.


And of course the power grid is exceedingly vulnerable to an electromagnetic pulse event, and this is something that I covered in my book on getting prepared.  It has been projected that it would only cost a couple billion dollars to harden the grid against an EMP event, but our politicians refuse to spend the money.


Meanwhile, President Trump is completely correct when he says that our airports look like something that you would see in a third world country.  Most of our airports are at least several decades old, and they are definitely showing their age.


But things are even worse when you look at other systems of mass transit around the country.  While other nations such as Japan and China are investing huge amounts of money into high speed rail, we are doing next to nothing even though what we currently have is absolutely pathetic.


I could go on and talk about our ports, schools, waterways, parks, etc. but I think that you get the point.


President Trump’s instincts are right on the money when he says that he wants to spend a trillion dollars on infrastructure.  Without a doubt, we desperately need it.


The problem is that we are flat broke.


We are 20 trillion dollars in debt, and we are adding more than a trillion dollars to that total every year.


So where are we going to get the money?


It is easy for liberals to say that we should raise taxes, but how much more are you going to squeeze out of U.S. consumers?  Two-thirds of the country is living paycheck to paycheck, and we just learned that U.S. household debt has risen to a grand total of 12.58 trillion dollars.


Once upon a time, America was the wealthiest nation on the entire planet and we could afford to construct bold, new infrastructure projects from sea to shining sea.


But today we have the biggest mountain of debt in the history of the world and we can’t even afford to repair what we already have.


When I speak of our long-term economic collapse, this is precisely the sort of thing that I am talking about.  We have clearly been in decline for a very long time, and anyone that would suggest otherwise is simply not being honest with you.

Wednesday, February 1, 2017

Destroying The "Wind & Solar Will Save Us" Delusion

Submitted by Gail Tverberg via Our Finite World blog,


The “Wind and Solar Will Save Us” story is based on a long list of misunderstandings and apples to oranges comparisons. Somehow, people seem to believe that our economy of 7.5 billion people can get along with a very short list of energy supplies. This short list will not include fossil fuels. Some would exclude nuclear, as well. Without these energy types, we find ourselves with a short list of types of energy — what BP calls Hydroelectric, Geobiomass (geothermal, wood, wood waste, and other miscellaneous types; also liquid fuels from plants), Wind, and Solar.


Unfortunately, a transition to such a short list of fuels can’t really work. These are a few of the problems we encounter:


[1] Wind and solar are making extremely slow progress in helping the world move away from fossil fuel dependence.


In 2015, fossil fuels accounted for 86% of the world’s energy consumption, and nuclear added another 4%, based on data from BP Statistical Review of World Energy. Thus, the world’s “preferred fuels” made up only 10% of the total. Wind and solar together accounted for a little less than 2% of world energy consumption.


Figure 1. World energy consumption based on data from BP 2016 Statistical Review of World Energy.

Figure 1. World energy consumption based on data from BP 2016 Statistical Review of World Energy.


Our progress in getting away from fossil fuels has not been very fast, either. Going back to 1985, fossil fuels made up 89% of the total, and wind and solar were both insignificant. As indicated above, fossil fuels today comprise 86% of total energy consumption. Thus, in 30 years, we have managed to reduce fossil fuel consumption by 3% (=89% – 86%). Growth in wind and solar contributed 2% of this 3% reduction. At the rate of a 3% reduction every 30 years (or 1% reduction every ten years), it will take 860 years, or until the year 2877 to completely eliminate the use of fossil fuels. And the “improvement” made to date was made with huge subsidies for wind and solar.


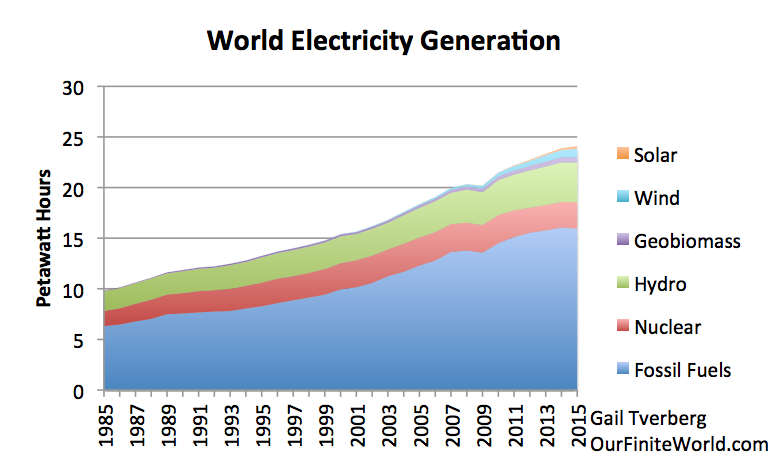
Figure 2. World electricity generation by source, based on BP 2016 Statistical Review of World Energy.

Figure 2. World electricity generation by source based on BP 2016 Statistical Review of World Energy.


The situation is a little less bad when looking at the electricity portion alone (Figure 2). In this case, wind amounts to 3.5% of electricity generated in 2015, and solar amounts to 1.1%, making a total of 4.6%. Fossil fuels account for “only” 66% of the total, so this portion seems to be the place where changes can be made. But replacing all fossil fuels, or all fossil fuels plus nuclear, with preferred fuels seems impossible.


[2] Grid electricity is probably the least sustainable form of energy we have.


If we are to transition to a renewables-based economy, we will need to transition to an electricity-based economy, since most of today’s renewables use electricity. Such an economy will need to depend on the electric grid.


The US electric grid is often called the “World’s Largest Machine.” The American Society of Civil Engineers gives a grade of D+ to America’s energy system. It says,


America relies on an aging electrical grid and pipeline distribution systems, some of which originated in the 1880s. Investment in power transmission has increased since 2005, but ongoing permitting issues, weather events, and limited maintenance have contributed to an increasing number of failures and power interruptions.


Simply maintaining the electric grid is difficult. One author writes about the challenges of replacing aging steel structures holding up power lines. Another writes about the need to replace transformers, before they fail catastrophically and interrupt services. The technology to maintain and repair the transmission lines demands that fossil fuels remain available. For one thing, helicopters are sometimes needed to install or repair transmission lines. Even if repairs are done by truck, oil products are needed to operate the trucks, and to keep the roads in good repair.


Electricity and, in fact, electricity dispensed by an electric grid, is in some sense the high point in our ability to create an energy product that “does more” than fossil fuels. Grid electricity allows electric machines of all types to work. It allows industrial users to create very high temperatures, and to hold them as needed. It allows computerization of processes. It is not surprising that people who are concerned about energy consumption in the future would want to keep heading in the same direction as we have been heading in the past. Unfortunately, this is the expensive, hard-to-maintain direction. Storms often cause electrical outages. We have a never-ending battle trying to keep the system operating.


[3] Our big need for energy is in the winter, when the sun doesn’t shine as much, and we can’t count on the wind blowing.


Clearly, we use a lot of electricity for air conditioning. It is difficult to imagine that air conditioning will be a major energy use for the long-term, however, if we are headed for an energy bottleneck. There is always the possibility of using fans instead, and living with higher indoor temperatures.


In parts of the world where it gets cold, it seems likely that a large share of future energy use will be to heat homes and businesses in winter. To illustrate the kind of seasonality that can result from the use of fuels for heating, Figure 3 shows a chart of US natural gas consumption by month. US natural gas is used for some (but not all) home heating. Natural gas is also used for electricity and industrial uses.


Figure 3. US natural gas consumption by month, based on US Energy Information Administration.

Figure 3. US natural gas consumption by month, based on US Energy Information Administration.


Clearly, natural gas consumption shows great variability, with peaks in usage during the winter. The challenge is to provide electrical supply that varies in a similar fashion, without using a lot of fossil fuels.


[4] If a family burns coal or natural gas directly for winter heat, but then switches to electric heat that is produced using the same fuel, the cost is likely to be higher. If there is a second change to a higher-cost type of electricity, the cost of heat will be even greater.  


There is a loss of energy when fossil fuels or biomass are burned and transformed into electricity. BP tries to correct for this in its data, by showing the amount of fuel that would need to be burned to produce this amount of electricity, assuming a conversion efficiency of 38%. Thus, the energy amounts shown by BP for nuclear, hydro, wind and solar don’t represent the amount of heat that they could make, if used to heat apartments or to cook food. Instead, they reflect an amount 2.6 times as much (=1/38%), which is the amount of fossil fuels that would need to be burned in order to produce this electricity.


As a result, if a household changes from heat based on burning coal directly, to heat from coal-based electricity, the change tends to be very expensive. The Wall Street Journal reports, Beijing’s Plan for Cleaner Heat Leaves Villagers Cold:


Despite electricity subsidies for residential consumers, villagers interviewed about their state-supplied heaters said their overall costs had risen substantially. Several said it costs around $300 to heat their homes for the winter, compared with about $200 with coal.


The underlying problem is that burning coal in a power plant produces a better, but more expensive, product. If this electricity is used for a process that coal cannot perform directly, such as allowing a new automobile production plant, then this higher cost is easily  absorbed by the economy. But if this higher-cost product simply provides a previously available service (heating) in a more expensive manner, it becomes a difficult cost for the economy to “digest.” It becomes a very expensive fix for China’s smog problem. It should be noted that this change works in the wrong direction from a CO2 perspective, because ultimately, more coal must be burned for heating because of the inefficiency of converting coal to electricity, and then using that electricity for heating.


How about later substituting wind electricity for coal-based electricity? China has a large number of wind turbines in the north of China standing idle.  One problem is the high cost of erecting transmission lines that would transport this electricity to urban centers such as Beijing. Also, if these wind turbines were put in place, existing coal plants would operate fewer hours, causing financial difficulties for these coal generating units. If these companies need subsidies in order to continue paying their ongoing expenses (including payroll and debt repayment), this would create a second additional cost. Electricity prices would need to be higher, to cover these costs as well. A family who had difficulty affording heat with coal-based electricity would have an even greater problem affording wind-based electricity.


Heat for cooking and heat for creating hot water are similar to heat for keeping an apartment warm. It is less expensive (both in energy terms and in cost to the consumer) if coal or natural gas is burned directly to produce the heat, than if electricity is used instead. This again, has to do with the conversion efficiency of turning fossil fuels to electricity.


[5] Low energy prices for the consumer are very important. Unfortunately, many analyses of the benefit of wind or of solar give a misleading impression of their true cost, when added to the electric grid. 


How should the cost of wind and solar be valued? It is simply the cost of installing the wind turbines or solar panels? Or does it include the all of the additional costs that an electricity delivery system must incur, if it is actually to incorporate this intermittent electricity into the electric grid system, and deliver it to customers where it is needed?


The standard answer, probably because it is easiest to compute, is that the cost is simply the cost (or energy cost) of the wind turbines or the solar panels themselves, plus perhaps an inverter. On this basis, wind and solar appear to be quite inexpensive. Many people have come to the conclusion that a transition to wind and solar might be helpful, based on this type of limited analysis.


Unfortunately, the situation is more complicated. Perhaps, the first few wind turbines and solar panels will not disturb the existing electrical grid system very much. But as more and more wind turbines or solar panels are added, there get to be additional costs. These include long distance transmission, electricity storage, and subsidies needed to keep backup electricity-generation in operation. When these costs are included, the actual total installed cost of delivering electricity gets to be far higher than the cost of the solar panels or wind turbines alone would suggest.


Energy researchers talk about the evaluation problem as being a “boundary issue.” What costs really need to be considered, when a decision is made as to whether it makes sense to add wind turbines or solar panels? Several other researchers and I feel that much broader boundaries are needed than are currently being used in most published analyses. We are making plans to write an academic article, explaining that current Energy Return on Energy Invested (EROEI) calculations cannot really be compared to fossil fuel EROEIs, because of boundary issues. Instead, “Point of Use” EROEIs are needed. For wind and solar, Point of Use EROEIs will vary with the particular application, depending on the extent of the changes required to accommodate wind or solar electricity. In general, they are likely to be far lower than currently published wind and solar EROEIs. In fact, for some applications, they may be less than 1:1.


A related topic is return on human labor. Return on human labor is equivalent to how much a typical worker can afford to buy with his wages. In [4], we saw a situation where the cost of heating a home seems to increase, as a transition is made from (a) burning coal for direct use in heating, to (b) using electricity created by burning coal, to (c) using electricity created by wind turbines. This pattern is eroding the buying power of workers. This direction ultimately leads to collapse; it is not the direction that an economy would generally intentionally follow. If wind and solar are truly to be helpful, they need to be inexpensive enough that they allow workers to buy more, rather than less, with their wages.


[6] If we want heat in the winter, and we are trying to use solar and wind, we need to somehow figure out a way to store electricity from summer to winter. Otherwise, we need to operate a double system at high cost.


Energy storage for electricity is often discussed, but this is generally with the idea of storing relatively small amounts of electricity, for relatively short periods, such as a few hours or few days. If our real need is to store electricity from summer to winter, this will not be nearly long enough.


In theory, it would be possible to greatly overbuild the wind and solar system relative to summer electricity needs, and then build a huge amount of batteries in order to store electricity created during the summer for use in the winter. This approach would no doubt be very expensive. There would likely be considerable energy loss in the stored batteries, besides the cost of the batteries themselves. We would also run the risk of exhausting resources needed for solar panels, wind turbines, and/or batteries.


A much more workable approach would be to burn fossil fuels for heat during the winter, because they can easily be stored. Biomass, such as wood, can also be stored until needed. But it is hard to find enough biomass for the whole world to burn for heating homes and for cooking, without cutting down an excessively large share of the world’s trees. This is a major reason why moving away from fossil fuels is likely to be very difficult.


[7] There are a few countries that use an unusually large share of electricity in their energy mixes today. These countries seem to be special cases that would be hard for other countries to emulate.


Data from BP Statistical Review of World Energy indicates that the following countries have the highest proportion of electricity in their energy mixes.


  • Sweden – 72.7%

  • Norway – 69.5%

  • Finland – 59.9%

  • Switzerland – 57.5%

These are all countries that have low population and a significant hydroelectric supply. I would expect that the hydroelectric power is very inexpensive to produce, especially if the dams were built years ago, and are now fully paid for. Sweden, Finland, and Switzerland also have electricity from nuclear providing about a third of each of their electricity supplies. This nuclear electricity was built long ago, and thus is now paid for as well. The geography of countries may also reduce the use of traffic by cars, thus reducing the portion of gasoline in their energy mixes. It would be difficult for other countries to create equivalently inexpensive large supplies of electricity.


In general, rich countries have higher electricity shares than poorer countries:


  • OECD Total – (Rich countries) – 2015 – 44.5%

  • Non- OECD (Less rich countries) – 2015 – 39.3%

China is an interesting example. Its share of energy use from electricity changed as follows from 1985 to 2015:


  • China – 1985 – 17.5%

  • China – 2015 – 43.6%

In 1985, China seems to have used most of its coal directly, rather than converting it for use as electricity. This was likely not difficult to do, because coal is easy to transport, and it can be used for many heating needs simply by burning it. Later, industrialization allowed for much more use of electricity. This explains the rise in its electricity ratio to 43.6% in 2015, which is almost as high as the rich country ratio of 44.5%. If the electricity ratio rises further, it will likely be because electricity is being put to use in ways where it has less of a cost advantage, or even has a cost disadvantage, such as for heating and cooking.


[8] Hydroelectric power is great for balancing wind and solar, but it is available in limited quantities. It too has intermittency problems, limiting how much it can be counted on. 


If we look at month-to-month hydroelectric generation in the US, we see that it too has intermittency problems. Its high month is May or June, when snow melts and sends hydroelectric output higher. It tends to be low in the fall and winter, so is not very helpful for filling the large gap in needed electricity in the winter.


Figure 4. US hydroelectric power by month, based on data of the US Energy Information Administration.

Figure 4. US hydroelectric power by month, based on data of the US Energy Information Administration.


It also has a problem with not being very large relative to our energy needs. Figure 5 shows how US hydro, or the combination of hydro plus solar plus wind (hydro+S+W), matches up with current natural gas consumption.


Figure 5. US consumption of natural gas compared to hydroelectric power and to compared to wind plus solar plus hydro (hydro+W+S), based on US Energy Information Administration data.

Figure 5. US consumption of natural gas compared to hydroelectric power and compared to hydro plus wind plus solar (hydro+W+S), based on US Energy Information Administration data.


Of course, the electricity amounts (hydro and hydro+S+W) are “grossed up” amounts, showing how much fossil fuel energy would be required to make those quantities of electricity. If we want to use the electricity for heating homes and offices, or for cooking, then we should compare the heat energy of natural gas with that of hydro and hydro+S+W. In that case, the hydro and hydro+S+W amounts would be lower, amounting to only 38% of the amounts shown.


This example shows how limited our consumption of hydro, solar, and wind is compared to our current consumption of natural gas. If we also want to replace oil and coal, we have an even bigger problem.


[9] If we need to get along without fossil fuels for electricity generation, we would have to depend greatly on hydroelectric power. Hydro tends to have considerable variability from year to year, making it hard to depend on.


Nature varies not just a little, but a lot, from year to year. Hydro looks like a big stable piece of the total in Figures 1 and 2 that might be used for balancing wind and solar’s intermittency, but when a person looks at the year by year data, it is clear that the hydro amounts are quite variable at the country level.


Figure 3. Electricity generated by hydroelectric for six large European countries based on BP 2016 Statistical Review of World Energy.

Figure 6. Electricity generated by hydroelectric for six large European countries based on BP 2016 Statistical Review of World Energy.


In fact, hydroelectric power is even variable for larger groupings, such as the six countries in Figure 6 combined, and some larger countries with higher total hydroelectric generation.


Figure 4. Hydroelectricity generated by some larger countries, and by the six European countries in Figure 3 combined.

Figure 7. Hydroelectricity generated by some larger countries, and by the six European countries in Figure 6 combined, based on BP 2016 Statistical Review of World Energy.


What we learn from Figures 6 and 7 is that even if a great deal of long distance transmission is used, hydro will be variable from year to year. In fact, the variability will be greater than shown on these charts, because the quantity of hydro available tends to be highest in the spring, and is often much lower during the rest of the year. (See Figure 4 for US hydro.) So, if a country wants to depend on hydro as its primary source of electricity, that country must set its expectations quite low in terms of what it can really count on.


And, of course, Saudi Arabia and several other Middle Eastern countries don’t have any hydroelectric power at all. Middle Eastern countries tend not to have biomass, either. So if these countries choose to use wind and solar to assist in electrical generation, and want to balance their intermittency with something else, they pretty much need to use something that is locally available, such as natural gas. Other countries with very low amounts of hydro (or none at all) include Algeria, Australia, Bangladesh, Denmark, Netherlands, and South Africa.


These issues provide further reasons why countries will want to continue using fossil fuels, and perhaps nuclear, if they can.


[10] There has been a misunderstanding regarding the nature of our energy problem. Many people believe that we will “run out” of fossil fuels, or that the price of oil and other fuels will rise very high. In fact, our problem seems to be one of affordability: energy prices don’t rise high enough to cover the rising cost of producing electricity and other energy products. Adding wind and solar tends to make the problem of low commodity prices worse.   


Ultimately, consumers can purchase only what their wages will allow them to purchase. Rising debt can help as well, for a while, but this has limits. As a result, lack of wage growth translates to a lack of growth in commodity prices, even if the cost of producing these commodities is rising. This is the opposite of what most people expect; most people have never considered the possibility that peak energy will come from low prices for all types of energy products, including uranium. Thus, we seem to be facing peak energy demand (represented as low prices), arising from a lack of affordability.


We can see the problem in the example of the Beijing family with a rising cost of heating its apartment. Economists would like to think that rising costs translate to rising wages, but this is not the case. If rising costs are the result of diminishing returns (for example, coal is from deeper, thinner coal seams), the impact is similar to growing inefficiency. The inefficient sector needs more workers and more resources, leaving fewer resources and workers for other more efficient sectors. The result is an economy that tends to contract because of growing inefficiency.


If we want to operate a double system, using wind and solar when it is available, and using fossil fuels at other times, the cost will be very high. The problem arises because the fossil fuel system has many fixed costs. For example, coal mines and natural gas companies need to continue to pay interest on their loans, or they will default. Pipelines need to operate 365 days per year, regardless of whether they are actually full. The question is how to get enough funding for this double system.


One pricing system for electricity that doesn’t work well is the “market pricing system” based on each producer’s marginal costs of production. Wind and solar are subsidized, so they tend to have negative marginal costs of production. It is impossible for any other type of electricity producer to compete in this system. It is well known that this system does not produce enough revenue to maintain the whole system.


Sometimes, additional “capacity payments” are auctioned off, to try to fix the problem of inadequate total wholesale electricity prices. If we believe the World Nuclear Organization, even these charges are not enough. Several US nuclear power plants are scheduled for closing, indirectly because this pricing methodology is making older nuclear power plants unprofitable. Natural gas prices have also been too low for producers in recent years. This electricity pricing methodology is one of the reasons for this problem as well, in my opinion.


A different pricing system that works much better in our current situation is the utility pricing system, or “cost plus” pricing. In this system, prices are determined by regulators, based on a review of all necessary costs, including appropriate profit margins for producers. In the case of a double system, it allows prices to be high enough to cover all the needed costs, including the extra long distance transmission lines, plus all of the high fixed costs of fossil fuel and nuclear power plants, operating for fewer hours per year.


Of course, these much higher electricity rates eventually will become unaffordable for the consumer, leading to a cutback in purchases. If enough of these cutbacks in purchases occur, the result will be recession. But at least the electricity system doesn’t fail at an early date because of inadequate profits for its producers.


Conclusion


The possibility of making a transition to an all-renewables system seems virtually impossible, for the reasons I have outlined above. I have outlined many other issues in previous posts:


The topic doesn’t seem to go away, because it is appealing to have a “solution” to what seems to be a predicament with no solution. In a way, wind and solar are like a high-cost placebo. If we give these to the economy, at least people will think we are treating the problem, and maybe our climate problem will get a little better.


Meanwhile, we find more and more real life problems with intermittent renewables. Australia has had a series of blackouts. A several-hour blackout in South Australia was tied partly to the high level of intermittent energy on the grid. The ways of reducing future recurrences appear to be very expensive.


Antonio Turiel has written about the problems that Spain is encountering. Spain added large amounts of wind and solar, but these have not been available during a recent cold spell. It added gas by pipeline from Algeria, but now Algeria has cut back on the amount it is supplying. It has added transmission lines north to France. Now, Turiel is concerned that Spain’s electricity prices will be persistently higher, because he believes that France has not taken sufficient preparations to meet its own electricity needs. If there were little interconnectivity between countries, France’s electricity problems would stay in France, rather than adversely affecting its neighbors. A person begins to wonder: Can transmission lines have an adverse impact on new electricity supply? If a country can hope that “the market” will supply electricity from elsewhere, does that country take adequate steps to provide its own electricity?


In my opinion, the time has come to move away from believing that everything that is called “renewable” is helpful to the system. We now have real information on how expensive wind and solar are, when indirect costs are included. Unfortunately, in the real world, high-cost is ultimately a deal killer, because wages don’t rise at the same time. We need to understand where we really are, not live in a fairy tale world produced by politicians who would like us to believe that the situation is under control.