Showing posts with label EEM. Show all posts

Tuesday, December 12, 2017

Emerging markets bull trend could fail here!


Emerging Markets ETF (EEM) has done very well over the past year, gaining over 30%. The gain is nearly 50% more than the S&P 500 during the same time period. Impressive gain and impressive relative strength compared to the S&P 500!


An important bull market test looks to be at hand for EEM this week, see chart below-


CLICK ON CHART TO ENLARGE


In 2011, EEM looks to have created a head and shoulders top, with the “right shoulder” taking place at line (1). EEM declined for the next 5-years after creating this topping pattern, falling over 40% during that time frame.


In 2015/2016, EEM looks to have created an inverse head and shoulders pattern, where a strong rally over the past 18-months has taken place off the lows. The rally took EEM back to test line (1), which was the right shoulder back in 2011. While hitting line (1) a reversal pattern (bearish wick) took place. Since hitting line (1), EEM has declined a small percent, where it finds itself testing 1-year rising channel support at (2).


The trend in EEM remains up and the small decline of late has NOT changed that trend. EEM bulls want/need to see support hold at (2). If it fails to hold, some selling pressure could take place.


Chart pattern analysis with brief commentary:   


There is a ton of news and opinions about markets and stocks that make the decision-making process more difficult than it needs to be.    


I believe the Power of the chart Pattern provides all you need to see what is taking place in an asset and determine the action to take.  


This approach has worked well for me and our clients and I encourage you to test it for yourself. 


Send an email if you would like to see sample research and take me up on a30 DAY FREE TEST DRIVE of our Premium or Weekly Research


where I provide actionable alerts on breakouts and reversals in broad market indices, sectors, commodities, the miners and select individual stocks  


Email services@kimblechartingsolutions.com  


Call us Toll free 877-721-7217 international 714-941-9381 


Website: KIMBLECHARTINGSOLUTIONS.COM 


Receive daily research I post on the blog each day


Follow on Twitter 


See our latest webinar


Wednesday, December 6, 2017

Emerging Markets about to “Sub-Merge?”


Year to date, Emerging markets (EEM) have lived up to their name, as they have emerged to gain much more than the S&P 500. Of late, EEM was up nearly twice that of the S&P 500 this year. (See YTD performance below)-


CLICK ON CHART TO ENLARGE


Below looks at EEM over the past 8-years and how an important test could be taking place-


CLICK ON CHART TO ENLARGE


The chart above highlights that the trend in EEM over the past two years is up. It also highlights that the trend over the past 6-year is flat, as EEM is no higher of late than it was in 2011.


The strong 12-month rally in EEM saw it hit 2011 lower highs along line (1) three weeks ago as momentum was hitting the highest levels since the 2007 highs. The softness over the past couple of weeks has EEM attempting to break rising support at (2), while momentum is attempting to the do the same.


EEM has been in a leadership role the past two years. What it does at (2) could send an important message about Emerging markets and other global markets around the world.


Emerging markets about to “Sub-merge?”  Two weeks soft action does NOT prove a trend change has taken place. Further weakness at (2), could bring on more selling, so keep a close eye on what EEM does the next couple of weeks.


Chart pattern analysis with brief commentary:   


There is a ton of news and opinions about markets and stocks that make the decision-making process more difficult than it needs to be.    


I believe the Power of the chart Pattern provides all you need to see what is taking place in an asset and determine the action to take.  


This approach has worked well for me and our clients and I encourage you to test it for yourself. 


Send an email if you would like to see sample research and take me up on a30 DAY FREE TEST DRIVE of our Premium or Weekly Research


where I provide actionable alerts on breakouts and reversals in broad market indices, sectors, commodities, the miners and select individual stocks  


Email services@kimblechartingsolutions.com  


Call us Toll free 877-721-7217 international 714-941-9381 


Website: KIMBLECHARTINGSOLUTIONS.COM 


Receive daily research I post on the blog each day


Follow on Twitter 


See our latest webinar


Saturday, October 14, 2017

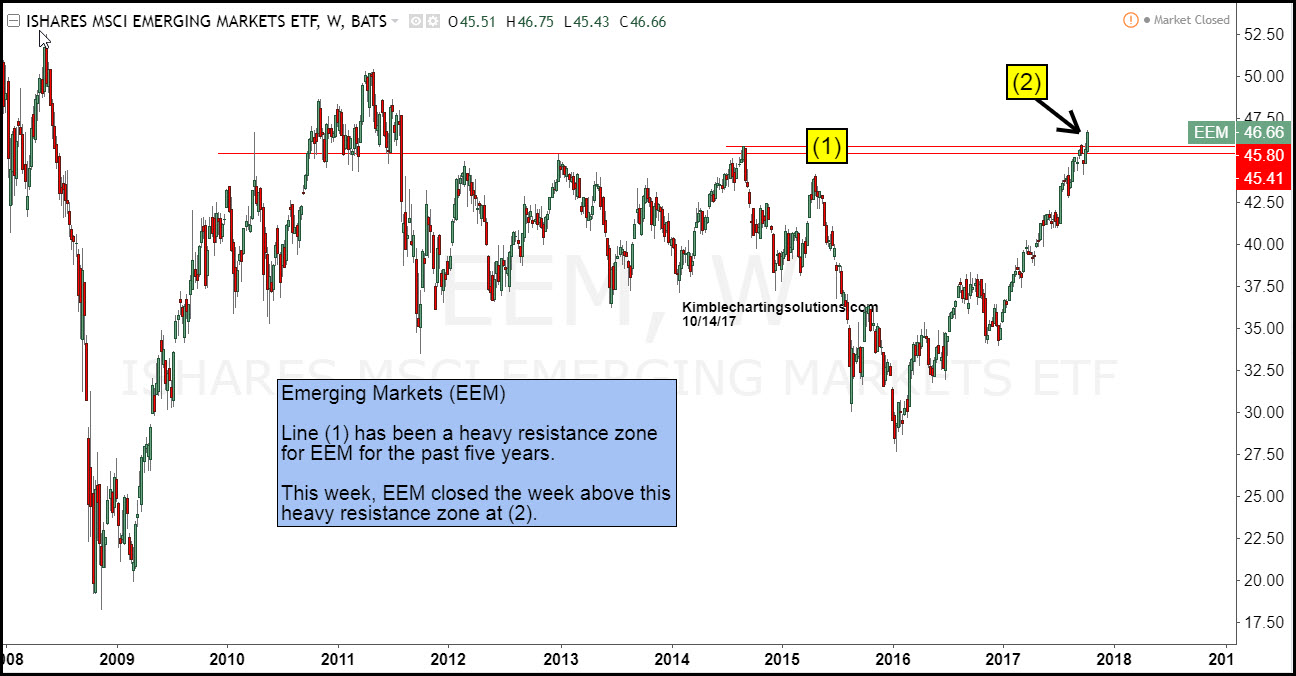
Emerging Markets break above 5-year resistance


Emerging Markets ETF (EEM) did something this week, it has been unable to do numerous times over the past 5-years. Below looks at the price pattern of EEM over the past 10-years.


CLICK ON CHART TO ENLARGE


EEM has done well since the start of 2016, reflecting gains much stronger than the S&P 500. Over the past 5-years, EEM has little to brag about, as the gains have been pretty much non-existent!


This week EEM was able to put in a “Weekly Close” above highs at resistance zone (1) above. This breakout is a positive price signal and could attract buyers due to the breakout.


Next key upside test for EEM come in at the $50 zone, around 10% above current prices.


Why do you see very few comments from me?  Because I believe the Power of the Pattern provides all you need to see what is taking place in an asset and determine the action to take


Receive my free research posted on the blog daily here 


Better yet, send an email if you would like to see sample research and take me up on a trial of my premium or weekly research where I provide actionable alerts on breakouts and reversals in broad market indices, sectors, commodities, the miners and select individual stocks 


Email services@kimblechartingsolutions.com  


Call us Toll free 877-721-7217 international 714-941-9381 


Website: KIMBLECHARTINGSOLUTIONS.COM 


Wednesday, August 9, 2017

Germany & Emerging Markets kissing important resistance-

demaggio and marilyn monroe for chris kimble post


Stock markets around the world remain highly correlated. With this in mind, the German stock market finds itself potentially kissing dual resistance, that could impact stocks in the states.


German DAX chris kimble post


CLICK ON CHART TO ENLARGE


As mentioned above, the DAX remains inside of rising channel (1) since the 2009 lows. It hit rising support early last year and the rally that followed took it back to line (2), which was the 2015 highs. For a few weeks, the DAX traded above the 2015 highs, until weakness of late. The recent decline now has the DAX back below 2015 highs, which sends a small caution signal to the DAX and other world stock indices.


The weakness of late now has the DAX “Kissing” the underside of dual short-term resistance at (3). If weakness would continue in the DAX just below this dual resistance point, it would send a concerning message to bulls in Germany and the states.


Below looks at a chart of Emerging Markets ETF (EEM) over the past


Emerging markets weekly


CLICK ON CHART TO ENLARGE


Similar to the DAX, EEM is kissing the underside of dual resistance at (1). While this important dual kiss is taking place, momentum finds itself at the highest levels since the highs back in 2007 at (3).


Bulls in the states DO NOT want to see weakness creep into the DAX or EEM as both are testing the underside of dual resistance.


from Kimble Charting Solutions.  We strive to produce concise, timely and actionable chart pattern analysis to save people time, improve your decision-making and results


Send us an email if you would like to see sample reports or a trial period to test drive our Premium or Weekly Research


Website: KIMBLECHARTINGSOLUTIONS.COM


Questions: Email services@kimblechartingsolutions.com or call us toll free 877-721-7217 international 714-941-9381

Monday, July 24, 2017

Emerging Markets; Run out of gas again here?

gas gauge for Emerging Markets; Run out of gas again here? kimble charting solutions


Emerging Markets ETF (EEM) has received a good deal of positive press for its performance off the 2016 lows. No doubt it has done well, as its is up around 50% off the lows of last year, while the S&P is up nearly 30%. This 18-month rally has caused many to tout how well Emerging markets are doing. For sure it has been a better place to be if one was spot on and bought the lows last year.


If one looks back a little further back into the returns since 2015, 2014, 2013 and 2011, buy & hold investors of this ETF don’t have much to brag about!


Below compares the performance of EEM to the S&P 500 since 2011


Emerging markets monthly (EEM) kimble charting solutions


CLICK ON CHART TO ENLARGE


EEM peaked in 2011 at (1) and since then is still over 12% below those highs. It also peaked four different times at each (2). For those investors that bought at those highs, they are still underwater on the initial investment. No brag points here friends if one bought at those highs.


Now EEM is nearing heavy resistance line (2) at (3). Four different times EEM has created lower highs along line (2).


Will EEM “Run out of Gas” again at this key resistance zone or will it be different this time at (3)? What EEM does at this heavy resistance zone, could send an important message to world markets and the S&P 500!


This information is coming to you from Kimble Charting Solutions.  We strive to produce concise, timely and actionable chart pattern analysis to save people time, improve your decion-making and results


Send us an email if you would like to see sample reports or a trial period to test drive our Premium or Weekly Research


Website: KIMBLECHARTINGSOLUTIONS.COM


Questions: Email services@kimblechartingsolutions.com or call us toll free 877-721-7217 international 714-941-9381

Thursday, July 6, 2017

Emerging Markets about to Submerge?


Emerging Markets (EEM) has done well this year, gaining over twice as much as the S&P 500 (17% -vs- 7%). These gains have Emerging markets facing resistance dating back to the highs in 2008 and a couple of other important resistance lines in the chart below.


Emerging markets monthly (EEM) kimble charting solutions


CLICK ON CHART TO ENLARGE 


Emerging markets have been a downside leader since 2008 and an upside leader since early 2016. EEM is testing triple resistance with momentum lofty.


If support would give way at (2), selling pressure could pick up speed, leaving room for Emerging markets to “submerge!” Important price point at (2) for this key market. The tight jam EEM finds itself at right now, could create a good deal of movement, when it resolves this narrowing pattern!


Bulls so much need EEM here to breakout to the upside!


This information is coming to you from Kimble Charting Solutions. This is the home of the Power of the Pattern where we provide concise, timely and actionable chart pattern analysis and commentary so in very little time you know the pattern at hand and action to take.   We are honored by your interest in our chart pattern analysis.  


 Send us an email if you would like to see sample reports or a trial period to test drive our Premium or Weekly Research


Website: KIMBLECHARTINGSOLUTIONS.COM


Questions: Email services@kimblechartingsolutions.com or call us toll free 877-721-7217 international 714-941-9381

Tuesday, May 30, 2017

Emerging Markets; Testing 2007 breakout level again!


Since 2007, Emerging markets (EEM) have under performed the broad market by nearly 80%. Below compares the performance of the S&P 500 to Emerging markets ETF EEM, since the highs back in 2007.


Emerging markets (EEM kimble charting solutions


CLICK ON CHART TO ENLARGE


Could this lagging performance be coming to an end? For this lagging performance to end, it first has to accomplish an important breakout, see chart below.


Emerging markets monthly (EEM) kimble charting solutions


CLICK ON CHART TO ENLARGE


EEM has created a series of lower highs along line (1) at (2). This line was last touched in 2014, where it peaked and soon lost over 25% of its value. EEM is kissing the underside of line (1) again at (3), as the month of May is coming to an end.


At this time, EEM is facing a critical test of resistance, as it is kissing the underside of more than one line at (3). Over the past few years, this is a price point where buyers stopped coming forward. If EEM can manage a breakout at (3), it would send a bullish message to this lagging ETF.


Website: KIMBLECHARTINGSOLUTIONS.COM


Blog:  KIMBLECHARTINGSOLUTIONS.COM/BLOG


Questions: Email services@kimblechartingsolutions.com or call us toll free 877-721-7217 international 714-941-9381

Thursday, May 18, 2017

Brazil; Waterfall in prices starting? Impact U.S.?

Brazil; Waterfall in prices starting? Impact U.S.?


Below looks at the Brazil ETF (EWZ) over the last decade. The rally over the past year has it facing a critical level, from a Power of the Pattern perspective.


EWZ weekly kimble charting solutions


CLICK ON CHART TO ENLARGE


EWZ is facing dual resistance at (1), while in a 9-year down trend of lower highs and lower lows. The counter trend rally over the past 17-months has it testing key falling resistance. Did the counter trend reflation rally just end at dual resistance???


If EWZ breaks support at (1), it should attract selling pressure. If it falls hard, the decline could well put the hurts to Emerging markets (EEM) and potentially ripple into the stock market in the states!!!


Email us for a recent Sector/Commodity report that includes pattern analysis on emerging markets


Website: KIMBLECHARTINGSOLUTIONS.COM


Blog:  KIMBLECHARTINGSOLUTIONS.COM/BLOG


Questions: Email services@kimblechartingsolutions.com or call us toll free 877-721-7217 international 714-941-9381