Showing posts with label Head and Shoulders. Show all posts

Tuesday, December 12, 2017

Emerging markets bull trend could fail here!


Emerging Markets ETF (EEM) has done very well over the past year, gaining over 30%. The gain is nearly 50% more than the S&P 500 during the same time period. Impressive gain and impressive relative strength compared to the S&P 500!


An important bull market test looks to be at hand for EEM this week, see chart below-


CLICK ON CHART TO ENLARGE


In 2011, EEM looks to have created a head and shoulders top, with the “right shoulder” taking place at line (1). EEM declined for the next 5-years after creating this topping pattern, falling over 40% during that time frame.


In 2015/2016, EEM looks to have created an inverse head and shoulders pattern, where a strong rally over the past 18-months has taken place off the lows. The rally took EEM back to test line (1), which was the right shoulder back in 2011. While hitting line (1) a reversal pattern (bearish wick) took place. Since hitting line (1), EEM has declined a small percent, where it finds itself testing 1-year rising channel support at (2).


The trend in EEM remains up and the small decline of late has NOT changed that trend. EEM bulls want/need to see support hold at (2). If it fails to hold, some selling pressure could take place.


Chart pattern analysis with brief commentary:   


There is a ton of news and opinions about markets and stocks that make the decision-making process more difficult than it needs to be.    


I believe the Power of the chart Pattern provides all you need to see what is taking place in an asset and determine the action to take.  


This approach has worked well for me and our clients and I encourage you to test it for yourself. 


Send an email if you would like to see sample research and take me up on a30 DAY FREE TEST DRIVE of our Premium or Weekly Research


where I provide actionable alerts on breakouts and reversals in broad market indices, sectors, commodities, the miners and select individual stocks  


Email services@kimblechartingsolutions.com  


Call us Toll free 877-721-7217 international 714-941-9381 


Website: KIMBLECHARTINGSOLUTIONS.COM 


Receive daily research I post on the blog each day


Follow on Twitter 


See our latest webinar


Monday, May 1, 2017

These Three Charts Are Warning the Market Could Soon Experience an "Event"

The markets are speaking, but no one is listening.


The single driver of the stock market since election night is the hype of a Trump-policy driven economic boom. The economy is booming, but based on expectations NOT actual policy changes.


This is a critical distinction.


Stocks are MOST susceptible to violent drops (or even Crashes) when illusions are shattered. The illusion of major changes to the US economy is about to be shattered.


The markets are already telegraphing this.


The single most important stock market index for assessing “risk on” vs. “risk off” is the Russell 2000. What the Russell 2000 does… the rest of the market soon follows.


On that note, the Russell 2000 has just staged a final blow off push to the upside. And. It. Failed. The momentum here has shifted and we could drop to that red box (a 5% drop) in a matter of days.


Put simply, this chart is telling us that the market has just entered “risk off” mode.


Then there’s the Dow Jones Transportation Index.


This is THE most economically sensitive index for the markets. Transports “get” the economy better than any other group of stocks.


On that note, Transports are telling us that the economy is not in fact booming… it’s basically just treading water, no matter sentiment says. In fact, we’ve got a very nasty Head and Shoulders pattern forming here.


If the economy was really roaring, Transports would be soaring. They’re not. If anything, they’re getting ready to drop 1,000 points in the next 30 days.


Finally, and most importantly, there is High Yield Credit or Junk Bonds. These represent the credit cycle. When credit growth is strong here, financial conditions are strengthening in the financial system and risk does well.


When credit growth is weakening, or worse, contracting here, financial conditions are worsening in the financial system and “look out below.”


On that note, Junk Bonds are rolling over and preparing to break out of a textbook perfect bearish rising wedge pattern. This is telling us that the entire move from the February 2016 bottom is about to come unraveled. We could easily see stocks drop 10% from current levels if this pattern is confirmed.


These three charts, taken together, suggest the markets are about to experience an “event” in which risk comes unhinged. When this happens, the markets will adjust VIOLENTLY to the downside.


To pick up a FREE investment report outlining three investments that you could make you a ton of money when the markets collapse… 


CLICK HERE NOW


Best Regards


Graham Summers


Chief Market Strategist


Phoenix Capital Research

Friday, February 17, 2017

Catalyst Capital CEO Speaks Out, Claims "Our Exposure Was Greatly Exaggerated"

Chatter about a multi-billion-dollar levered options strategy fund getting caught offside (and being forced - by its own strategy"s hedging requirements - to buy into the rally, acting as the "catalyst" for the almost unprecedented move) have been rife all week and our discussions of Catalyst Capital"s NAV collapse - coinciding with the longest streak of gains in stocks in 4 years and VIX decoupling - led to a statement to CNBC earlier that their position-squaring was complete.


Now, Catalyst Capital CEO Jerry Szilagyi has reached out to Bloomberg to clear up any misunderstandings...


“Our exposure was greatly exaggerated, and our impact on the market was greatly exaggerated,” said Szilagyi by phone. “Comments that we were forced to short cover are not correct. We haven’t been forced to do anything.”


“There may have been some market impact from our trading earlier this week, but it’s certainly not the majority of the market impact, by any stretch,” said Szilagyi. “Probably Donald Trump’s tweets have had a bigger impact than our trading."


“We’ve communicated with our shareholders over the years that this is the type of environment that’s the worst for the fund,” said Szilagyi.


“We’ve had losses before and when this happens, we’ve covered our positions, and when market conditions are more favorable we’ll get back in.”


All of which makes perfect sense, but here are a few other points to consider...


1) Fund collapses most in its history


2) Options volumes explode


3) VIX decouples from stocks for longest period since election


4) S&P rises 7 days in a row - longest streak in 4 years on NOTHING


5) Fund drops 7 days in a row


6) Fund claims liquidation is complete and market drops


... we no longer have that type of short position at this time. Consistent with our overall risk management strategy we have some draw-downs where we decided to take action and we are pretty neutral with our positions at this point.  


We finished adjusting the portfolio.


I"ve seen some things in the press about the fund and short term forced-buying, we"ve had no margin issues.


The fund is under no duress or anything like that. We weren"t forced to sell."


All probably just coincidence.


But then again, of course, what else would one expect the CEO of a major financial institution to say when his firm appears to be in trouble...


Catalyst Capital CEO Jerry Szilagyi to Bloomberg in 2017 -  "It"s just people looking to sensationalize things and make headlines," adding that "our exposure was greatly exaggerated, and our impact on the market was greatly exaggerated."


Bear Stearns CEO Alan Schwartz goes on CNBC in March 2008 and assures viewers that the firm has ample liquidity. "Part of the problem is that when speculation starts in a market that has a lot of emotion in it," Schwartz says he has numbers to back up his insistence that the bank"s position is solid.


The first rule of crisis management... "blame the speculators"


*  *  *


As an addendum, InvestmentNews.com reports a "cautionary tale" about Catalyst Capital...


The Catalyst Hedged Futures Strategy Fund was up 6.2% last year, head and shoulders above the average managed futures fund, which fell 2.8%. Performance like that caught investors" eyes. The fund"s assets soared from $1.2 billion in 2015 to $2.2 billion at the end of 2016.


Just one problem: It wasn"t a managed futures fund.


"It was miscategorized," said Morningstar (MORN) analyst Jason Kephart, noting that Morningstar analysts don"t cover the fund. The Catalyst fund uses put and call options on Standard & Poor"s 500 stock futures, with the aim of reducing volatilty and overall correlation to the blue-chip index. Morningstar moved the fund into the options writing category Feb. 1, Mr. Kephart said.


Presumably, the fund"s name had something to do with its mislabeling, since it had "futures" in it. And when the fund converted from a hedge fund to an open-end fund in September 2013, Morningstar didn"t have an options writing category, said Jerry Szilagyi, CEO of Catalyst Capital Advisers. "That"s not the best fit, either," he said. "The fund is unique. There really isn"t a good category for it."


Saturday, January 28, 2017

Retail Sector - Doomed as Doomed Can Be

From the Slope of Hope: Being an equity bear has been brutal for, oh, nearly eight years now. With the S&P up about 250% since bottoming in March 2009, equities have been, on the whole, raging higher, with some sectors in particular benefiting tremendously from the Trumpgasm. One area, though, seems to be recognizing a bitterly cold chill of reality, and that is retail.


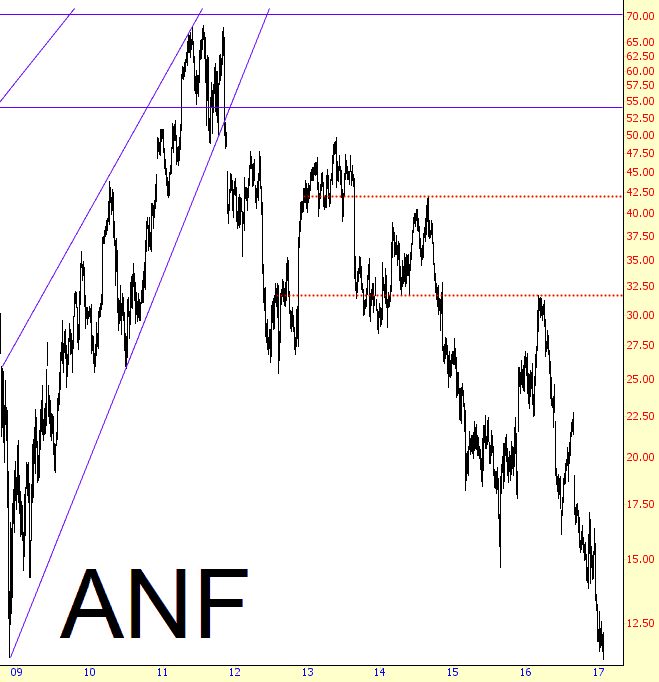
Not everything retail is weak, of course, Amazon has had an astonishing run (and we"ll see if it holds together when they report next week), and some stocks such as Autozone (AZO) and O"Reilly Auto Parts (ORLY) have cranked out multi-hundred percent gains for years now. But many retail companies, particularly those having to do with clothing, have been getting whacked. Take, for instance, Abercrombie & Fitch, which I"ve picked on endlessly: it is actually lower than it was at the greatest depths of the financial crisis. For how many stocks could you make that statement?


0128-ANF


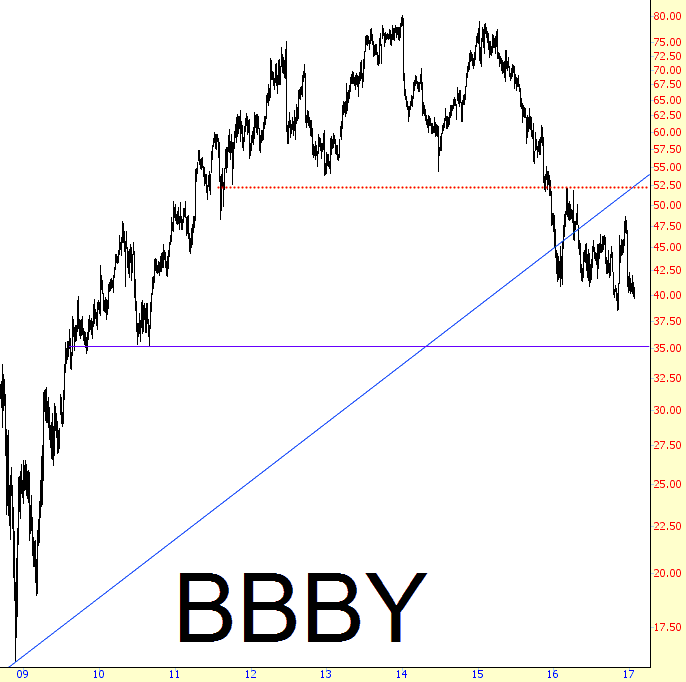
Bed Bath & Beyond has a quite well-formed head and shoulders pattern (whose neckline is shown with a red horizontal below) that suggests much lower prices to come.


0128-BBBBY


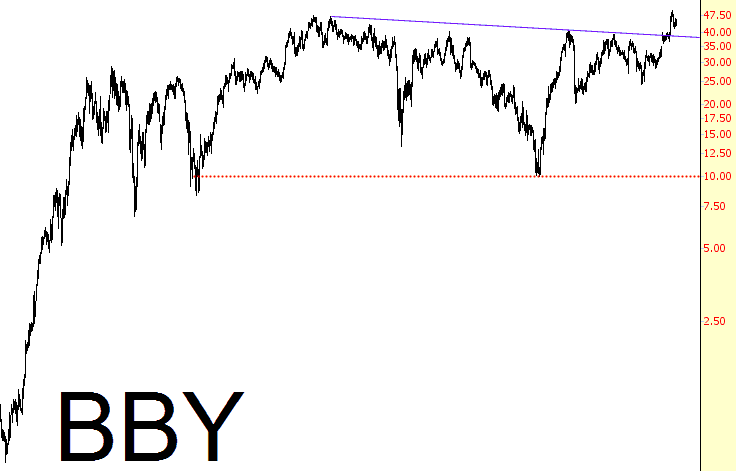
Be careful not to confuse this with a very similar symbol, however - Best Buy - which, competition from Amazon be damned, is defying gravity and broke above resistance this year.


0128-BBBY


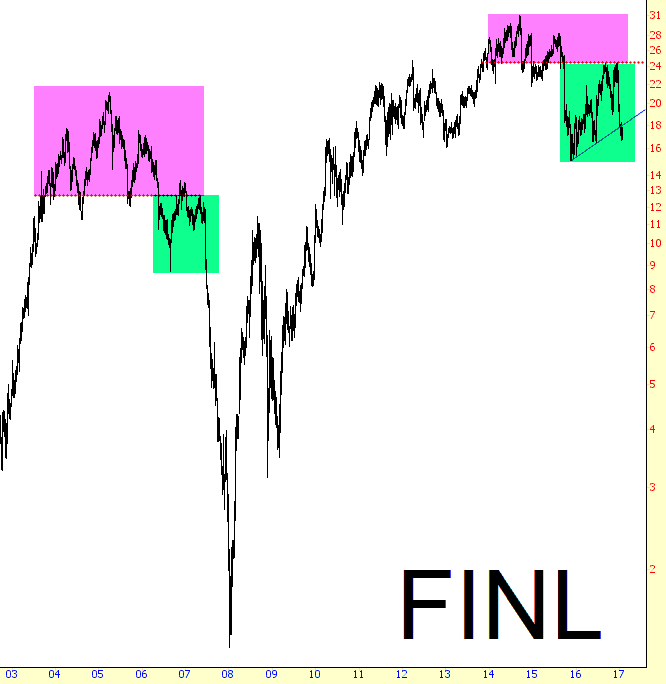
Let"s get back to the bearish charts, though: Shoe retailer Finish Line has been trending lower for months, and the analog is going beautifully:


0128-FINL


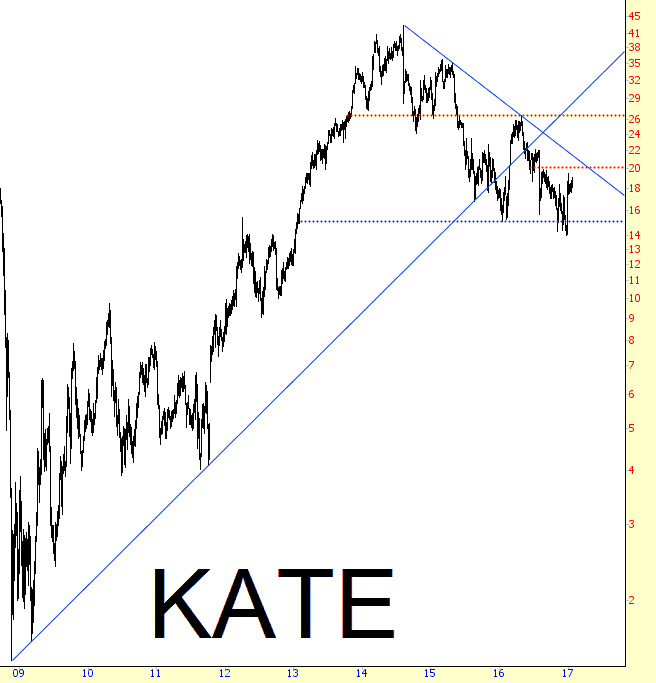
Another storefront at your local luxury mall is Kate Spade. It found strength off and on recently due to buyout chatter (they are desperately trying to sell themselves), but the pattern is bearish, and just so you are clear, just because a company is for sale doesn"t mean there will be any buyers. Just ask Twitter.


0128-KATE


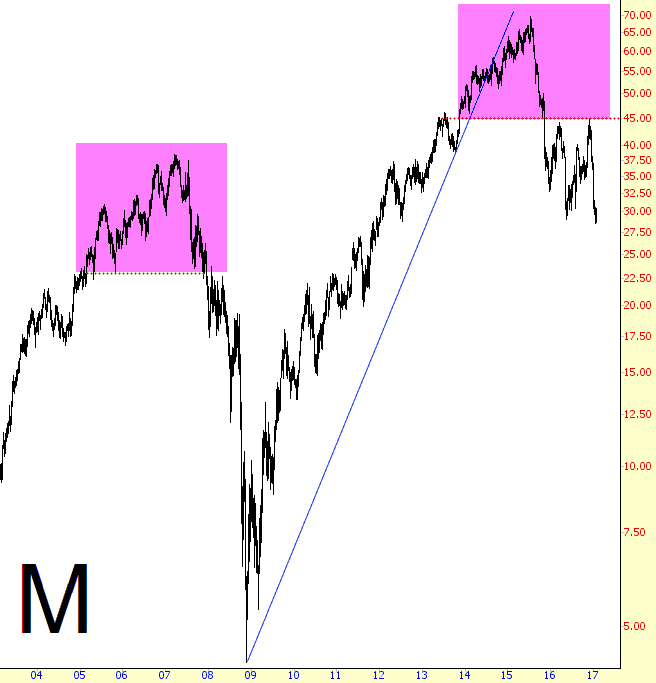
Speaking of analogs, take a look at Macy"s. Even though the stock has lost over half its value, if history is any guide, there are doomed as doomed can be (this is more impressive if you say it in an Ed Grimley voice).


0128-M


Hold on there........it"s another analog......and from another company I pick on a lot: Pier One, purveyor of scented candles, throw pillows, and monkeys carved from coconuts. This is another fine example of how just because a stock has already suffered a momentous collapse (about 65% so far) doesn"t mean it isn"t just going to keep collapsing. Firm support exists at $0.00.


0128-PIR


Overpriced seller of kitchenware, Williams Sonoma, is setting itself up for a big fall. It has found support for years in the mid 40s, but don"t count on that surviving the year intact.


0128-WSM


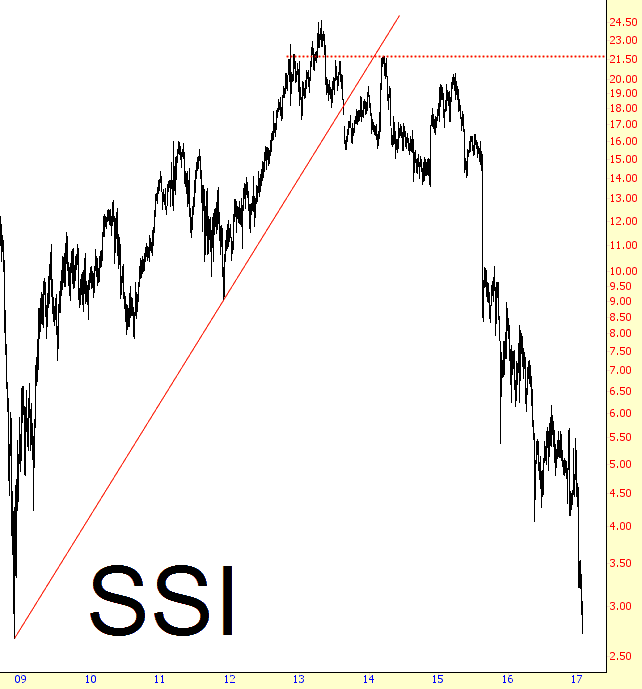
I will say, however, that some retailers are so far gone, the opportunity has already passed by. Stage Stores is a good example of a ship that"s already sailed.


0128-SSI


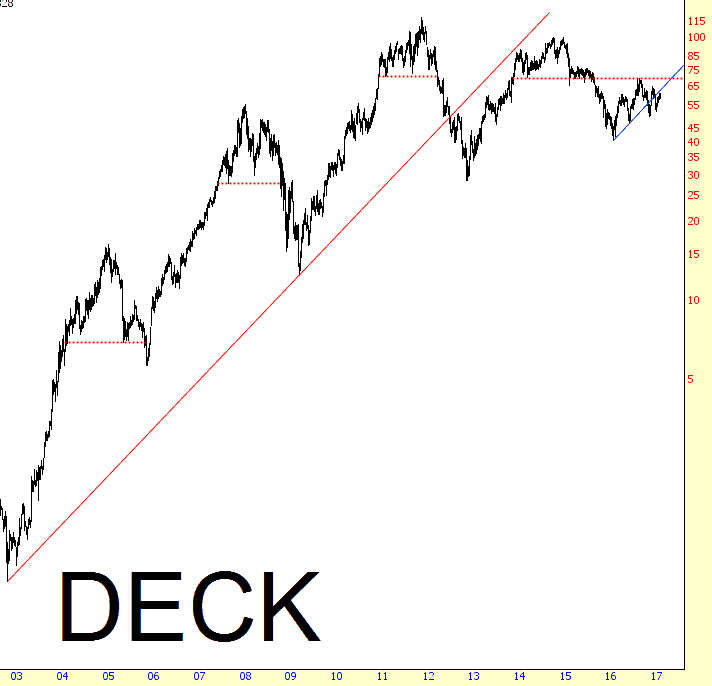
On the other hand, Deckers Outdoor (makers of the UGG shoe line, among others) has plenty of juice left to squeeze.


0128-DECK


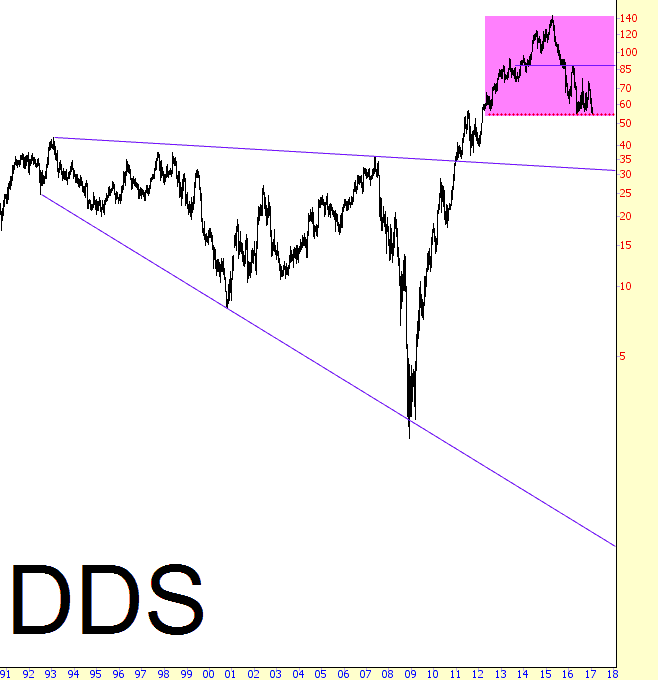
Dillard"s is another stock which has lost about 60% of its value already but doesn"t look anywhere close to being done falling.


0128-DDS


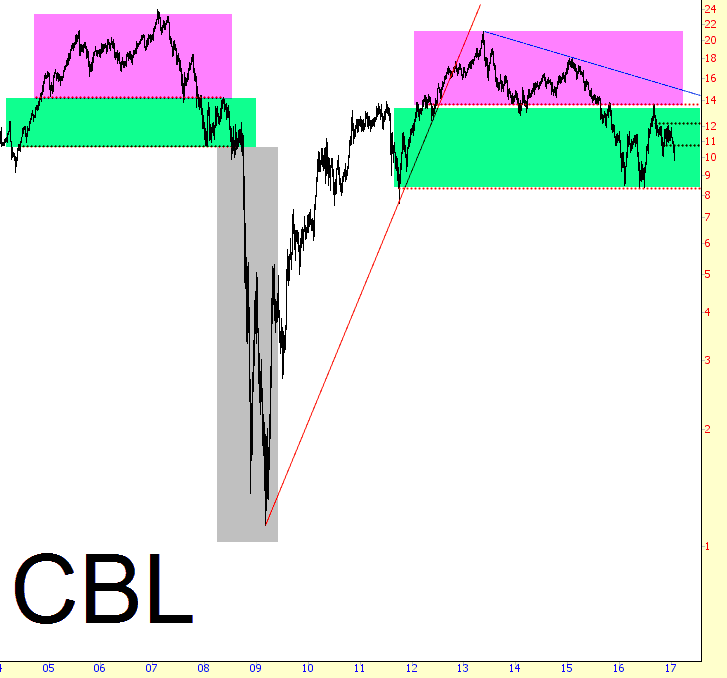
What got me thinking about all this was my best-performing short position, CBL Associates. I wasn"t sure what they did, but it turns out they are a big player in retail real estate - - hence their stock is also in a terrific analog and appears to be screwed and tattooed.


0128-CBL


If anyone is looking for rumblings to signal the kind of break in 2006/2007 that preceded the financial crisis, look no further than the charts above.