Showing posts with label BP. Show all posts

Wednesday, December 27, 2017

THE U.S. SHALE OIL INDUSTRY: Swindling & Stealing Energy To Stay Alive

SRSrocco


By the SRSrocco Report,


While the U.S. Shale Energy Industry continues to borrow money to produce uneconomical oil and gas, there is another important phenomenon that is not understood by the analyst community.  The critical factor overlooked by the media is the fact that the U.S. shale industry is swindling and stealing energy from other areas to stay alive.  Let me explain.


First, let"s take a look at some interesting graphs done by the Bloomberg Gadfly.  The first chart below shows how the U.S. shale industry continues to burn through investor cash regardless of $100 or $50 oil prices:


The chart above shows the negative free cash flow for 33 shale-weighted E&P companies.  Even at $100 oil prices in 2012 and 2013, these companies spent more money producing shale energy in the top four U.S. shale fields than they made from operations.  While costs to produce shale oil and gas came down in 2015 and 2016 (due to lower energy input prices), these companies still spent more money than they made.  As we can see, the Permian basin (in black) gets the first place award for losing the most money in the group.


Now, burning through investor money to produce low-quality, subpar oil is only part of the story.  The shale energy companies utilized another tactic to bring in additional funds from the POOR SLOBS in the retail investment community... it"s called equity issuance.  This next chart reveals the annual equity issuance by the U.S. E&P companies:


According to the information in the chart, the U.S. E&P companies will have raised over $100 billion between 2012 and 2017 by issuing new stock to investors.  If we add up the funds borrowed by the U.S. E&P companies (negative free cash flow), plus the stock issuance, we have the following chart:


Thus, the U.S. E&P companies tapped into an additional $212 billion worth of funding over the last six years to produce uneconomical shale oil and gas.  Now, this chart is an approximation based on the negative free cash flow (RED color) from the four top U.S. shale fields and the shale equity issuance (OLIVE color).  So, how much money would these U.S. E&P companies need to make to pay back these funds?


Good question.  If we assume that the U.S. shale oil companies will be able to produce another 10 billion barrels of oil, they would need to make $21 a barrel profit to pay back that $212 billion.  However, they haven"t made any profits in at least the past six years, so why would they make any profits in the next six years?


Okay, now that we understand that the U.S. shale industry has been burning through cash and issuing stock to continue an unprofitable business model, let"s take it a step further.  If we understand that the U.S. shale energy industry is not making enough money from producing the oil and gas, then it also means that it takes more energy to produce it then we are getting from it.  Sounds strange... but true.


We must remember, investors, furnishing U.S. shale energy companies with funds are another way of providing ENERGY.  These U.S. shale energy companies are taking that extra $212 billion (2012-2017) and burning the energy equivalent to produce their oil and gas.  For example, it takes a lot more water to frack oil and gas wells.  To transport the water, we either do it by truck or by pipeline.  While this extra water usage is a Dollar Cost to the shale energy industry, it is really an ENERGY COST.  Think about all the energy it took to either transport the water by truck, or the energy it took to make the pipelines, install them and the energy to pump the water.


Moreover, if we add up all of the additional costs to produce U.S. shale oil and gas, the majority of it comes from burning energy, in one form or another.  Again, investor funds translate to burning energy.  Thus, the U.S. shale industry needs more energy to produce the oil and gas than we get from it in the first place.


Unfortunately, investors don"t see it this way because they do not realize they will never receive their investment back.  It was spent and burned years ago to continue the Great U.S. Shale Energy Ponzi Scheme.


Let me put it in another way.  The U.S. and world economies are based on burning energy.  When we burn energy, we create economic activity and hopefully growth.  If the U.S. shale energy industry needed $212 billion more to produce the oil than they made from operations, then it means it burned more energy than it sent to the market.  Do you see that now??


So, the U.S. shale energy industry is STEALING & SWINDLING energy wherever it can to stay alive.  This is the perfect example of the Falling EROI (Energy Returned On Investment) forcing an industry to CANNABLIZE itself (and the public) to keep from going bankrupt.


Lastly, as time goes by the U.S. shale energy industry will behave like a BLACK HOLE, by sucking more and more energy in to produce even lower and lower quality oil and gas.  At some point, the shale energy industry will collapse upon itself leaving one hell of a mess behind.  While it"s hard to predict the timing of the event, it will likely occur within the next 2-5 years.


Check back for new articles and updates at the SRSrocco Report. 

Tuesday, October 17, 2017

WORLD’S LARGEST OIL COMPANIES: Deep Trouble As Profits Vaporize While Debts Skyrocket

SRSrocco


By the SRSrocco Report,


The world"s largest oil companies are in serious trouble as their balance sheets deteriorate from higher costs, falling profits and skyrocketing debt.  The glory days of the highly profitable global oil companies have come to an end.  All that remains now is a mere shadow of the once mighty oil industry that will be forced to continue cannibalizing itself to produce the last bit of valuable oil.


I realize my extremely unfavorable opinion of the world"s oil industry runs counter to many mainstream energy analysts, however, their belief that business, as usual, will continue for decades, is entirely unfounded.  Why?  Because, they do not understand the ramifications of the Falling EROI - Energy Returned On Invested, and its impact on the global economy.


For example, Chevron was able to make considerable profits in 1997 when the oil price was $19 a barrel.  However, the company suffered a loss in 2016 when the price was more than double at $44 last year.  And, it"s even worse than that if we compare the company"s profit to total revenues.  Chevron enjoyed a $3.2 billion net income profit on revenues of $42 billion in 1997 versus a $497 million loss on total sales of $114 billion in 2016.  Even though Chevron"s revenues nearly tripled in twenty years, its profit was decimated by the falling EROI.


Unfortunately, energy analysts, who are clueless to the amount of destruction taking place in the U.S. and global oil industry by the falling EROI, continue to mislead a public that is totally unprepared for what is coming.  To provide a more realistic view of the disintegrating energy industry, I will provide data from seven of the largest oil companies in the world.


The World"s Major Oil Companies Debt Explode Since The 2008 Financial Crisis


To save the world from falling into total collapse during the 2008 financial crisis, the Fed and Central Banks embarked on the most massive money printing scheme in history.  One side-effect of the massive money printing (and the purchasing of assets) by the central banks, was that it pushed the price of oil to a record $100+ a barrel for more than three years.  While the large oil companies reported handsome profits due to the high oil price, many of them spent a great deal of capital to produce this oil.


For instance, the seven top global oil companies that I focused on made a combined $213 billion in cash from operations in 2013. However, they also forked out $230 billion in capital expenditures.  Thus, the net free cash flow from these major oil companies was a negative $17 billion... and that doesn"t include the $44 billion they paid in dividends to their shareholders in 2013.  Even though the price of oil was $109 in 2013; these seven oil companies added $45 billion to their long-term debt:


As we can see, the total amount of long-term debt in the group (Petrobras, Shell, BP, Total, Chevron, Exxon & Statoil) increased from $227 billion in 2012 to $272 billion in 2013.  Isn"t that ironic that the debt ($45 billion) rose nearly the same amount as the group"s dividend payouts ($44 billion)?  Of course, we can"t forget about the negative $17 billion in free cash flow in 2013, but here we see evidence that the top seven global oil companies were borrowing money even in 2013, at $109 a barrel oil, to pay their dividends.


Since the 2008 global economic and financial crisis, the top seven oil companies have seen their total combined debt explode four times, from $96 billion to $379 billion currently.  You would think with these energy companies enjoying a $100+ oil price for more than three years; they would be lowering their debt, not increasing it.  Regrettably, the cost for companies to replace reserves, produce oil and share profits with shareholders was more than the $110 oil price.


There lies the rub....


One of the disadvantages of skyrocketing debt is the rising amount of interest the company has to pay to service that debt.  If we look at the chart above, Brazil"s Petrobras is the clear winner in the group by adding the most debt.  Petrobras"s debt surged from $21 billion in 2008 to $109 billion last year.  As Petrobras added debt, it also had to pay out more to service that debt.  In just eight years, the annual interest amount Petrobras paid to service its debt increased from $793 million in 2008 to $6 billion last year.  Sadly, Petrobras"s rising interest payment has caused another nasty side-effect which cut dividend payouts to its shareholders to ZERO for the past two years.


Petrobras Annual Dividend Payments:


2008 = $4.7 billion


2009 = $7.7 billion


2010 = $5.4 billion


2011 = $6.4 billion


2012 = $3.3 billion


2013 = $2.6 billion


2014 = $3.9 billion


2015 = ZERO


2016 = ZERO


You see, this is a perfect example of how the Falling EROI guts an oil company from the inside out.  The sad irony of the situation at Petrobras is this:


If you are a shareholder, you"re screwed, and if you invested funds (in company bonds, etc.) to receive a higher interest payment, you"re also screwed because you will never get back your initial investment.  So, investors are screwed either way.  This is what happens during the final stage of collapsing oil industry.


Another negative consequence of the Falling EROI on these major oil companies" financial statements is the decline in profits as the cost to produce oil rises more than the economic price the market can afford.


Major Oil Companies" Profits Vaporize... Even At Higher Oil Prices


To be able to understand just how bad the financial situation has become at the world"s largest oil companies, we need to go back in time and compare the industry"s profitability versus the oil price.  To find a year when the oil price was about the same as it was in 2016, we have to return to 2004, when the average oil price was $38.26 versus $43.67 last year.  Yes, the oil price was lower in 2004 than in 2016, but I can assure you, these oil companies weren"t complaining.


In 2004, the combined net income of these seven oil companies was almost $100 billion..... $99.2 billion to be exact.  Every oil company in the group made a nice profit in 2004 on a $38 oil price.  However, last year, the net profits in the group plunged to only $10.5 billion, even at a higher $43 oil price:


Even with a $5 increase in the price of oil last year compared to 2004, these oil companies combined net income profit fell nearly 90%.  How about them apples.  Of the seven companies listed in the chart above, only four made profits last year, while three lost money.  Exxon and Total enjoyed the highest profits in the group, while Petrobras and Statoil suffered the largest losses:


Furthermore, the financial situation is in much worse shape because "net income" accounting does not factor in the companies" capital expenditures or dividend payouts.  Regardless, the world"s top oil companies" profitability has vaporized even at a higher oil price.


Now, another metric that provides us with more disturbing evidence of the Falling EROI in the oil industry is the collapse of  the "Return On Capital Employed."  Basically, the Return On Capital Employed is just dividing the company"s earnings (before taxes and interest) by its total assets minus current liabilities.  In 2004, the seven companies listed above posted between 20-40% Return On Capital Employed.  However, this fell precipitously over the next decade and are now registering in the low single digits:


In 2004, we can see that BP had the lowest Return On Capital Employed of 19.68% in the group, while Statoil had the highest at 46.20%.  If we throw out the highest and lowest figures, the average for the group was 29%.  Now, compare that to the average of 2.4% for the group in 2016, and that does not including BP and Chevron"s negative returns (shown in Dark Blue & Orange).


NOTE:  I failed to include the Statoil graph line (Magenta)  when I made the chart, but I added the figures afterward.  For Statoil to experience a Return On Capital Employed decline from 46.2% in 2004 to less than 1% in 2016, suggests something is seriously wrong.


We must remember, the high Return On Capital Employed by the group in 2004, was based on a $38 price of oil, while the low single-digit returns by the oil companies in 2016 were derived from a higher price of $43.  Unfortunately, the world"s largest oil companies are no longer able to enjoy high returns on a low oil price.  This is bad news because the market can"t afford a high oil price unless the Fed and Central Banks come back in with an even larger amount of QE (Quantitative Easing) money printing.


I have one more chart that shows just how bad the Falling EROI is destroying the world"s top oil companies.  In 2004, these seven oil companies enjoyed a combined net Free Cash Flow minus dividends of a positive $34 billion versus a negative $39.1 billion in 2016:


Let me explain these figures.  After these oil companies paid their capital expenditures and dividends to shareholders in 2004, they had a net $34 billion left over.  However, last year these companies were in the HOLE for $39.1 billion after paying capital expenditures and dividends.  Thus, many of them had to borrow money just to pay dividends.


To understand how big of a change has taken place at the oil companies since 2004, here are the figures below:


Top 7 Major Oil Companies Free Cash Flow Figures


2004 Cash From Operations = ............$139.6 billion


2004 Capital Expenditures = .................$67.7 billion


2004 Free Cash Flow = ...........................$71.9 billion


2004 Shareholder Dividends = ..............$37.9 billion


2004 Free Cash Flow - Dividends = $34 billion


2016 Cash From Operations = .................$118.5 billion


2016 Capital Expenditures = ....................$117.5 billion


2016 Free Cash Flow = ................................$1.0 billion


2016 Shareholder Dividends = ...................$40.1 billion


2016 Free Cash Flow - Dividends = -$39.1 billion


Here we can see that the top seven global oil companies made more in cash from operations in 2004 ($139.6 billion) compared to 2016 ($118.5 billion).   That extra $21 billion in operating cash in 2004 versus 2016 was realized even at a lower oil price.  However, what has really hurt the group"s Free Cash Flow, is the much higher capital expenditures of $117.5 billion in 2016 compared to the $67.7 billion in 2004.  You will notice that the net combined dividends didn"t increase that much in the two periods... only by $3 billion.


So, the lower cash from operations and the higher capital expenditures have taken a BIG HIT on the balance sheets of these oil companies.  This is precisely why the long-term debt is skyrocketing, especially over the past three years as the oil price fell below $100 in 2014.  To continue making their shareholders happy, many of these companies are borrowing money to pay dividends.  Unfortunately, going further into debt to pay shareholders is not a prudent long-term business model.


The world"s major oil companies will continue to struggle with the oil price in the $50 range.  While some analysts forecast that higher oil prices are on the horizon, I disagree.  Yes, it"s true that oil prices may spike higher for a while, but the trend will be lower as the U.S. and global economies start to contract.  As oil prices fall to $40 and below, oil companies will begin to cut capital expenditures even further.  Thus, the cycle of lower prices and the continued gutting of the global oil industry will move into high gear.


There is one option that might provide these oil companies with a buffer... and that is a new even larger Fed and Central Bank money printing scheme which would result in severe inflation and possibly hyperinflation.  But, that won"t be a long-term solution, instead just another lousy band-aid in a series of band-aids that have only postponed the inevitable.


The coming bankruptcy of the once mighty global oil industry will be the death-knell of the world economy.  Without oil, the global economy grinds to a halt.  Of course, this will not occur overnight.  It will take time.  However, the evidence shows that a considerable wound has already taken place in an industry that has provided the world with much-needed oil for more than a century.


Lastly, without trying to be a broken record, the peak and decline of global oil production will destroy the value of most STOCKS, BONDS and REAL ESTATE.  If you have placed most of your bests in one of these assets, you have my sympathies.


Check back for new articles and updates at the SRSrocco Report.

Friday, September 1, 2017

US Crude Production Stalls As Oil Rig Count Rolls Over

Amid the chaos and turmoil caused by Harvey, today"s rig count data is likely to change things as much as a fart in a hurricane. US crude production in the Lower 48 actually fell last week, syncing with the stabilization in the lagged oil rig count.


The US Oil Rig count held to two-month lows last week, unchanged at 759...


US Crude production in the Lower 48 dropped last week following a stabilization in rig counts (but rose 2k overall thanks to a pick up in Alaska)...


Notably RBOB prices are down today (and WTI) as  John Kilduff, a partner at Again Capital, notes “The government is actually reacting positively trying to address and do what they can,... There are some signs of life in several of the refineries already and the 1 million-barrel tapping of the SPR is also helping to ease anxieties over the storm”


Sunday, July 23, 2017

"I Have Taken A Closer Look At The Data From EIA...": Why Horseman Global Is Aggressively Shorting Shale

Having staged a dramatic reversal at the end of 2016, when the world"s formerly most bearish hedge fund - it was net short over 100% in late 2016, which in turn led to a -24% return last year...


... rerisked, turning flat in just a few months, Horseman Global - now short developed markets and long emerging markets, and having lost 8.31% through the end of June - is once again dipping its toes in shorting stocks in general, and shale producers in particular. And, in Russell Clark"s latest letter, the Horseman CIO explains why.


From Horseman Capital Management"s July Monthly Newsleter


Your fund made 85bps net last month. Gains came from FX book and long book.


The big returns in fund management for me always come from finding some perceived wisdom, in which the market so completely believes that its fundamentals are never questioned. Theoretically this should not happen that often, but in my experience, it’s a constant feature of the market. Once you have built a business around an economic proposition you have no financial incentive to question it.


The Japan bubble was built on the view that Japanese corporate culture was inherently superior. The Asian financial crisis had its genesis in the view that Asian corporates borrowing in US dollars was risk free. The dot com bubble in the view that all tech stocks would prosper. The financial crisis was built on the view that US house prices could never see a nationwide fall. The European crisis was built on the assumption that all European government bonds were of equal value. And the recent commodity crash was built on the assumption that Chinese consumption and low interest rates made commodities safe.


Having grown up, and spent my entire investing career in periods of bubble inflation and deflation, I am constantly minded to look for where the market is deceiving itself, and then positioning the fund to benefit from the process of realisation. Many years ago, I could see that the commodity bubble was ending, and Chinese growth was peaking. This meant that commodities would be weaker and inflation lower, making a short commodities, long bond position very effective. It was a great strategy, but its effectiveness ended early last year.


The good news is that new market delusion is now apparent to me. When I moved long emerging markets, and short developed markets, the one commodity I could not give detailed bullish reasons for was oil. Unlike most other commodities, the oil industry, in the form of US shale drillers has continued to receive investment flows throughout the entire downturn.


I had shorted shale producers and the related MLP stocks before, and I knew there was something wrong with the industry, but I failed to find the trigger for the US shale industry to fail. And like most other investors I was continually swayed by the statements from the US shale drillers that they have managed to cut breakeven prices even further. However, I have taken a closer look at the data from EIA and from the company presentations. The rising decline rates of major US shale basins, and the increasing incidents of frac hits (also a cause of rising decline rates) have convinced me that US shale producers are not only losing competitiveness against other oil drillers, but they will find it hard to make money. If US rates continue to stay low, then it is possible that the high yield markets may continue to supply these drillers with capital, but I think that this is unlikely. More likely is that at some point debt investors start to worry that they will not get their capital back and cut lending to the industry. Even a small reduction in capital, would likely lead to a steep fall in US oil production. If new drilling stopped today, daily US oil production would fall by 350 thousand barrels a day over the 


next month (Source: EIA).


What I also find extraordinary, is that it seems to me shale drilling is a very unprofitable industry, and becoming more so. And yet, many businesses in the US have expended large amounts of capital on the basis that US oil will always be cheap and plentiful. I am thinking of pipelines, refineries, LNG exporters, chemical plants to name the most obvious. Even more amazing is that other oil sources have become more cost competitive but have been starved of resources. If US oil production declines, the rest of the world will struggle to increase output. An oil squeeze looks more likely to me. A broader commodity squeeze also looks likely to me.


In the latest letter"s sector allocation, Clark also added the following section providing a more detailed explanation why he has boosted his shale short to 15.5%:


We are negative on the US shale sector, during the month we increased the short exposure to oil exploration and MLPs to about 15.5%. Conventional oil wells typically produce in 3 stages: the start-up rising production stage lasts 2 to 3 years, it is followed by a plateau stage which lasts another 2-3 years and a long declining stage, during which production declines at rates of 1% to 10% per year. These wells generally produce over 15 to 30 years (Source: Planete energies).


In contrast, production from unconventional / shale wells peaks within a few months after it starts and decreases by about 75% after one year and by about 85% after two years (Source Permian basin, Goldman Sachs). This means that, in order to keep producing, shale producers need to constantly drill new wells.


Shale drilling is characterised by drilling horizontally into the layers of rock where hydrocarbons lie. Then hydraulic fracturing which consists of pumping a mixture of water, proppant (sand) and chemicals into the rock at high pressure, allows hydrocarbons to be extracted out to the head of the well.


Since 2016, as oil prices rallied, the number of rigs in the Permian basin, which is currently the most sought after drilling area in the US, rose from about 150 to almost 400. Furthermore, operations have moved into a high intensity phase as wells are drilled closer together, average lateral lengths increased over 80% from 2,687 ft in early 2012 to 4,875 ft in 2016 and the average volume of proppant per lateral foot more has than doubled (Source: Stratas Advisors).


Intensive drilling is causing a problem called ‘frac-hits’, which are cross-well interferences. These happen when fracking pressure is accidently transferred to adjacent wells that have less pressure integrity. As a result a failure of pressure control occurs, which reduces production flow. In the worst cases, pressure losses can result in a total loss of production that never returns. According to a senior reservoir engineer at CNOOC Nexen, frac-hits have now become a top concern, they can affect several wells on a pad along with those on nearby pads (Sources: Journal of Petroleum Technology).


A former engineer for Southwestern Energy said that frac-hits are very difficult to predict, the best way to respond is with trial and error and experimenting with well spacing and frac sizes to find the optimal combination.


In May Range Resources reported that it was forced to shut wells in order to minimise the impact of frac-hits. This month Abbraxas Petroleum said it will be shutting in several high-volume wells for about a month (Source: Upstream).


In the Permian basin new well production per rig continued to decline in June, from 617 barrels per day down to 602. In the meantime, legacy oil production, which is a function of the number of wells, depletion rates and production outages such as frac hits, is continuing to rise. (Source: EIA)


In light of the above growing short bet on shale, this is how Clark is positioned:


The analysis leads me to be potentially bearish on bonds, bearish on US shale drillers, but bullish on commodities. Over the month, we have added to US shale shorts, while also selling our US housebuilder longs. We continue to build our US consumer shorts, where the combination of higher oil prices and higher interest rates should devastate an industry already dealing with oversupply and the entry of Amazon into ever more areas. The combination of long mining and short shale drillers has the nice effect of reducing volatility, but ultimately offering high returns. The combination of portfolio changes has taken us back to a net short of over 40%. I find market action is supporting my thesis, and the research and analysis is compelling. Your fund remains short developed markets, long emerging markets.


While we will have more to say on this, Clark may be on to something: as the following chart from Goldman shows, the number of horizontal rigs funded by public junk bond issuance has not changed in the past 3 months. Is the funding market about to cool dramatically on US shale, and if so, just how high will oil surge?


Wednesday, July 19, 2017

3 California Counties File Multi-Billion Dollar Lawsuits Against "Big Oil" Over Rising Sea Levels

Just when you think you"ve seen it all, the snowflake capital of the world finds new, creative and amazing ways to shock your system.  In it"s latest attempt to do just that, three California counties, two in the Bay Area and one in Southern California, have filed a lawsuit against 37 of the world’s biggest oil and coal companies alleging they"re ultimately responsible for the public"s usage of fossil fuels and the greenhouse gas emissions they create which will ultimately contribute to rising sea levels and lay waste to their cities...at least that seems to be the "logic" as far as we can tell.


According to The Chronicle, Marin County, San Mateo County and Imperial Beach (located in San Diego County) filed separate but nearly identical lawsuits in their respective Superior Court offices that seek to tie fossil fuel development to climate-related problems in coastal areas. Attorneys for the three counties worked together on their lawsuits and noted that their residents have already experienced more frequent flooding and beach erosion as well as the possibility that water will eventually inundate roads, airports, sewage treatment plants and other real estate.


Of course, we would love to know just how many polar bear-killing private flights these taxpayer-funded legal teams took back and forth between San Francisco and San Diego while drafting their highly practical lawsuit.


Moreover, wouldn"t it be more appropriate to sue the owners of the 27 million, give or take, vehicles registered in California, more than any other state by a very wide margin by the way, who are shamelessly destroying the planet by commuting back and forth to work each day?  Afterall, if there were no demand for fossil fuels then none of these companies would exist.


California


Of course, the lawyers contend that the oil companies knew about the damage their actions were causing, denied it and sought to discredit scientific findings that greenhouse gas emissions were heating the Earth’s atmosphere.


The suits are just the latest in a small but growing effort to hold Chevron, ExxonMobil, BP, Shell and other major energy companies accountable for the effects of climate change. Legal experts say the challenge is more comprehensive than previous endeavors, and is based on "better climate science" and more evidence to support a claim of conspiracy among oil company executives.


“This is a long-anticipated move in climate litigation,” said Michael Burger, executive director of the Sabin Center for Climate Change Law at Columbia University. “You’ll find pieces of it in other cases, but bringing it together like this is different than what’s been done before. You can expect there will be a great deal of interest in how this litigation proceeds.”


“There’s tremendous concern for us as a county on how do we address these issues,” said Marin County Supervisor Kate Sears. “This case is about fairness and accountability and standing up for our residents and businesses.”


“We think we meet the elements of the public nuisance,” Beiers said, “but obviously we recognize this as the first lawsuit of its kind.”


Climate change


So how much are these snowflake havens seeking in damages?  Well the exact cost of the total death and destruction that will ultimately befall America"s left coast has apparently not yet been calculated with any level of specificity but it"s at least $55 billion according to San Mateo and Marin counties. 


The two Bay Area counties and Imperial Beach are seeking reimbursement for current and future losses caused by climate change, as well as punitive damages. The suits don’t specify the value of losses so far, but estimate that the total will be in the billions of dollars over coming decades.


San Mateo County says the Bayshore Freeway, BART lines, San Francisco International Airport and $39 billion worth of assessed property are threatened by projected sea-level rise. Marin County counts $15.5 billion worth of North Bay real estate in harm’s way, along with ferry terminals, SMART rail tracks and Highway 101 and Interstate 580.


Of course, if you discount that $55 billion at 7%, the same rate the CalPERS uses to discount their pension obligations, for a period of 250 years to adjust for when the damages are actually expected to occur then the present value of the asserted damages is roughly $2,500.  Perhaps Exxon and Chevron should just split the cost and move on...

Thursday, July 6, 2017

Is The Second Shale Boom Grinding To A Halt?

Authored by Nick Cunningham via OilPrice.com,


There are some early signs that the shale boom is once again coming to a halt, beaten back by another bear market.


The oil rig count declined by 2 last week, the first decline in six months. It is too early to tell whether or not this is a trend – it is one data point, after all – but if the surging rig count starts to flatten out or even decline a bit, it would provide a huge lift to the oil market.


It would also suggest that U.S. shale can’t continue to grow at such a rapid clip with oil prices below $45 per barrel. Shale is often likened as the new “swing producer,” that is, a source of supply that ramps up and down on short notice in order to balance the market. Reasonable people can debate that moniker, but if forthcoming data in the next few weeks shows that shale is slowing down, it would appear that prices in the mid-$40s are the threshold around which shale turns on and off.


(Click to enlarge)


A second piece of data also adds some weight to the notion that U.S. shale could be struggling with oil prices in the $40s. The EIA reported that U.S oil production dipped by 100,000 bpd for the week ending on June 23, the largest weekly decline in over a year.


(Click to enlarge)


More solid evidence comes from the retrospective monthly numbers, which are published with a several month delay but tend to be more accurate. The EIA just reported figures for April, which show U.S. oil production dipping to 9.083 mb/d, down from 9.107 mb/d in March. It was the first monthly decline in output in 2017.


Again, these are only a few data points, so they do not necessarily prove anything. But if they are the start of a trend – if rig counts flatten out and production starts to fall – it would be a significant development. The EIA has predicted that the U.S. will grow production from the roughly 9.3 million barrels per day (mb/d) currently up to 10 mb/d by next year. That could be a difficult target to meet if the rebound starts to fizzle.


Moreover, a slowdown and perhaps even a decline in production would also dispel the belief that shale can continue to grow at sub-$40 oil prices. A lot of shale companies have boasted about their lower breakeven prices, and some say they can even make money with oil below $30 per barrel. That may be true for individual companies, but not for the industry as a whole. Conventional wells deplete at a rate of around 5 percent annually, and shale wells decline at a much faster rate. Without heavy drilling activity, overall production will fall. We will need more data, but again, that threshold for growth could pivot around the $45 price level.


Of course, slowing production will induce higher prices, which in turn, could provide more breathing room for drillers.


In fact, only two weeks after oil officially entered bear market territory, the market is starting to regain a bit of confidence, which is no doubt influenced by the sudden slowdown in U.S. shale. Hedge funds and other money managers staked out the most bearish position on crude futures in nearly a year, but the most recent data showed that the buildup of short bets slowed to a trickle. The past week of oil price gains could reverse that rush towards a bearish positioning. “That slowdown was the prelude to what should be probably a pretty sizable net change in the position next week,” John Kilduff, partner at Again Capital, told Bloomberg. The liquidation of bullish bets could be “running out of steam,” he said.


That might mean that there is a little more room for oil on the upside. Sharp selloffs can slow things down, setting up the conditions for a tighter market. "Sentiment has turned and I think we should be going up (in price). I don"t think it"s going to last, but the momentum at the moment is with the bulls," PVM Oil Associates strategist Tamas Varga said in a Reuters interview.


Others are in agreement. "You are going to see crude oil inventories globally and domestically begin to decline month after month. That will support crude oil prices, boosting the entire sector," Rob Thummel, managing director for Tortoise Capital Advisors, told CNBC, adding that the “fundamentals are set up for a second-half comeback.”


It is also possible that the latest string of data pointing to a slowdown in the shale patch could be a one-off anomaly. If the rig count and weekly production figures resume their year-long climb, sentiment will quickly turn negative once again. David Leben, director of commodity derivatives at BNP Paribas, told the WSJ that the situation is not dramatically different from two weeks ago. “All the bearish things are kind of still in play,” he said.

Friday, June 30, 2017

US Oil Rig Count Drops For First Time In 24 Weeks As Trump Unveils US-Mexico Petroleum Pipeline

Last week saw US crude production decline by the most since Aug 2016 (perhaps affected by "Cindy") and given the lagged response to WTI prices, many expected the oil rig count to drop this week. As WTI heads for its 7th up-day in a row - the longest streak in 6 months - it is supported as the US oil rig count dropped 2 to 756, the first drop in almost 6 months.


“Is it possible we’d have our first negative number in 24 reports? Unlikely but it’s possible” when you see production down 3 of the past 7 weeks,  Bob Yawger, director of the futures division at Mizuho Securities USA in New York, says by telephone


  • *U.S. GAS RIG COUNT UP 1 TO 184 , BAKER HUGHES SAYS :BHI US

  • *U.S. OIL RIG COUNT DOWN 2 TO 756 , BAKER HUGHES SAYS :BHI US


WTI lifted modestly on the print holding earlier gains...


Lower 48 Production fell 55k b/d last week - the biggest drop since Aug 2016...


Total U.S. crude output dropped 100k b/d to 9.25m b/d last week, biggest drop in almost a year and 3rd decrease in the last 7 weeks, according to EIA report Wednesday


We suspect the drop is related to shut-ins from tropical depression Cindy and will recover quickly. It appears President Trump is confident that the Lower 48 will keep pumping as OilPrice.com"s Tsvetana Paraskova reports, to boost American energy exports, the administration of U.S. President Donald Trump has approved the construction of a new petroleum pipeline from the U.S. to Mexico that “will go right under the wall,” President Trump said on Thursday.


As part of the ‘energy week’, which promotes U.S. global leadership and dominance in energy, President Trump announced six initiatives “to propel this new era of American energy dominance,” he said.


The first initiative is the U.S. to start reviving and expanding its nuclear energy sector. Next, the Department of the Treasury will address barriers to the financing of highly efficient, overseas coal energy plants, President Trump said, mentioning Ukraine as one of the countries that need coal. The third initiative is the petroleum pipeline to Mexico. The fourth step to growing American relevance in global energy is U.S. Sempra Energy signing a deal to start negotiating sales of more American natural gas to South Korea.


The U.S. also approved two long-term applications to export additional natural gas from the Lake Charles LNG terminal in Louisiana, President Trump said, pointing out the fifth initiative. As a sixth initiative, the U.S. is “creating a new offshore oil and gas leasing program” to open up more areas for offshore development, President Trump said.


“We will be dominant. We will export American energy all over the world, all around the globe. These energy exports will create countless jobs for our people, and provide true energy security to our friends, partners, and allies all across the globe,” President Trump said in his speech.


The U.S. Department of State issued on Thursday three pipeline presidential permits for U.S.-Mexico pipelines. The permit for the New Burgos Pipeline authorizes construction, connection, operation, and maintenance of a new pipeline that has the capacity to deliver up to 108,000 bpd of certain refined petroleum products. The pipeline will cross the U.S.-Mexico border near Peñitas, Texas.


“New permits for the existing Dos Laredos and existing Burgos pipelines, which cross the border in Texas near Laredo and Peñitas, respectively, reflect a change in the name of the permit holder and authorize transport of a broader range of petroleum products than under the previous Presidential permits,” the Department of State said.


The U.S. Department of Energy announced on Thursday the approval of the two long-term applications to export additional LNG from the Lake Charles LNG Liquefaction Project in Lake Charles, LA.

Friday, June 23, 2017

Largest East Coast Pipeline Reveals Demand For Gasoline Is Crashing

There"s a reason this week"s EIA survey showing gasoline and oil supplies declining has failed to stop RBOB prices from collapsing to 7-month lows: The start of the summer has done nothing to revive sluggish demand. That"s because despite what the EIA survey said, little has been done to reduce record fuel inventories.


The squeeze has gotten so bad, Northeast Colonial Pipeline Co., the operator of the biggest US fuel pipeline system, said that demand to transport gasoline to the country"s populous northeast is the weakest in six years, the latest symptom of a global oil market grappling with oversupply. It’s notable that this peak has arrived despite the advent of the summer driving season, which has seen gasoline demand pull back from last year"s record highs, according to Reuters.


Because of the oversupply in the northeast, “line space”… the cost of renting “space” on the pipeline to assure one’s ability to get supplies of gasoline when necessary… has gone negative, according to Reuters. What can be more exemplary of excess inventories and of reduced demand for gasoline than this?


Refiners are in part to blame for the problem - they have continued to pump motor fuel at record levels for the second year in a row, worsening the oversupply problem, for fear of losing access to pipeline capacity. 


More broadly, attempts by large producers to reduce global supplies have failed to meaningfully raise the price of oil.  And with good reason: Traders have been skeptical of an agreement between OPEC and non-OPEC producers, including Russia, to extend last year"s supply cut, and already they"re concerns are being validated: Iraq has said it plans to increase production later this year despite the agreement.


The existence of negative capacity is a reversal of the typical dynamic, where refiners are forced to supplement their deliveries with tanker shipments or imports.


"The only reason [the pipelines] wouldn"t be full is clearly that inventory levels are high enough that there is no incentive to move product to New York," said Sandy Fielder, director of oil and products research, Morningstar in Austin, Texas.


"The situation is quite unusual," he said.


Even when high inventories make it unprofitable to do so, refiners typically keep pumping full volumes just to ensure they keep their rights to the line space, said Fielden.


But it appears as if refiners have finally reached the point where the financial pain outweighs the necessity of keepig their lease on some pipeline space - after all, Colonial has capacity to spare right now.


"It"s purely economic - why ship into a negative arb(itrage) for that long," one trader said.


Colonial connects Gulf Coast refineries with markets across the southern and eastern United States through more than 5,500 miles (8,850 km) of pipelines, delivering gasoline, diesel, jet fuel and other refined products. Colonial indicated it did not expect demand to exceed capacity for the next five-day cycle through the line, and informed shippers it would therefore not follow the typical process for rationing space.


Oil traders who insist on staying long can hold out hope that production shutdowns related to Tropical Storm Cindy could lift the price of oil for a short period. It"s also worth noting that  Dennis Gartman, who recently said oil wouldn"t rise above $44 a barrel again in his lifetime, just turned bullish folllowing a wave of downgrades from energy analyst. That could be good news...or maybe not.


While the cause of the supply is obvious, whatever has caused demand to fall off is less clear. Barclays has suggested that President Donald Trump"s immigrant crackdown has made millions of illegal immigrants living in the US afraid to get behind the wheel for fear of being detained and deported. If this is true, that means Trump is to thank for gasoline prices falling to their lowest levels since February, despite the start of the summer driving season?

Wednesday, April 19, 2017

Trump Mulling Reneging on Another Campaign Pledge, Thanks to Ivanka and Jared Kushner

The global warming activist democrats in Trump"s White House, led by Ivanka and Jared Kushner, are trying to convince the President to reneg on yet another campaign pledge, against the advice of Steve Bannon.


According to Bloomberg, a pro Paris bloc in his administration, which targets greenhouse emissions, is recruiting energy companies to lobby the President to remain in the controversial agreement that he specifically said was a waste of money during the campaign.


Liquified natural gas producer, $LNG, is an ardent supporter of the agreement, obvious reasons.


"Domestic energy companies are better positioned to compete globally if the United States remains a party to the Paris agreement," Cheniere wrote. The accord "is a useful instrument for fostering demand for America’s energy resources and supporting the continued growth of American industry."


Additionally, Exxon Mobil, Royal Dutch Shell Plc and BP Plc are pro agreement. This is classic crony capitalism. By erecting environmental obstacles, the above energy giants will, effectivley, create a moat around their businesses. No one actually believes BP or Exxon cares about global warming, right?


Both Steve Bannon and EPA head, Scott Pruitt want out of the agreement. But, since Trump"s fashion designer daughter wants to keep her liberal NYC friends, the President is said to be weighing his options.


Trump is nearing a decision on whether he will fulfill repeated pledges to withdraw the U.S. from the accord he previously derided as "bad for U.S. business." The White House postponed a planned Tuesday meeting of senior administration officials, including Pruitt, Tillerson, Kushner and Bannon, to go over the pros and cons of staying in the agreement, according to an aide citing a scheduling conflict.
 
The administration will decide what to do before late next month, when world leaders gather for the Group of Seven summit in Italy, White House press secretary Sean Spicer said.
 
Not every energy executive is on board. Coal baron Robert E. Murray has been outspoken in criticizing the deal, arguing it’s "just a way for other countries to get American money."


Sec. of State,  Rex Tillerson, warned that backing out of the deal might cause the eurofags to retaliate by boycotting US businesses.


The Paris agreement, formed under Obama, commits America to cut emissions by 26% by 2025.


"The Paris agreement is designed to undermine American self government over the long term because the whole point of it is to put the United States inside a political pressure cooker" and influence domestic energy policy, said Marlo Lewis, a senior fellow at the Competitive Enterprise Institute. "The coal companies and oil and gas companies that are flirting with the Paris agreement don’t understand the existential threat that they’re buying into.”


We eagerly await the outcome of yet another Bannon v Kushner battle.


Content originally published at iBankCoin.com

Thursday, February 23, 2017

Exxon Cuts Reserves By A Record 3.3 Bilion Barrels As Oil Crash Finally Takes Toll

Last September, when the price of oil was well below where it had been trading for the bulk of the past several years,  we reported that NY Attorney General Eric Schneiderman was probing why Exxon Mobil hasn’t written down the value of its assets, two years into a pronounced crash in oil prices. The complaint was simple: out of the 40 biggest publicly traded oil companies in the world, Exxon - then still led by now Secretary of State Rex Tillerson - was the only one that hasn’t booked any impairments in the prior 10 years.


As the WSJ wrote at the time, "since 2014, oil producers world-wide have been forced to recognize that wells they plan to drill in the future are worth $200 billion less than they once thought, according to consultancy Rystad Energy. Because the fall in prices means billions of barrels cannot be economically tapped, such revisions have become a staple of oil-patch earnings, helping to push losses to record levels in recent years." And yet, Exxon had - until the later half of 2016 - declined to take any write-downs, the only major oil producer not to do so, which has led some analysts to question its accounting practices. 


Maybe the NYAG was on to something? 


To be sure, the company had played down the criticism, saying it is extremely conservative in booking the value of new potential fields and wells. That reduced its exposure to write-downs if the assets later prove to be worth less than expected. Then again, not even the most "conservative" company could have factored in oil crashing from $100 to $42 without that impacting the balance sheet.


Needless to say, avoiding reality and Exxon’s "ability" to avoid write-downs, and the massive losses that come with them, had been the main factors helping the company outperform rivals since prices began falling in mid-2014. Exxon shares had fallen by about half of the average of top peers Chevron,  Royal Dutch Shell, Total and BP. Since 2014, those companies have booked more than $50 billion overall in write-downs and impairments.  But not Exxon.


Then-CEO Rex Tillerson has an unusual explanation why Exxon has refused to write down assets so far: Rex told trade publication Energy Intelligence in 2015 that the company has been able to avoid write-downs because it places a high burden on executives to ensure that projects can work at lower prices, and holds them accountable.


“We don’t do write-downs,” Mr. Tillerson told the publication. “We are not going to bail you out by writing it down. That is the message to our organization.”


All of that changed this afternoon, when Exxon, now ex-Tillerson, disclosed the deepest reserves cut in its history as the ongoing rout in oil prices erased the value of a $16 billion oil-sands investment and other North American assets.  In a press release filed after the close, Exxon announced that "proved reserves were 20 billion oil-equivalent barrels at year-end 2016, inclusive of a net reduction of 3.3 billion oil-equivalent barrels from 2015. Reserves changes in 2016 reflect new developments as well as revisions and extensions to existing fields resulting from drilling, studies, analysis of reservoir performance and application of the methodology prescribed by the U.S. Securities and Exchange Commission."


As a result of very low prices during 2016, certain quantities of liquids and natural gas no longer qualified as proved reserves under SEC guidelines.


In other words, after years of denials, and claims that "we don"t do write-down", Exxon just concluded the biggest reserve cut on record, as 3.3 billion barrels of crude was removed from the company"s "proved reserves" category. The revisions were triggered when low energy prices made it mathematically impossible to profitably harvest those fields within five years. The massive 3.5-billion barrel Kearl oil-sands development in western Canada accounted for most of the hit, with another 800 million oil-equivalent barrels in North America did not qualify as proved reserves, "mainly due to the acceleration of the projected economic end-of-field life."


Following the reserve cut, the company"s total reserves dropped to 20 billion, the lowest in two decades.


As Bloomberg adds, the oil-sand mines in northern Alberta are among the costliest types of petroleum projects to develop because the raw bitumen extracted from the region must be processed and converted to a thick, synthetic crude oil. As such, they have been particularly hard hit by the worst oil slump in a generation.


The reductions were partially offset by reserves additions of oil and natural gas totaling approximately 1 billion barrels of oil equivalent in the U.S., Kazakhstan, Papua New Guinea, Indonesia and Norway, which replaced 65% of production and were the result of acquisitions, improved asset performance and a decision to fund an expansion of the Tengiz project in Kazakhstan.


According to Bloomberg calculations, the 19 percent drop amounts to the largest annual cut since at least the 1999 merger that created the company in its modern form. That includes 1.5 billion barrels of reserves that were pumped from wells. The previous record cut was a 3 percent reduction taken during the height of the global financial crisis in 2008.


Proved Reserves are among the most important metrics watched by investors because they are an indicator, along with commodity prices, of future cash flow. When the 2008 reserves cut was announced in February 2009, Exxon shares lost more than 4 percent in a single day, wiping out almost $17 billion in market value.


Today, after the biggest reserve write down in history, the shares gained 0.2% to $81.08 in after-hours trading as of 5:46 p.m. in New York on Wednesday, after closing at $80.93, suggesting that either the market does not care about fundamentals, or had largely priced in the announcement. As noted above, Exxon was facing an SEC probe into how it valued its portfolion, and signaled in October and again last month that the revision was probably coming, which may explain the lack of reaction.


On Tuesday, ConocoPhillips engaged in a similar reserve reduction when it removed the equivalent of 1.15 billion barrels of oil-sands crude from its books as part of a 21 percent cut that pushed the Houston-based company’s reserves to a 15-year low.


Under SEC rules, proved reserves can only include oil fields that can be produced economically within the next half decade. Price trends from the previous 12 months are compared against the estimated cost to harvest crude and gas in determining which reserves are counted.

Tuesday, February 21, 2017

Oops! The Economy Is Like A Self-Driving Car

Submitted by Gail Tverberg via Our Finite World blog,


Back in 1776, Adam Smith talked about the “invisible hand” of the economy. Investopedia explains how the invisible hand works as, “In a free market economy, self-interested individuals operate through a system of mutual interdependence to promote the general benefit of society at large.”


We talk and act today as if governments and economic policy are what make the economy behave as it does. Unfortunately, Adam Smith was right; there is an invisible hand guiding the economy. Today we know that there is a physics reason for why the economy acts as it does: the economy is a dissipative structure–something we will talk more about later.  First, let’s talk about how the economy really operates.


Our Economy Is Like a Self-Driving Car: Wages of Non-Elite Workers Are the Engine


Workers make goods and provide services. Non-elite workers–that is, workers without advanced education or supervisory responsibilities–play a special role, because there are so many of them. The economy can grow (just like a self-driving car can move forward) (1) if workers can make an increasing quantity of goods and services each year, and (2) if non-elite workers can afford to buy the goods that are being produced. If these workers find fewer jobs available, or if they don’t pay sufficiently well, it is as if the engine of the self-driving car is no longer working. The car could just as well fall apart into 1,000 pieces in the driveway.


If the wages of non-elite workers are too low, they cannot afford to pay very much in taxes, so governments are adversely affected. They also cannot afford to buy capital goods such as vehicles and homes. Thus, depressed wages of non-elite workers adversely affect both businesses and governments. If these non-elite workers are getting paid well, the “make/buy loop” is closed: the people whose labor creates fairly ordinary goods and services can also afford to buy those goods and services.


Recurring Needs of Car/Economy


The economy, like a car, has recurring needs, analogous to monthly lease payments, insurance payments, and maintenance costs. These would include payments for a variety of support services, including the following:


  • Government programs, including payments to the elderly and unemployed

  • Higher education programs

  • Healthcare

Needless to say, the above services tend to keep rising in cost, whether or not the wages of non-elite workers keep rising to keep up with these costs.


The economy also needs to purchase a portfolio of goods on a very regular basis (weekly or monthly), or it cannot operate. These include:


  • Fresh water

  • Food of many different types, including vegetables, fruits, and grains

  • Energy products of many types, such as oil, coal, natural gas, and uranium. These needs include many subtypes suited to particular refineries or electric power plants.

  • Minerals of many types, including copper, iron, lithium, and many others

Some of these goods are needed directly by the workers in the economy. Other goods are needed to make and operate the “tools” used by the workers. It is the growing use of tools that allows workers to keep becoming more productive–produce the rising quantity of goods and services that is needed to keep the economy growing. These tools are only possible through the use of energy products and other minerals of many kinds.


I have likened the necessary portfolio of goods the economy needs to ingredients in a recipe, or to chemicals needed for a particular experiment. If one of the “ingredients” is not available–probably because of prices that are too high for consumers or too low for producers–the economy needs to “make a smaller batch.” We saw this happen in the Great Recession of 2007 to 2009. Figure 1 shows that the use of several types of energy products, plus raw steel, shrank back at exactly the same time. In fact, the recent trend in coal and raw steel suggests another contraction may be ahead.


Figure 1. World Product Consumption, indexed to the year 2000, for selected products. Raw Steel based on World USGS data; other amounts based of BP Statistical Review of World Energy 2016 data.

Figure 1. World Product Consumption, indexed to the year 2000, for selected products. Raw Steel based on World USGS data; other amounts based of BP Statistical Review of World Energy 2016 data.


The Economy Re-Optimizes When Things Go Wrong 


If you have a Global Positioning System (GPS) in your car to give you driving directions, you know that whenever you make a wrong turn, it recalculates and gives you new directions to get you back on course. The economy works in much the same way. Let’s look at an example: 


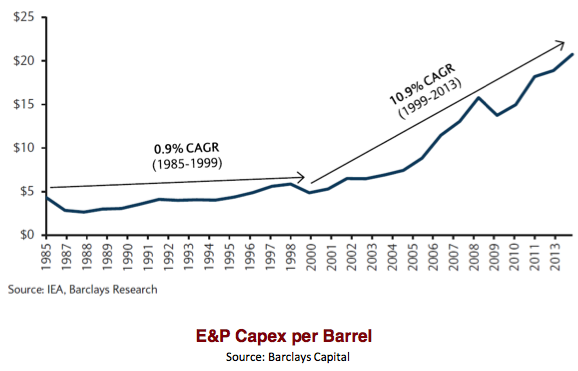
Back in early 2014, I showed this graph from a presentation given by Steve Kopits. It shows that the cost of oil and gas extraction suddenly started on an upward trend, about the year 1999. Instead of costs rising at 0.9% per year, costs suddenly started to rise by an average of 10.9% per year.


Figure 1. Figure by Steve Kopits of Westwood Douglas showing trends in world oil exploration and production costs per barrel. CAGR is

Figure 2. Figure by Steve Kopits of Westwood Douglas showing trends in world oil exploration and production costs per barrel. CAGR is “Compound Annual Growth Rate.”


When costs were rising by only 0.9% per year, it was relatively easy for oil producers to offset the cost increases by efficiency gains. Once costs started rising much more quickly, it was a sign that we had in some sense “run out” of new fields of easy-to-extract oil and gas. Instead, oil companies were forced to start accessing fields with much more expensive-to-produce oil and gas, if they wanted to replace depleting fields with new fields. There would soon be a mismatch between wages (which generally don’t rise very much) and the cost of goods made with oil, such as food grown using oil products.


Did the invisible hand sit idly by and let business as usual continue, despite this big rise in the cost of extraction of oil from new fields? I would argue that it did not. It was clear to business people around the world that there was a large amount of coal in China and India that had been bypassed because these countries had not yet become industrialized. This coal would provide a much cheaper source of energy than the oil, especially if the cost of oil appeared likely to rise. Furthermore, wages in these countries were lower as well.


The economy took the opportunity to re-optimize. Part of this re-optimization can be seen in Figure 1, shown earlier in this post. It shows that world coal supply has grown rapidly since 2000, while oil supply has grown quite slowly.


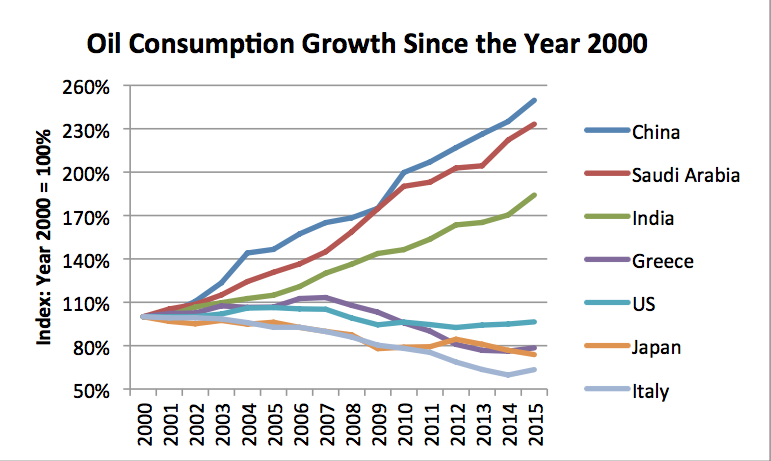
Figure 3, below, shows a different kind of shift: a shift in the way oil supplies were distributed, after 2000. We see that China, Saudi Arabia, and India are all examples of countries with big increases in oil consumption. At the same time, many of the developed countries found their oil consumption shrinking, rather than growing.


Figure 2. Figure showing oil consumption growth since 2000 for selected countries, based on data from BP Statistical Review of World Energy 2016.

Figure 3. Figure showing oil consumption growth since 2000 for selected countries, based on data from BP Statistical Review of World Energy 2016.


A person might wonder why Saudi Arabia’s use of oil would grow rapidly after the year 2000. The answer is simple: Saudi Arabia’s oil costs are its costs as a producer. Saudi Arabia has a lot of very old wells from which oil extraction is inexpensive–perhaps $15 per barrel. When oil prices are high and the cost of production is low, the government of an  oil-exporting nation collects a huge amount of taxes. Saudi Arabia was in such a situation. As a result, it could afford to use oil for many purposes, including electricity production and increased building of highways. It was not an oil importer, so the high world oil prices did not affect the country negatively.


China’s rapid rise in oil production could take place because, even with added oil consumption, its overall cost of producing goods would remain low because of the large share of coal in its energy mix and its low wages. The huge share of coal in China’s energy mix can be seen in Figure 4, below. Figure 4 also shows the extremely rapid growth in China’s energy consumption that took place once China joined the World Trade Organization in late 2001.


Figure 3. China energy consumption by fuel, based on BP 2016 SRWE.

Figure 4. China energy consumption by fuel based on BP 2016 Statistical Review of World Energy.


India was in a similar situation to China, because it could also build its economy on cheap coal and cheap labor.


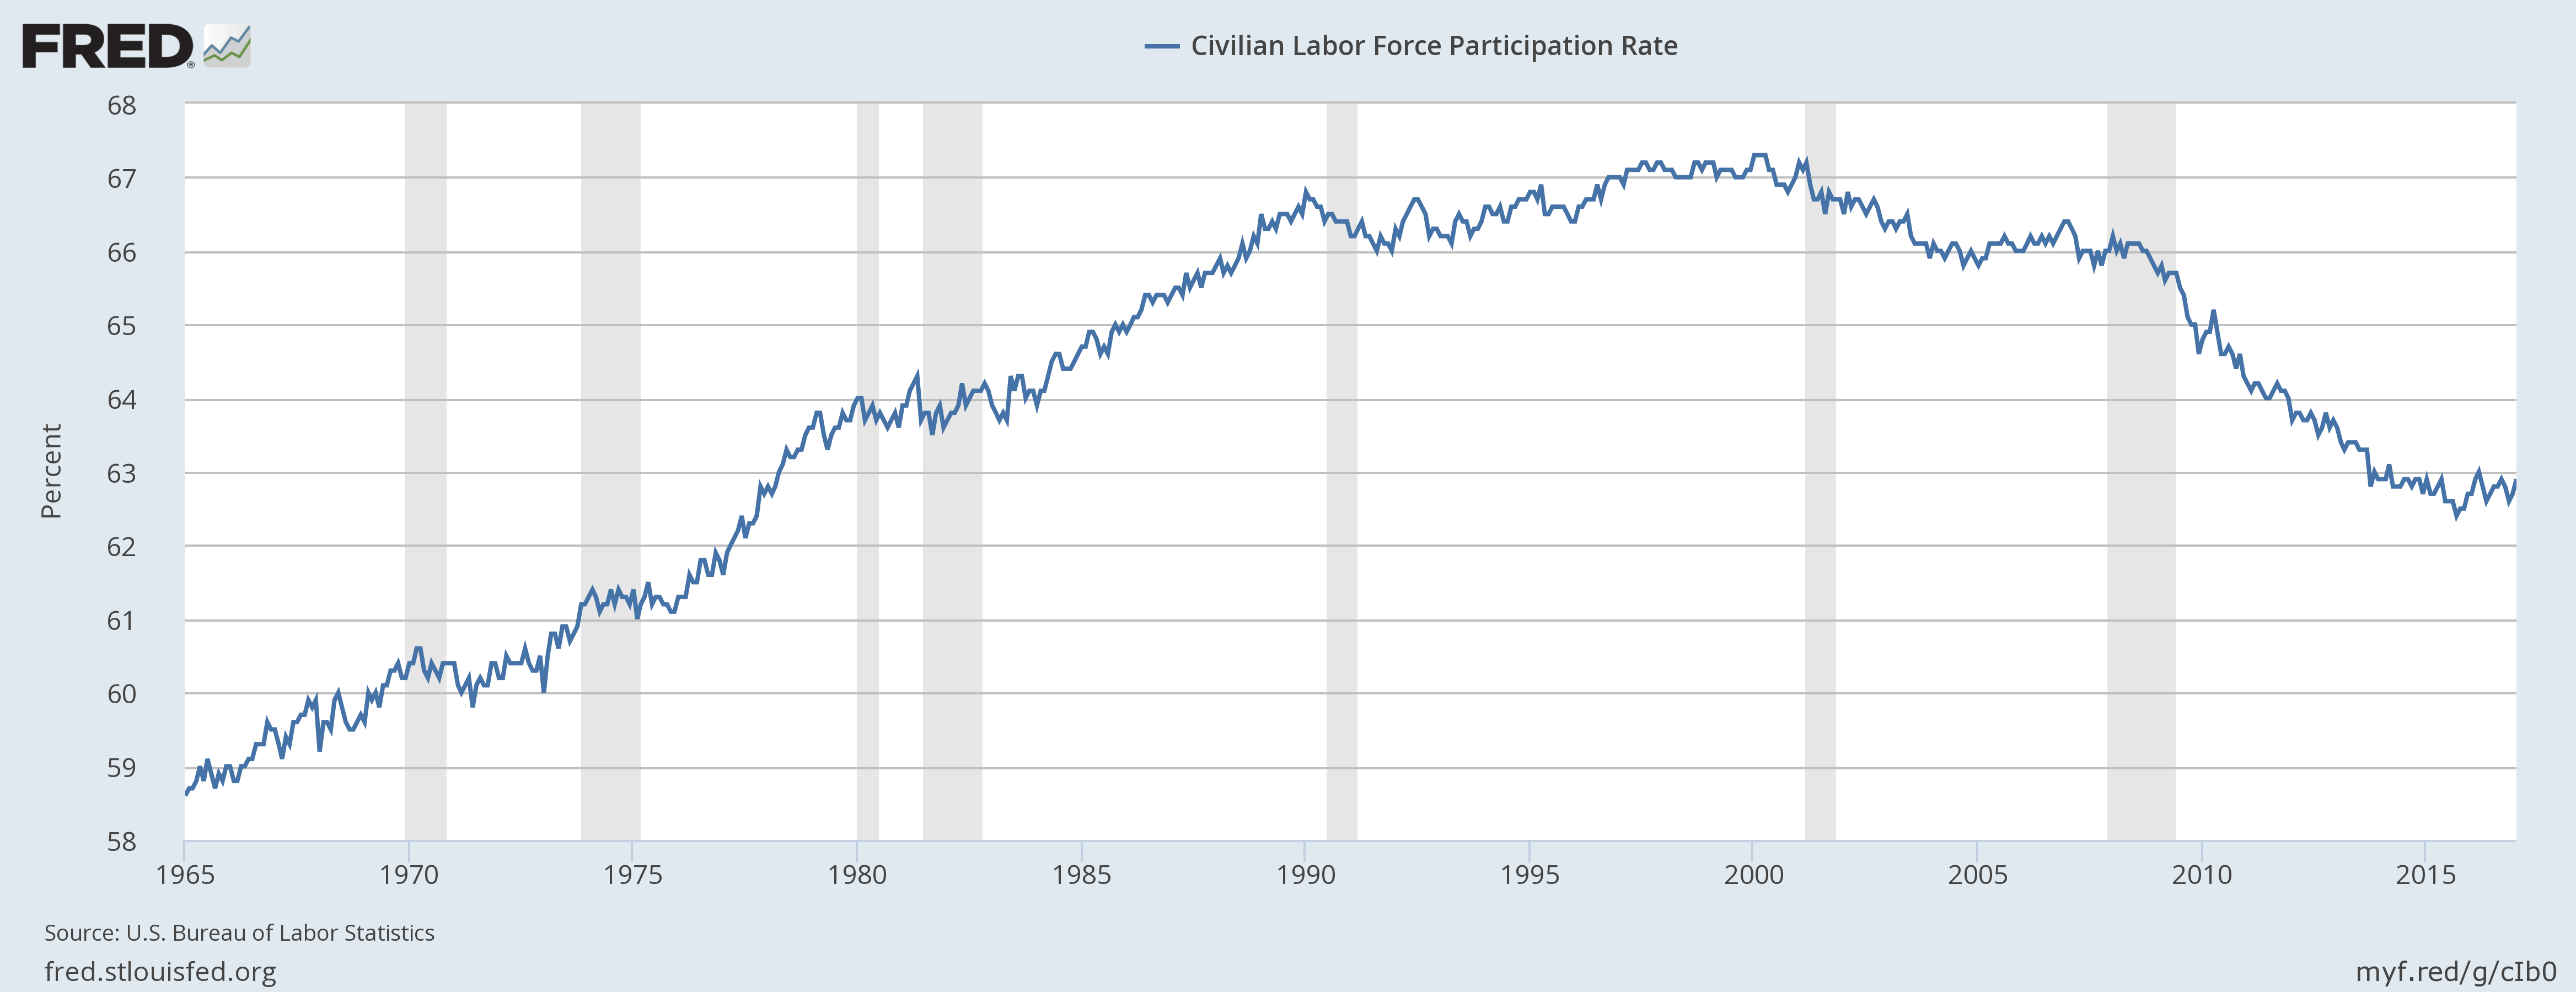
When the economy re-optimizes itself, job patterns are affected as well.  Figure 5 shows the trend in labor force participation rate in the US:


Figure 4. US Civilian labor force participation rate, based on US Bureau of Labor Statistics data, as graphed by fred.stlouisfed.org.

Figure 5. US Civilian labor force participation rate, based on US Bureau of Labor Statistics data, as graphed by fred.stlouisfed.org.


Was it simply a coincidence that the US labor force participation rate started falling about the year 2000? I don’t think so. The shift in energy consumption to countries such as China and India, as oil costs rose, could be expected to reduce job availability in the US. I know several people who were laid off from the company I worked for, as their jobs (in computer technical support) were shifted overseas. These folks were not alone in seeing their jobs shipped overseas.


The World Economy is Like a Car that Cannot Make Sharp Turns 


The world economy cannot make very sharp turns, because there is a very long lead-time in making any change. New factories need to be built. For these factories to be used sufficiently to make economic sense, they need to be used over a long period.


At the same time, the products we desire to make more energy efficient, for example, automobiles, homes, and electricity generating plants, aren’t replaced very often. Because of the short life-time of incandescent light bulbs, it is possible to force a fairly rapid shift to more efficient types. But it is much more difficult to encourage a rapid change in high-cost items, which are typically used for many years. If a car owner has a big loan outstanding, the owner doesn’t want to hear that his car no longer has any value. How could he afford a new car, or pay back his loan?


A major limit on making any change is the amount of resources of a given type, available in a given year. These amounts tend to change relatively slowly, from year to year. (See Figure 1.) If more lithium, copper, oil, or any other type of resource is needed, new mines are needed. There needs to be an indication to producers that the price of these commodities will stay high enough, for a long enough period, to make this investment worthwhile. Low prices are a problem for many commodities today. In fact, production of many commodities may very well fall in the near future, because of continued low prices. This would collapse the economy.


The World Economy Can’t Go Very Far Backward, Without Collapsing


The 2007-2009 recession is an example of an attempt of the economy to shrink backward. (See Figure 1.) It didn’t go very far backward, and even the small amount of shrinkage that did occur was a huge problem. Many people lost their jobs, or were forced to take pay cuts. One of the big problems in going backward is the large amount of debt outstanding. This debt becomes impossible to repay, when the economy tries to shrink. Asset prices tend to fall as well.


Furthermore, while previous approaches, such as using horses instead of cars, may be appealing, they are extremely difficult to implement in practice. There are far fewer horses now, and there would not be places to “park” the horses in cities. Cleaning up after horses would be a problem, without businesses specializing in handling this problem.


What World Leaders Can Do to (Sort of) Fix the Economy


There are basically two things that governments can do, to try to make the economy (or car) go faster:


  1. They can encourage more debt. This is done in many ways, including lowering interest rates, reducing bank regulation, encouraging lower underwriting standards or longer term loans, taking out greater debt themselves, guaranteeing debt of non-creditworthy entities, and finding new markets for “recycled debt.”

  2. They can increase complexity levels. This means increasing output of goods and services through the use of more and better machines and through more training and specialization of workers. More complex businesses are likely to lead to more international businesses and longer supply chains.

Both of these actions work like turbocharging a car. They have the possibility of making the economy run faster, but they have the downside of extra cost. In the case of debt, the cost is the interest that needs to be paid; also the risk of “blow-up” if the economy slows. There is a limit on how low interest rates can go, as well. Ultimately, part of the output of the economy must go to debt holders, leaving less for workers.


In the case of complexity, the problem is that there gets to be increasing wage disparity, when some employees have wages based on special training, while others do not. Also, with capital goods, some individuals are owners of capital goods, while others are not. The arrangement creates wealth disparity, besides wage disparity.


In theory, both debt and increased complexity can help the economy grow faster. However, as I noted at the beginning, it is the wages of the non-elite workers that are especially important in allowing the economy to continue to move forward. The greater the proportion of the revenue that goes to high paid employees and to bond holders, the less that is available to non-elite workers. Also, there are diminishing returns to adding debt and complexity. At some point, the cost of each of these types of turbo-charging exceeds the benefit of the process.


Why the Economy Works Like a Self-Driving Car


The reason why the economy acts like a self-driving car is because the economy is, in physics terms, a dissipative structure. It grows and changes “on its own,” using energy sources available to it. The result is exactly the same effect that Adam Smith was observing. What makes the economy behave in this way is the fact that flows of energy are available to the economy. This happens because an economy is an open system, meaning its borders are permeable to energy flows.


When there is an abundance of energy available for use (from the sun, or from burning fossil fuels, or even from food), a variety of dissipative structures self-organize. One example is hurricanes, which self-organize over warm oceans. Another example is plants and animals, which self-organize and grow from small beginnings, if they have adequate food energy, plus other necessities of life. Another example is ecosystems, consisting of a number of different kinds of plants and animals, which interact together for the common good. Even stars, including our sun, are dissipative structures.


The economy is yet another type of a dissipative structure. This is why Adam Smith noticed the effect of the invisible hand of the economy. The energy that sustains the economy comes from a variety of sources. Humans have been able to obtain energy by burning biomass for over one million years. Other long-term energy sources include solar energy that provides heat and light for gardens, and wind energy that powers sail boats. More recently, other types of energy have been added, including fossil fuels energy.


When energy supplies are very cheap and easy to obtain, it is easy to ramp up their use. With growing supplies of energy, it is possible to keep adding more and better tools for people to work with. I use the term “tools” broadly. Besides machines to enable greater production, I include things like roads and advanced education, which also are helpful in making workers more effective. The use of growing energy supplies allows growing use of tools, and this growing use of tools increasingly leverages human labor. This is why we see growing productivity; we can expect to see falling human productivity if energy supplies should start to decline. Falling productivity will tend to push the economy toward collapse.


One problem for economies is diminishing returns of resource extraction. Diminishing returns cause the economy to become less and less efficient. Once energy extraction starts to have a significant problem with diminishing returns (such as in Figure 2), it is like losing energy resources into a sinkhole. More work is necessary, without greater output in terms of goods and services. Indirectly, economic growth must suffer. This seems to be the problem that the economy has been encountering in recent years. From the invisible hand’s point of view, $100 per barrel oil is very different from $20 per barrel oil.


One characteristic of dissipative structures is that they keep re-optimizing for the overall benefit of the dissipative structure. We saw in Figures 3 and 4 how fuel use and jobs rebalance around the world. Another example of rebalancing is the way the economy uses every part of a barrel of oil. If, for example, our only goal were to maximize the number of miles driven for automobiles, it would make sense to operate cars using diesel fuel, rather than gasoline. In fact, the energy mix available to the economy includes quite a bit of gasoline and natural gas liquids. If we need to use what is available, it makes sense to use gasoline in private passenger cars, and save diesel for commercial use.


Another characteristic of dissipative structures is that they are not permanent. They grow for a while, and then collapse. Later, new similar dissipative structures may develop and indirectly replace the ones that have collapsed. In this way, the overall system is able to evolve in a way that adapts to changing conditions.


What Are the Likely Events that Would Cause the Economy to Collapse?


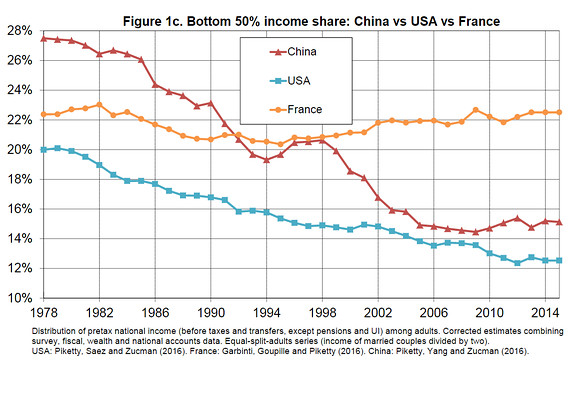
I modeled the system as being like a self-driving car. The thing that keeps the system operating is the continued growth of inflation-adjusted wages of non-elite workers. This analogy was chosen because in ecosystems in general, the energy return on the labor of an animal is very important. The collapse of a population of fish, or of some other animal, tends to happen when the return on the labor of that animal falls too low.


In the case of the fish, the return on the labor of the fish falls too low when nearby supplies of food disappear, and the fish must swim too far to obtain new supplies of food. The return on human labor would seem to be the inflation-adjusted wages of non-elite workers. We know that wages for many workers have been falling in recent years, because of competition from globalization, and because of replacement of human labor by advanced machines, such as computers and robots.


Figure 6. Bottom 50% income share, from recent Piketty analysis.

Figure 6. Bottom 50% income share, from recent Piketty analysis.


Besides the problem of falling wages of non-elite workers, earlier in this post I mentioned a number of other issues that make the wages of these workers go less far. These include growing government spending, and the growing costs of education and healthcare. I also mentioned the problem of rising debt, and the increased concentration of wealth, as we try to add complexity to solve problems. All of these issues make it hard for “demand”–which might also be called “affordability”–to be sufficiently great to allow commodity prices to rise to the level producers need for profitability.


Prices Play a Very Important Role in the Economy


The pricing system is the communication system of the economy, as a dissipative structure. One use of energy is to create “information.” Prices are a high level form of information.


One big area where prices come up is with respect to the whole portfolio of products needed on a regular basis, which I mentioned earlier (water, food, energy products, and mineral products). In order for the system to continue working, the prices need to be both:


  • Affordable by consumers

  • High enough for producers to cover their costs, including a margin for taxes and reinvestment

Now, in 2017, prices are “sort of” affordable for consumers, but they are not high enough for producers. Oil companies will go out of business if these low prices persist.


Back in 2007 and 2008, we had the reverse problem. Prices were high enough for producers, but too high for consumers (especially non-elite workers). This is a big part of what pushed the economy into recession.


We noticed back in Figure 1 that quantities of energy products/goods tend to move up and down together. A similar phenomenon holds true for prices: commodity prices tend to rise and fall together (Figure 7).  The reason this happens is because when the world economy is moving swiftly forward (higher wages, more building activity, more debt), demand tends to be high for many different types of materials at the same time. When the economy slows, prices of all of these commodities tend to fall at the same time. Inflation tends to fall as well.


Figure 6. Prices of oil, call and natural gas tend to rise and fall together. Prices based on 2016 Statistical Review of World Energy data.
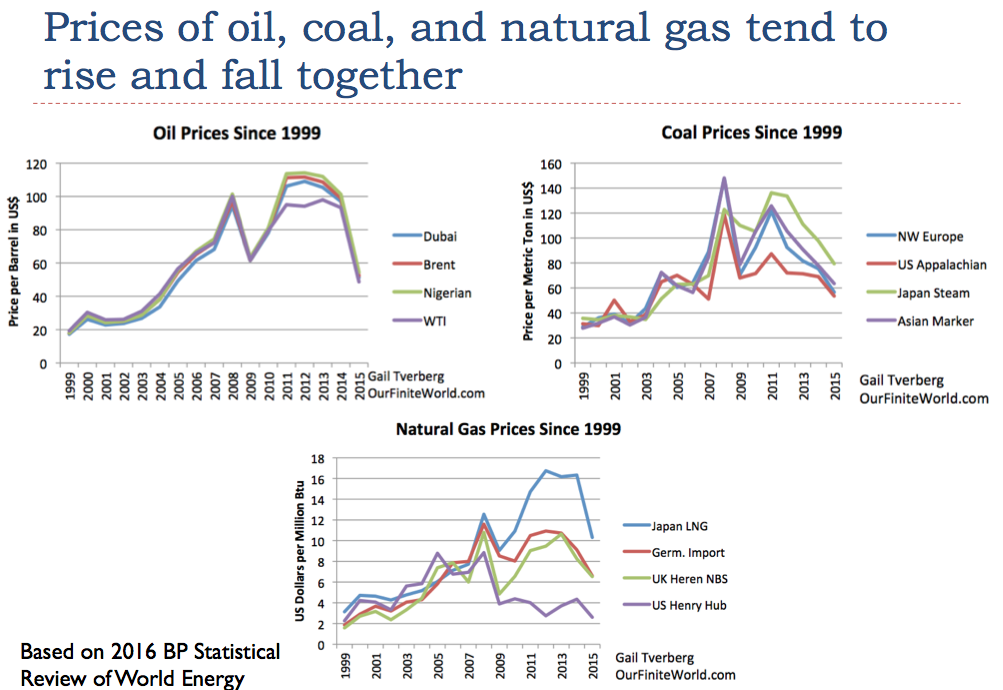
Figure 7. Prices of oil, call and natural gas tend to rise and fall together. Prices based on 2016 Statistical Review of World Energy data.


If prices cannot rise high enough for producers, it is likely a sign that wages of non-elite workers are already too low. The affordability loop mentioned earlier is not being closed, so prices cannot stay up at a high enough level to maintain production.


Most Modelers Overlook the Fact that the Economy Is an Open System


Most energy models are based on one of two views of the world: (1) fossil fuel energy supply will eventually run short, so we must use it as sparingly as possible; or (2) we want to reduce the use of fossil fuels as quickly as possible, because of climate change. Because of these issues, we want to leverage the fossil fuel energy we have, to as great an extent as possible, with energy that we can somehow capture from renewable sources, such as the solar energy or wind. With this view of the situation, our major objective is to create “renewables” that use fossil fuel energy as efficiently as possible. The hope is that these renewables, together with the actions of governments, will allow the economy to gradually shrink back to a level that is somehow more sustainable.


Implicit is this model is the view that the economy, and the world in general, is a closed system. Our current government and business leaders are in charge; they can make the changes they would prefer, without the invisible hand causing an unforeseen problem. Very few have realized that the economy cannot really shrink back very much; past history, as well as the nature of dissipative structures, shows that economies tend to collapse. The only economies that have at least temporarily avoided that fate have shifted toward less complexity–for example, eliminating huge government programs, such as armies–rather than yielding to the temptation to add ever more complexity, such as wind turbines and solar panels.


The real situation is that we have a here-and-now problem of too low wages for non-elite workers. Commodity prices are also too low. Intermittent renewables such as wind and solar are thought to be solutions, but it is well-known that intermittent renewables cause too-low prices for other types of electricity generation, when added to the electric grid. Thus, they are likely part of the low-price problem, not part of the solution. Temporary solutions, if there are any, are likely in the direction of cutting back on government expenditures and reducing regulation of banks. In fact, with the election of Trump and the passage of Brevity, the economy seems to again be re-optimizing.


We also know that dissipative structures do not shrink back well, at all. They tend to collapse, instead. For example, you, as a human being, are a dissipative structure. If your food intake were cut back to, say, 500 calories per day, how well would you do? If you could not get along on a very low calorie diet, how would you expect the economy to shrink back to a renewables-only level? Renewables that can be used in a shrunken economy are scarce; we don’t have a huge number of trees to cut down. We cannot maintain the electric grid without fossil fuels.


The assumption that the economy is a closed system is pretty much standard when modeling our current energy situation. This occurs because, until recently, we did not understand that the self-organizing properties of inanimate systems were as important as they are. Also, modeling of the economy as a closed system, rather than an open system, makes modeling much easier. The problem is that closed system modeling doesn’t really tell the right story. For a discussion of some of the issues associated with this mis-modeling, see the recent academic paper, Is the increased use of biofuels the road to sustainability? Consequences of the methodological approach.