Showing posts with label Algorithmic trading. Show all posts

Thursday, November 23, 2017

UK Trader Fined 60,000 Pounds For Outsmarting Algos

Yet another UK trader is being punished by overzealous regulators for an accomplishment that should instead have earned him accolades: Outsmarting the machines.


In a case that echoes some of the circumstances surrounding the scapegoating of former UK-based trader Nav Sarao, former Bank of America Merrill Lynch bond trader Paul Walter has been fined 60,000 pounds by the FCA for a practice that regulators call ‘algo baiting’.


Algorithm baiting is similar to spoofing – a practice that has been banned by stock-market regulators as those markets have embraced high-frequency trading practices that have broken markets and made them more vulnerable to this type of manipulation. But fixed income markets, like the Dutch loan market Walter is accused of manipulating, have been slower to embrace HFT-type trading. Because of this delay, Walter is a pioneer. Using BrokerTec, a popular fixed-income trading platform, Walter would place a bunch of bids for a given bond, triggering trend-following algos to follow suit. Then he would quickly cancel the bids. Here’s a more complete explanation per the Financial Times. 


Mr Walter entered bids for Dutch state loans that pushed up their price. Then, when other algorithmic trades followed him in response and raised their bids, Mr Walter sold to them and cancelled his quote. This happened 11 times between July and August 2014 while he was working for the bank, the FCA said, while on one occasion he did the opposite. He netted a total of €22,000 profit from this “algo baiting”.


Mark Steward, the head of FCA enforcement, said the FCA would remain “vigilant” in detecting abusive practices like “algo bating”. Of course, programmers could also build better algorithms, stamping out the practice without any help from the government.


“Market manipulation undermines market integrity and confidence. The FCA will be vigilant in detecting abusive practices and will take robust action to protect issuers and participants from all over the world from the harm caused by such abuse.”


Tellingly, Walter did not know that what he was doing was market abuse. But the FCA still found him negligent even though the regulations surrounding these aggressive trading tactics in fixed income markets are not well-defined.


According to the FCA’s register of regulated individuals, Walter became inactive in August 2014 and previously worked at UBS.


Of course, the government’s motivation in fining Walter sets an important precedent that will help regulators in the future. With the ECB tapering its bond purchases (though that’s not the terminology Mario Draghi would use), the centrally-planned markets regime that’s persisted since the crisis is about to unravel. While many Wall Street strategists and PMs remain bullish, regulators see the writing on the wall. They understand the risks that NIRP, market-distorting asset purchases and an increasing reliance on ETFs and high-frequency trading algorithms have created. And when it all comes crashing down – like it did during the May 2010 flash crash – regulators will already have their scapegoat ready.


Years after the crash, authorities arrested Sarao and blamed him for triggering the largest wipeout in market history by placing large orders for S&P 500 e-mini contracts, then cancelling them, to manipulate prices in a way that would benefit his trading positions. Sarao has insisted he did nothing wrong, but that didn’t stop the UK from extraditing him to the US, where he faces serious jail time, as we noted above.


The irony, of course, is hard to miss: Sarao, a small-time trader, is facing prison, while the architects of today’s broken markets receive accolades and are rewarded with lucrative jobs in private equity once they’re done working in government.


And just so we can relive the flash crash in all its horrifying glory, here is an video courtesy of Nanex showing trading in the e-mini future which Sarao has been accused of spoofing.


The punchline: Sarao"s orders are shown in red, and they disappear well before the most acute part of the flash crash.


Saturday, October 21, 2017

Kyle Bass: "Today"s Market Resembles The 1987 Debacle On Steroids"

The US stock market celebrated the 30th anniversary of Black Monday with the 2017 version of a rocky trading day: Stocks sold off early, with S&P 500 futures recording their steepest post-midnight drop of the year. But the dip was reflexively and aggressively bought, and stocks even poked back into the green seconds before the close as algos mistook a repetitive Politico headline about Jay Powell’s chances of becoming the next Fed chair for news - leaving us with yet another record close.


Of course, the historical juxtaposition of the 1987 crash with today’s unnaturally placid markets practically forced even the most bullish of traders to question how much longer the present market paradigm - where markets listlessly drift through a seemingly interminable series of record highs while trading volume and volatility remain suppressed - can possibly last.


With that question in mind, Real Vision released a video early today containing interviews with some of the biggest names in the hedge fund universe. Though the interview was shot a few weeks ago, remarks from Hayman Capital’s Kyle Bass resonated with market"s mood.


Bass discussed what he sees as the many short- and long-term risks to the US equity market, including the rise of algorithmic trading and passive investment, which have enabled investors to take risks without understanding what they’re doing, leaving the market vulnerable to an “air pocket."


And with  so many traders short vol, Bass said investors will know the correction has begun when a 4% or 5% drop in equities snowballs into a 10% to 15% decline at the drop of a hat.


“The shift from active to passive means that risk is in the hands of people who don’t know how to take risk. Therefore we’re likely to have a 1987 air pocket. This is like portfolio insurance on steroids, the way algorithmic trading is now running the market place.


Investors are moving from active to passive, meaning they’re taking the wheel themselves all at a time when CTAs are running their own algo strategies where they’re one and a half times long and half short and they all believe they can come out at the same time."


“If you see the equity market crack 4 or 5 points, buckle up, because I think we’re going to see a pretty interesting air-pocket, and I don’t think investors are ready for that,” Bass said.


When it comes to identifying potential catalysts, Bass said the US’s deteriorating relationships with both China and North Korea present significant long-term risks...


“Our trade relationship with China is worsening our relationship with north korea whatever it is continually worsens. We’ve got three people at the head of these countries that are trying ot maike their countries great again, I think that’s a real risk geopolitically."


...While the unwind of G-4 central bank stimulus could hammer equities and bonds in the short term.


"But when you think about it financially, which is actually easier to calculate, the financial reason is the G-4 central banks going from a period of accommodation to a period of tightening, and that’s net of bond issuance."


In summary, investors better snap up those out-of-the-money S&P 500 puts before it’s too late, because central banks - try as they might - can’t forestall the return of volatility forever.


Sunday, October 15, 2017

The New Bit Currency Crypto FX paradigm

(GLOBALINTELHUB.COM) — 10/15/2017 Dover, DE — The Bit Paradigm has arrived; with billions being thrown into projects that no one knows who are the founders, or if the profiles they use for their ‘team’ pages are guys working from home or have day-jobs at the local grocery store.  It is transforming the landscape so rapidly, we compiled a sequel to Splitting Pennies entitled Splitting Bits – Understanding Bitcoin and the Blockchain – available on Amazon Kindle for $2.99 and Paperback $9.99.


As Currency experts, we found nothing unusual in the Bit World, it’s just FX 2.0 and hopefully a catalyst for real global financial reform beyond the scope of the myopic Dodd-Frank Consumer Rip Off and Exploitation Regulation that have plagued the US consumer going on 5 years now.  As we’ve explained in our previous work, Splitting Pennies – FX is the basis for the global financial system.  Don’t forget that Bitcoin is denominated in US Dollars.  While FX is the least understood market in the world it is also the most important.


Just remember one thing – customers (business) need currency, they don’t need stocks or Crypto.  Take any business as an example, McDonalds (MCD) is always a great FX example – they need foreign currency as they accept it in more than 110 countries worldwide.


forex

And being based in Chicago, they need to repatriate those currencies into US Dollars, making them one of the biggest FX traders in the world.  So where does Bitcoin fit into all this?  At the moment, it doesn’t.  Of course that’s all changing – and changing quickly.  The news changes by the day – as the Bit Paradigm goes mainstream.  The current market cap of the entire CryptoCurrency Market is $170 Billion according to Coinmarketcap.com.


While that is still far away from traditional markets, the growth rate is beyond parabolic.  Skeptical traders should remember the late 90’s when fears about the Euro kept investors away.  Just take a look at this Monthly EUR/USD chart showing the Euro’s rise against the dollar from lows of .83 to highs of 1.58 before settling into the range that it’s been in recently:


Euro Historical


The Red line from .83 to 1.58 is about 190% or double – and traders should also bear in mind in FX there is a lot of leverage, so the 100% return in 6 years could have been 1000% or greater (many funds did profit from this simple trade).


Of course, the real money in FX is in algorithmic trading, what the banks learned the hard way.. But the Euro is a great example of a synthetic currency that was created artificially, and finally succeeded to be an alternative to the US Dollar as a world reserve.  Although the technicalities of Bitcoin are far different, the gestalt is the same – Bitcoin is a currency created artificially, backed by nothing, and is increasing in value because people believe that it will be used in the future and that the price will go up.  Just like there’s nothing behind Bitcoin, there’s really nothing behind the Euro – with one key difference.  It’s possible for the ECB to print (mint) as many Euros as they want, but it’s not possible to do this with Bitcoin because of the design (there is a limited number of Bitcoin) and because there’s no central bank behind it.


The big story of currency trading Crypto is of course, new alt-coins other than Bitcoin, which are being issued so rapidly it’s impossible to even keep track of them.  Coinmarketcap.com lists 1170 different Cryptocurrencies, you can see the full list here.


For a detailed breakdown of how you can profit from trading Bitcoin, checkout our new book Splitting Bits.

Wednesday, September 27, 2017

Amid Growing Risks And Diminishing Returns From Algos, Former Blackrock Elite Take On Mindless Robots

As ZeroHedge readers are keenly aware, 2008 kicked off the largest financial engineering experiment in history – namely, the beginning of 12.3 Trillion in QE and the lowest interest rates in 5,000 years. The plan, hatched by Bush-era Fed Chairman Ben Bernanke and Treasury Secretary Hank Paulson, created a ‘Fed Put’ underneath the markets first made popular by Alan Greenspan – an implicit guarantee that no matter how bad things got, the Fed would actively combat financial disaster.


As a result, markets experienced an unprecedented rally of nearly 400 percent since the March, 2009 lows – corresponding with a renaissance in computerized trading thanks to lightning fast Silicon Valley innovations.


Rise of the machines


As markets worked their way out of the giant financial crater created by the credit crisis, erratic surges in volatility and historically low interest rates created the perfect conditions for asset managers of all sizes to employ sophisticated trading algorithms to try and beat the market while dispensing with costly human employees. Between Wall St. firms and the various technologies adopted by exchanges around the world, countless billions have been spent on raw processing power, low-latency long-distance trading networks, and an army of programmers.


In March, Blackrock’s Larry Fink boldly stated that the era of the “star stock picker” is coming to an end amidst a firm-wide shift by the world’s largest money manager towards automated strategies.


JP Morgan estimates that up to 90 percent of all daily volume across all exchanges is computer driven, or systematic trading – with just over half of the volume attributed to risky High Frequency Trading (HFT) algorithms. This massive shift from active-investing (humans) to passive-investing (algos) effectively means that Trillions of dollars are sloshing around the exchanges, traded almost exclusively by automated systems.


Perhaps most troubling about the shift to algos is the fact that Wall St’s mindless robots have never had to participate in a rate hike cycle, the unwinding of central bank balance sheets, or a secular bear market. Couple that with that fact that many systematic trading schemes use massive amounts of leverage, and it’s clear that we are entering into uncharted territory as market conditions change.


Choking on bytes


When the Fed began printing money in December of 2008, the erratic volatility which accompanied the QE experiment ushered in a period of underperformance by active money managers who couldn’t compete with hyper short-term, passive trading algorithms.


Unfortunately for algos – which hit their stride during ‘easy money’ market conditions, the future may not be so bright. In addition to creating volatility, sparking flash crashes (they need liquidity like an engine needs oil), and frontrunning orders, automated trading systems have been suffering from diminished returns amid an investment landscape now comprised almost entirely of robots.


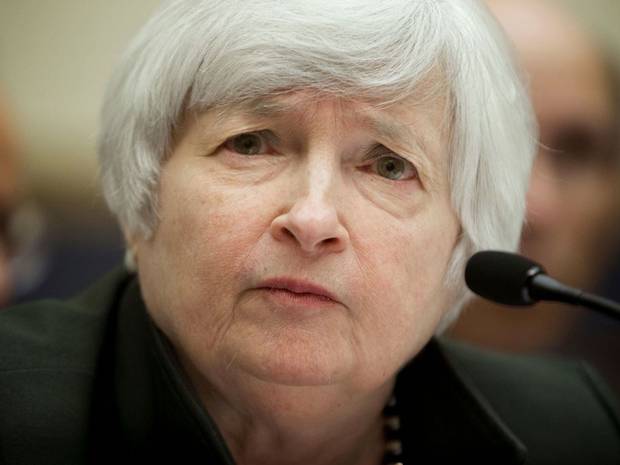
In August, the Fed’s Janet Yellen warnedof the “larger presence of algorithmic traders in markets,” voicing concerns over liquidity during stressful conditions. In short, the industry-wide ‘rise of the machines’ has ushered in new types of systemic risk while diluting the performance of once-dominant strategies.


“…algorithmic traders and institutional investors are a larger presence in various markets than previously, and the willingness of these institutions to support liquidity in stressful conditions is uncertain.” Janet Yellen


And as the Financial Times reported last year, algos have huge blind spots when it comes to market disruptions, noting that while “any large market moves in one direction for a period of time the trend following computer will be able to profit,” algos are entirely unable to respond to irrational events they weren’t programmed to deal with.


Their conclusion was logical:


Until computer traders can develop genuine artificial intelligence they will remain unable to gain an edge over the best human investors in spotting a catastrophic disruptive threat to an industry, or a revolutionary emerging technology.


Raw processing power may have its uses in financial markets, but until scientists develop a truly intelligent investing system, rather than a trend follower, the truly skilled human fund manager has no reason to fear.


Enter Blackrock"s Elite Alumni


Like John Connor leading the resistance against a mindless army of terminators, three former Blackrock money managers, Chris Coolidge, Edward Dowd, Rich Mowrer and industry marketing veteran James McCaffrey have teamed up to outmaneuver Fink’s SkyNet and the rest of the Wall St. robots. Their firm, OceanSquare Asset ManagementLLC (www.oceansquare.com) was formed to take advantage of what they believe to be the coming shift back to active, fundamental investing in both fixed income and equity after a decade of synthetic, Fed-sponsored growth.


Based out of Wayne, PA, these guys are no joke – having managed tens of Billions for Blackrock with 54 years of combined experience, the team has navigated multiple market cycles – something Wall St. algorithms have never done.


The investment world is in the crosshairs between man and machine. From algorithms to computer-driven portfolio management, the automation against our clients is underway and it’s our responsibility to deliver to them the active solutions they deserve.” –Chris Coolidge, President & CIO of Fixed Income


In short, the days of easy money are over. With markets at all time highs, thanks in large part to algorithmic ping-pong, the principals of OceanSquare are gearing up for the return to fundamentals-driven, high-conviction stock and bond selection – which means humans analyzing companies run by other humans, who are making long-term business decisions to adapt to economic conditions and purchasing decisions of – you guessed it, humans.


OceanSquare is also unique in that the fixed income and equity PMs will collaborate on their products and will all jointly run a Global Multi Asset Absolute Return product that will be a concentrated ‘best ideas’ portfolio with a benchmark-agnostic approach.


Edward Dowd, OceanSquare’s CIO of Equities and former manager of BlackRock’s $14 billion Capital Appreciation fund, feels confident going head to head against the robot army:


OceanSquare intends to outwit the computers through portfolio concentration and long holding periods,” Dowd said, adding “While the computers have the edge in short term trading, it is OceanSquare’s belief that fundamentals eventually align with price over a time horizon greater than a year. Larger global asset managers will be challenged to effectively offer concentrated portfolios due to their size and focus on short term performance measurements. Additionally, it would require them to shrink as well, which is never fun for investment staff or their investors.”


With the army of Wall St. terminators already suffering from fatigue, OceanSquare Asset Management and its team of star stock pickers may be the John Connor that active clients need to guide them into the future.


Friday, September 1, 2017

Why it's nearly impossible to trade Currencies with success

(Elite E Services) — 9/1/2017 — As we have explained in our book  Splitting Pennies – trading FX is nearly impossible; or at least, it may be possible for some time, but in the long run, it’s a near certainty that without the use of professional algorithmic trading systems you will blow up your account.  That’s because of the dynamics of how FX works vs. other markets.  In traditional markets, there is a bias towards positive movement; all CEOs of public companies want their stock to go higher.  Bull traders, 401k investors, pension funds – basically everyone wants the stock market to go up.  The short sellers aren’t ‘pessimists’ so much as ‘realists’ that over-inflated P/E ratios are a sign for a crash from unrealistic levels.  This is NOT the case in FX.  Currency markets have opposing forces like ‘gravity’ and ‘anti-gravity’ – every country wants both a strong currency and a weak currency.  This may seem illogical, welcome to the world of Currency!  The reason is simple – exporters want a cheap currency and importers want a strong currency.  Politicians usually favor a weak currency because it’s good domestically and big business favors a strong currency (at least in the USA) because USA is a net importer.  Let’s have a look at today’s USD action most noticed in EUR/USD:


EURUSD


On the surface this looks like a great trading opportunity – but is it?  EUR went up on poor US Payroll data; and then fell on dovish jawboning from the ECB.  Planned conspiracy to manipulate FX or just random brownian movement?  Believe what fits into your mind that helps you sleep at night, either way – would you have been able to buy EUR at 1.1924, sell near the high at 1.1980 and then reverse, covering near 1.19 handle?  All within 10 minutes?  Maybe someone did it, even if by accident, but the point is that any trading plan or investment strategy shouldn’t rely on the ability of such skills because even if as a trader you were able to achieve this great feat – would it be able to repeat it, day in and day out – for years?  Probably not.


Enter more paradox such as “Triffin Dilemma”:


The Triffin dilemma or Triffin paradox is the conflict of economic interests that arises between short-term domestic and long-term international objectives for countries whose currencies serve as global reserve currencies. This dilemma was first identified in a 1929 book, Gold and Central Banks, by Polish economist Feliks M?ynarski,[1] who identified a fundamental instability in a gold-based international monetary system, that the reserve currency countries would tend to accumulate foreign reserves, but as the volume of these grew relative to the country’s gold reserves, international investors would begin to fear suspension of convertibility; later in the 1960s, it was rediscovered in the context of the Bretton Woods system by BelgianAmerican economist Robert Triffin, who pointed out that the country whose currency, being the global reserve currency, foreign nations wish to hold, must be willing to supply the world with an extra supply of its currency to fulfill world demand for these foreign exchange reserves, thus leading to a trade deficit. Due to M?ynarski’s precedence in articulating the problem, Barry Eichengreen has suggested renaming the problem to “the M?ynarski dilemma“.[1]


This is not only true for a reserve currency – any currency has a conflict between short term and long term interests.  For example, if a currency is weaker it can help exporters in the short term to boost sales, but hurt the same exporters in the medium term when they need to go out into the world and buy raw materials for higher prices.  This push and pull is what defines modern Forex on a systemic level.  While average investors certainly don’t need to know this unless you’re planning on getting a job with a central bank, it can help any investor understand how and why Currency markets fluctuate the way they do.  It should also be noted that these forces maintain ‘bounds’ naturally, establishing a sort of ‘high’ and ‘low’ limit for any FX pair.  For example the EUR/USD now trading around 1.19, it can go in next days to 1.20 or 1.21 but not 1.90, for example.  Even in rare cases such as the “Brexit” the GBP/USD went down by less than 10% – which is a lot, for a major Currency.  So let it be known to all that these risks in FX are investable (with the help of algorithms) and hedgeable.  Looking from a risk management perspective, it is a lot more manageable than securities, commodities, or bonds – which have the finality of the ‘ulimate’ risk (default) – as Currency is ‘money’ the Euro can’t ‘default’.


A final note to all you Bitcoiners – Bitcoin is a Currency it’s only a matter of time before it’s integrated into the Forex system, because BTC/USD is an FX pair.  Good time to brush up on your FX and understand the broader market (not just the microcosm of Cryptocurrencies).


So now for the good news, the Currency Market provide a number of opportunities for algorithmic trading systems that continually profit, making FX a new budding asset class.


Today’s move is a blip on the radar, a non-event for hedgers – and a potential huge trading opportunity for algos.  Game on!


For a pocket guide to make you a Currency Genius checkout Splitting Pennies.

Sunday, August 27, 2017

Matt King: Global QE And "ETFs Everywhere" Have Created An Unstable, One-Way Market

While the financial industry remains divided over what precisely is the cause of the malaise that affects modern markets, characterized by plunging volumes and trading activity, record low volatility and dispersion, a relentless ascent disconnected from fundamentals, and generally a sense of foreboding doom, manifested by an all time high OMT skew - or record high price for crash insurance - as discussed previously...


... it can agree on one thing: it has something to do with the interplay of QE, the artificial force that has disconnected market prices from values for the past 8 years, and ETFs, which as some prominent investors have said are "devouring capitalism." They also agree that the combination of QE and ETFs have made the market almost entirely "one-sided", and thus prone to collapse when conditions finally reverse.


Indeed, as Citi"s Matt King - our favorite sellside cross-asset strategist - writes in his latest report, a growing number of institutional managers, from Oaktree to Elliott to  Bridgewater, have recently been expressing concerns not only about elevated valuations and the potential for a correction, but in many cases also about the potential for herding and the risk that markets have grown one-sided."


King points out a trend observed among the financial literature over the past 2-3 years (starting with Howard Marks" March 2015 note in which he asked, rhetorically "What Would Happen If ETF Holders Sold All At Once? Howard Marks Explains"), "everyone’s number-one suspect in potentially creating such a tendency seems to be ETFs. In Paul Singer’s memorable words, passive investment through the likes of ETFs “is unsustainable and brittle” and “is in danger of devouring capitalism”.


But are ETFs really to blame, King wonders, or simply a symptom of some other underlying tendency? His answer is the latter, and begins with an explanation we have shown many times on this website: the relentless shift away from active to passive management:


It’s easy to see why active managers are complaining. Over the past ten years, the cumulative inflow to US HY mutual funds is precisely zero, while HY ETFs have netted $40bn. In US IG, where inflows have been stronger, more than a quarter of the money over the past decade has gone to ETFs; in EM FI in recent years, the proportion is more like one-third. For European credit, ETF outstandings may look far smaller, and yet these belie the true size of the threat since (unlike the US) most trading occurs OTC and hence goes unrecorded. All of these are nothing compared to the massive rotational shift being seen in equities, in which around $500bn has flowed away from active managers and into ETFs over the past 12 months alone, and where ETFs now account for over one-quarter of markets’ traded volume.


It"s not just investors who are worried about ETF flows: regulators are too, having become "alarmed at the dramatic growth in ETFs, focusing in particular on the potential for a sudden reversal, notwithstanding ETF managers’ robust defence that ETFs’ potential to trade at a discount to NAV gives them an additional escape valve relative to traditional open-ended mutual funds."


But, as King shows in the following chart, there is a puzzle here, or rather a pair of them. "Rather than being the fickle retail fad of the popular imagination, ETF flows have actually proved much more stable than mutual fund flows (Figure 1). Either the potential for a future reversal is far greater than anything seen in the historical data, or the problem is not unique to ETFs."


Furthermore, it is odd for fund managers - professional investors trained to capture market short and long-term  market inefficiencies - to be complaining about something which in principle should be creating additional opportunities for them.Here King makes an absolutely spot on point about inefficient markets, which however we have to note, is only relevant inasmuch as central banks don"t do everything in their power to perpetuate the inefficiencies, now in their 9th year:


Indiscriminate buying and selling by ETFs should add to the potential for active managers to spot mispriced securities. The greater the proportion of trading done by passive entities, the greater should be the opportunities.


So are fund managers simply suffering from a case of sour grapes, King asks, "or is there some other factor preventing these opportunities from occurring in the way theory says they should be?"


His answer for why the current market regime has made active investors a species facing extinction, is due to two things: record low volatility and record low dispersion:


The obvious culprit is the lack of volatility. Our Cross-Asset Volatility Indices show that realized volatility now stands at multi-decade lows in every major asset class bar FX (Figure 2). But even worse for active managers is the lack of dispersion. A manager can still make money when markets themselves are involatile provided there is sufficient variation in the performance of individual securities. Dispersion, or the cross-sectional standard deviation, effectively captures how much a manager with perfect  foresight could have made by overweighting the best performing securities or sectors and


underweighting the worst performers. Dispersion in both credit and equities is now at the lowest levels on record.


As Citi points out, this lack of potential for outperformance might seem surprising on the back of obvious single-name sell-offs like Teva or Provident Financial. However as he explains, "these names have been too small to offer much outperformance potential: even managers who had zero-weighted them prior to the sell-offs would only have increased total returns by 1.4bp with Teva in € and 1.3bp with Provident in £ respectively. To outperform, managers need there to be multiple names moving in opposite directions – to have, if you like, a genuine two-way market. The only market which has come close to this description in recent years is the only one where volatility is not making new record lows: FX. Is this a coincidence, or a feature?"


King then reverts back to this key point: the confluence of QE and ETFs have led to one-way markets, in which the main feature is investor clustering, and herding: "for us, the real damage in markets in recent years is an increase in herding. ETFs are contributing to this tendency but they are not its primary driver."


The result is an increasingly illiquid market: "What we think has been happening in recent years is that investors are displaying an increased tendency to position themselves the same way round. In the process we are therefore losing the heterogeneity which is the source of a liquid market. This tendency is likely to have been strongest in the markets where the price action has largely been one-way. With the notable exception of markets with currency pegs, FX has some built-in protection against this because its securities automatically have two sides. Thanks to the fragmented nature of trading and the large role carry plays in driving returns, credit is particularly vulnerable."


Of course, it"s not just the shift to passive investing that is forcing active investors to group together for their very survivla: other factors are also exacerbating this trend.


"The combination of global credit growth and QE has created such a sustained bull market in many asset classes that investors are inevitably concluding that their best trade is simply to close their eyes and go long the market in the cheapest way possible. ETFs in principle offer a panoply of potentially uncorrelated factors, but in practice trading volumes have been overwhelmingly concentrated on the major indices. The rise of algorithmic trading and regulators’ increased tendency to insist on marking to market likewise build in a short-termism which is likely to be self-reinforcing. Whatever factor or trade has been doing well is likely to receive inflows; whatever has been doing poorly will be shifted away from."


Which brings us to the conclusion: whether QE is the driving force behind ETF-mediate herding, or some different factor is responsible, the trouble with one-way markets is that they are not really one-way, and as Citi"s King warns "wooner or later the herd turns around. This creates a risk that current record lows in volatility are misleading."


Here King points out something we brought to readers" attention last week when we showed the record high cost of market crash insurance: "To some extent this is reflected in high levels of OTM skew, but conceivably not enough given the potential for asymmetry."


The problem, according to Citi - and certainly central bankers who however will never admit this in public - is that when the herd has been moving in one direction for long enough, it becomes hard to envisage what might turn it around. For credit  investors, the “buy on dips” mentality has become deeply entrenched – even if the justification for doing so is never valuations, and always “the strength of technicals".


Typically these are attributed to some sort of irresistible but poorly understood external force, such as mutual fund inflows (in IG, but interestingly not HY at present) or “the strength of the Asian bid”. Rather like the blurb from a London estate agent which recently landed in my letter box, investors are urged to buy precisely because prices have gone up so much: the idea that the demand which led to those price rises might one day reverse is unthinkable.


Still, despite the "fake markets" of the past 8 years, in which every dip has so far been bought - profitably - Citi says that investors should be thinking about such reversals, preferably before they actually occur.


Will mutual fund inflows always remain strong even as deposit rates rise? Will Japanese investors’ bid for US credit remain as intense even as reduced BoJ purchases mean private investors have to absorb more net supply in JGBs, or are there signs that is fading already. In particular, what is the potential for abrupt discontinuities on this front?


The answer, according to King, very high, but "to say that this or that threshold is automatically a danger" is not the point: Citi"s punchline is that increases in herding, or equivalently a reduction in the diversity of the investor ecosystem, create large asymmetries which are in themselves a threat to financial stability – whether or not they are accompanied by financial leverage, something which not even Fed presidents can grasp.


And yet, while King can warn until he is blue in the face, the reality for an entire generation of "investors" in artifical markets is that no matter what happened, risk assets would keep going up, as did mutual funds and ETFs. That may change soon: King looks at fund flows among equity and debt (IG and HY) fund flows, and calculates that the standard deviations and maximum moves, are much larger for outflows than for inflows – modestly so in some cases, shockingly so for equities.


Even if ETF flows have not shown this tendency to date, there is every reason to think that both ETF and mutual fund flows will exhibit these characteristics in future. One-way markets trend for extended periods with very little volatility, but are then vulnerable to abrupt turnarounds.


All of the above leads King to an ironic conclusion, one which we have discussed previously and which we will comment on more shortly, namely that in this fake market, the one thing that can potentially save the active management community, is a reversal, or as King puts it, "paradoxically, the very thing required to save active managers is a reversal of the conditions which gave rise to their tremendous growth in the first place."


Namely, a crash. Unfortunately, with central banks more concerned than ever that markets can simply no longer function on their own without daily central bank support, a crash, or even a correction, may not happen... or rather when it does, trading would simply shut down as this "one-way market" can no longer even discount such a simple alternative outcome as "selling."

Thursday, August 3, 2017

"Oil God" Andy Hall Blows Up, Closes Main Astenbeck Hedge Fund

Back in December 2014, the start of the worst oil rout since the financial crisis claimed its first victim when 113 year old Phibro, then owned by Occidental Petroleum after its sale by Citigroup, would liquidate in the US after it failed to buy a buyer. Phibro, of course, was made famous or perhaps infamous (after his $100 million Citi bonus in 2008 prompted a Congressional inquiry) by its star employee, "oil god" Andy Hall. Yet while said god"s employer Phibro, was liquidating and thus ending one of Hall"s paychecks, Hall would continue managing his $3 billion hedge fund Astenbeck (of which Occidental owns 20%) where he worked in parallel.


At the time we wondered how long this oil permabull - who suffered tremendous losses in the ensuing two years - would last in an environment where oil prices refused to go up, and whether he "would blow up twice on the same trade." Turns out the answers, in reverse order, were "yes" and "about 2 and a half years", because moments ago Bloomberg reported that Hall is shuttering his main Astenbeck hedge fund:


  • OIL TRADER ANDY HALL IS SAID TO CLOSE MAIN ASTENBECK HEDGE FUND

  • ASTENBECK MASTER COMMODITIES FUND II IS SAID TO LOSE 30% IN 1H

As Bloomberg adds Hall is closing down his main hedge fund "after large losses in the first half of the year" which amounted to almost 30% through June for his flagship Astenbeck Commodities Fund II.


Hall"s liquidation comes less than three months after another famous oil bull, Pierre Andurand, liquidated his last remaining long positions, although it was unclear if he had also shuttered his hedge fund.


Ironically, it was less than a month ago that Andy Hall finally capitulated, admitting that the "facts changed", and warning that oil may not go up much from current prices in what was his bearish letter ever (full letter can be found here). This is what Hall concluded in his latest letter to investors:


Whereas it once seemed positions could be held with an eye to a longer-term secular appreciation, that is no longer the case. Indeed, the evidence is now in plain sight. Over the past year, the front month WTI futures contract has moved by double digits in percentage terms 10 times within a $40 - $55 band. This volatility has been accentuated by large financial flows into and out of the market by non-traditional investors and algorithmic trading systems. Attempting to capture just a percentage of those moves makes more sense than trying to ride what has turned out to be a non-existent trend, especially when contango inflicts a negative roll return on investors. The extreme volatility within a rangebound environment also argues for a more tactical and conservative approach to portfolio management.


Upon reading this, and seeing little further upside from their former "oil god", it appears that Hall"s LPs decided they had had enough, and pulled their cash.


Oil, sending imminent liquidation, is down on the news.


Sunday, July 30, 2017

Our Brave New 'Markets' - How HFT Algos Risk A Sudden Massive Sell-Off

Authored by Chris Martenson via PeakProsperity.com,


One thing is clear: These aren’t your daddy’s markets anymore.


Why?  Because about 10 years ago the Rise of the Machines (aka high frequency trading algorithms) completely altered the terrain of what we call the ‘capital markets.’ 


Let’s look at this as a before and after story.


Before the machines, markets were a place that humans with roughly equal information and reflexes set the prices of financial assets by buying and selling.  Fundamentals mattered. 


After the machines took over, markets became dominated -- in terms of volume, liquidity and pricing -- by machines that operate in time frames of a millionth of a second. The machines and their algorithms use remorseless routines and trickery -- quote stuffing, spoofing, price manipulations -- to ‘get their way.’ 


Fundamentals no longer matter; only endless central bank-supplied liquidity does. Because such machines and their coders are very expensive and require a lot of funding.


The various financial markets are so distorted that I first resorted to putting that word in quotes – “markets” – to signify that they are not at all the same as in the past.  In recent years I’ve taken to putting double quote marks – “”markets”” – in attempt to drive home their gross distortion.  Not only are todays “”markets”” something the human traders of a generation ago would fail to recognize, they"re no longer a place where human actions of any sort have much of a remaining role.


Why care about this? Two big reasons:


1. Such “”markets”” are easily manipulated by central banks and other state actors by virtue of their automated responses to liquidity injections. Are the markets going down when you don’t want them to?  Just use any one of several highly leveraged means of signaling to the computers that it’s time to buy instead of sell.  Common leverage points include the Japanese Yen-to-USD price level, selling VIX to lower volatility, and buying massive quantities of index futures ‘all at once.’


2. These manipulations will work until they don’t.  When they fail, they may well fail spectacularly -- resulting in shattered markets that have to be shuttered until the damage can be assessed.  Investors will not be able to access their capital, either to buy or sell, while things get sorted out.  When the markets finally do reopen, valuations will be a whole lot lower due to the loss of the huge block of (phantom) volume previously supplied by the now-shut down algos.


The main predicament were facing is that by jamming the “”markets”” ever higher, the central banks have created an enormous gap between current prices and reality.


An easy to  see example of this is the housing market in San Francisco, where average income earners cannot afford average houses -- at all.  The only way the SF housing market can re-balance to a sustainable level is either for salaries to shoot up massively (while house prices remain flat) or for house prices to fall.


Equities are no different; their prices current suffer from a similar "reality gap". The same is true for bonds.


Obvious Price Manipulations


Just to show that I"m an equal opportunity critic and don’t just think gold and silver are manipulated  -- and they have been and continue to be, which is now a matter of fact -- I warn that the same dynamics that infest the precious metals ""markets"" at the COMEX indeed happen elsewhere.


My conclusion is that the HFT computer algos are in complete control of the ""market" action, and play with and off of each other to create massive sudden price movements that have nothing to do with anything except book order saturation.


Today"s recent example comes to us courtesy of the WTIC oil market on the NYMEX:  


Starting around 6:30am, oil futures started drifting slightly lower. A little volume came in around 6:40 a.m. and then -- BAM! -- right at 6:44 a.m. EST, a super spike of volume to the downside occurred.   I happened to be watching this in real time and began counting off seconds.  Before I got to 3 seconds it was over. (These are one minute bars so those three seconds are obscured in a full sixty second long bar).  


So...8 thousand contracts in 3 seconds. Staggering.


For fun, amortize this out over a full trading year. It"s a preposterous figure.


The point being, these volume spikes (especially to the downside) have an intensity that is simply overwhelming for the market structure.


Which is entirely the point of the operation. That’s the very essence of price manipulation.


Let"s try to look at this rationally. Let"s define intensity as "volume of more than 2 standard deviations above the recent 1-hour average, divided by the duration of the volume event."


If we do this, an analysis of the oil chart above would go like this: 


Say the average volume was 200 contracts/min. The normal "intensity value" would be 0, because there are no moments above 2 std before the big volume spike (0/0)


Making a guess of a std of 300 for the normal period, at the height of the spike, the value would be ~7,400. Then divide the 3 second episode (expressed in minutes) and you get 148,000. 


So from an intensity value of 0, thing spiked up to 148,000 in a matter of seconds.


Is that a useful number or way to look at this?  I think so, because it expresses the idea that these volume spikes, combined with their extremely short duration, have an intensity that is far outside of the normal trading bounds.  And it’s that super out-of-range characteristic that just clobbers the price of whatever is being traded (in this case oil, one of the most widely-traded commodities on the planet).


These blasts destroy the market bid/ask structure in those moments. You have literally zero chance of trading that event as a human, even and especially if using "insurance" like stops.  


This means that the ""markets"" have a barrier to entry where the cost is the price of a very expensive arrangement of hardware and software capable of operating at the micro-second level.  Humans need not apply. 


These are not your daddy’s markets.  They belong to the big players (aka big banks and hedge funds) and their very expensive machines.


Understanding Volume vs. Liquidity


What we’re really describing here is a sudden spike in volume that basically destroys the current market book of orders. 


What that means is this. Imagine that you are selling eggs at the farmers market along with nine other vendors.  There are 500 people wandering the market looking for eggs and other produce.  The average sales rate for all 10 egg vendors and all 500 customers is 5 dozen eggs per minute.


The price you can sell your eggs for is set in accordance with the other prices around you.  Yours are organic, but small. The vendor next to you has large eggs that are conventional, but larger. And third has small colored eggs from heritage breeds that are free range.  Let’s say that the range of selling prices is from $4/doz to $5.50 per dozen.  This is the market structure for eggs at our farmers market in this thought exercise.


All of a sudden, a giant semi-truck backs up. It"s filled with eggs matching every description of those being sold at our small little market. A bullhorn speaker rises from the roof of the truck and announces that 10,000 dozen eggs are now available for the next 1 minute for whatever price anyone is willing to give him for them. 


What do you think happens to egg prices over that one-minute window?  That’s right, the price gets completely crushed.  And what do you think happens to demand for eggs among the 500 potential customers at our market?  It’s completely satisfied. So future demand is eliminated and sales volumes decline accordingly. 


In other words, the “”market”” for eggs got ruined, right there and in an instant.  You and the other 9 original egg merchants got thoroughly hosed.  


The volume of eggs on offer shot up massively all of a sudden, but once all 500 potential egg buyers had been satisfied, the number of buyers dropped away rapidly.   Liquidity dried up.


This shows how it’s possible to have a market with tons of volume, but no liquidity.  There are lots and lots of eggs for sale, but no buyers.  All volume, no liquidity. 


I know this is a little complex, and possibly arcane, but the points are important to understand. You see, even the most liquid of all possible markets, the US Treasury market, er “”market””, suffered an amazing flash crash back in 2014.  It’s been pretty well studied, but the culprits were the HTF machines that now dominate that “”market.””


This next chart by Eric Hunsader of NANEX (whom we"ve interviewed numerous times over the past years) shows the relationship between price, liquidity and volume on that fateful day, when yields plunged and prices spiked (remember in bonds yield and price move oppositely).


Note the first event which was a sudden loss of liquidity, seen at the yellow arrow:


https://twitter.com/nanexllc/status/784371418955997184


At the same time that the liquidity dried up, you can see volume ticked up pretty strongly and this caused prices to rise.  For whatever reason, in HFT land the rules seem to be:


  • High Volume + High Liquidity = small price movements

  • High Volume + Low Liquidity = big price movements

  • High Volume + HFT only Liquidity = flash crash

The point here is this: The computer bots now are the market.


They operate according to a set of pre-programmed parameters.  If or when those parameters are exceeded, they simply vanish in less than an eye blink.  When that happens, prices go wonky as the remaining few algos go wild. Their resulting erratic trading spikes volumes and prices all over the place. 


Why This Matters


Maybe you’re thinking, “So what?”  Maybe you aren"t a trader and think the hows, whens and whys of the computer algos in the Brave New Market isn"t really of any concern to you.


But it really is. And here’s why.


The flash crash in May 2010 gave us an indication, but the mini flash crashes we see almost daily in various other markets -- ranging from the tiny to the US Treasury market -- tell us that it’s entirely possible that someday all the worlds computer algos might suddenly stop operating because an event occurs that is out of their programmed operating state.


We’ve seen these flash crashes numerous times.  The biggies were the 1,000+ point plunge in the Dow on May 6, 2010, the Treasury flash crash of October 15, 2014, the ETF flash crash of August 24th 2015, and the dollar flash crash on the last trading day of 2016.


There have been innumerable smaller flash crashes in specific equities and commodity contracts as well.  But the biggies show us that nothing is safe.  When you can have flash crashes in the entire equity market index universe, ETFs, the Treasury market, and even the US Dollar, then you know there’s no safe place.


Everything is under the control of the computers.


A long-running discussion between Dave Fairtex, myself and others, concerns the idea of whether or not markets as big as the ones just mentioned can be manipulated by government/central banking forces to stop, limit, or even reverse a price decline.


My view has always been “yes”, because it should be child’s play to fool the algos into going this way instead of that way by simply injecting a relatively small amount of capital at the right place and time.


I would love to know, for example, why central banks have an incentive program at the CME -- where the exact sorts of highly leveraged, electronically traded products that would be best suited for market manipulation -- are traded.


By virtue of its existence, we know that central banks are highly active traders on the CME platforms.  Otherwise an incentive program offering steep volume-based trading discounts would not exist. 


Not one single central bank (yet) reports anywhere in their financial disclosures of being the proud owners of any of the accounts traded on the CME. So the details of the situation remain a mystery.


But dependably, every single market decline that began over the past several years has been reversed -- usually in the dead of night, and in the futures market -- by mysterious injections of capital that then get the HFT algos to follow the trend.  So inquiring minds would like to know.


Back to the story: Dave had an opportunity to meet recently with a super smart HFT developer and operator who confirmed that algos are easy targets for such a manipulation scheme should the central banks wish to engage in such a thing.


So I went off to my afternoon meeting with the HFT trading guru and, well, because of too many ciders I forgot most of the questions. But the one I remembered most clearly did get answered.


I asked him, "Do you think that someone could manipulate the market by figuring out what the bots were coded to trigger on, and then taking action to encourage them to do just that?"


Short answer: yes.


(Source)


So, yes, such a thing is possible.  And because it’s possible, and there are seemingly no consequences for getting caught, and because the Fed is fighting any sort of audit tooth and nail, and because the CME has a central bank incentive program, and because the “”market”” mysteriously self-corrects at odd moments usualy with a flood of intense futures buying, my inner prosecutor thinks he could win a case in front of a reasonable jury here.


The big issue, however, is what might happen if (or rather when) things get ‘out of hand’ and the computer bots cannot be cajoled back into the market because the parameters are just too far out of whack.  "A major market accident" is the likely answer. 


Dave continues:


Two weeks ago I went to this lecture by a guy (a physics PhD) on unsupervised machine learning techniques called "reinforcement learning".  In the past, the lecturer had worked for JP Morgan and others on HFT applications.  He"s now got this startup, and he was (more or less) recruiting AI/ML people to come work for him.


The sense I got from his lecture is that there was a big initial move using machine learning to harvest pennies, but that the market is very efficient now at that particular thing, and so its tough to make a living these days by using that approach.  Another thing he said was that, there are bots out there that try to find your bots, and then trick them into losing money.  Enemy bots, as it were.


One interesting question was asked by an audience member: "how do you train your bots for market problems or exceptional conditions?"  His answer, informed by years of work in constructing market maker bots, was: "the vast majority of time is spent in "normal markets" and as such, that"s how we train our bots."  Basically, when things get dicey, they just turn them off.   I"ve heard that before too, but it was fun hearing it from the horse"s mouth.


And, of course, that"s why we have flash crashes.  Also my sense is, there aren"t really enough humans left to make markets in an emergency, since the profits have been all eaten up by the bots - no money to pay the human traders, which would spend 99.5% of their time sitting and looking at the bots doing their work.  And the bots have only been trained on "normal situation" operations.


It makes sense.  Why train a bot for exceptional situations, when a huge pile of money can be made just on the day to day fluctuations.  Not only is finding enough data to train a bot to run during crash situations difficult, testing is problematic, and then of course you have to wait for a crash and see if it actually works.  And if there"s a bug, losses could be catastrophic.  Better to pull the plug when things get iffy.


(Source)


So, why does this matter to you?  Because today"s ""market"" structure is so completely broken now that a flash crash can happen in any sector, no matter how large.  That’s not speculating, that’s established fact.


Once a crash really gets under way, for whatever reason, getting the computer bots back online cannot be accomplished until and unless the markets are within certain operating ranges.  That’s just how they are built and designed.  So as long as everything is within a certain set of parameters, the bots will participate.  But as soon as they aren"t, they"ll all just disappear.  When they do, they"ll take literally 99% of the market quotes away and 70% of the trading volume. In an instant.


So I’ll add one more ‘rule’ to that list above:


  • No quotes + no volume = no market.

Someday parameters will be exceeded and the “”market”” will crash.  Unless the central banks can manage to become such dominant buyers in the “”market”” that they become the market.  Japan’s central bank has already achieved this status in its country"s government bonds and ETF markets.


Who knows? Maybe this is the goal of every major central bank.  But if so, then we should be having a robust discussion about how this is no different than printing up money and handing it directly to the very wealthiest individuals and most powerful corporations.


That’s not monetary policy. That’s social engineering.


Conclusion


Patently obvious price manipulations happen daily now in all electronic markets.  Oil, gold, silver, indexes, individual equities, options – you name it – all are subject to overt price manipulation tactics being run by the largest and most well-connected Wall Street and private trading firms. 


The algos are now the dominant force in the markets in terms of both quote and trade volumes.


Further, the central banks can and do easily use these same lightning-fast programs to halt and reverse market price declines.


This level of micro-management of the “correct" pricing is ruining the core function of the financial markets, which is to set prices by aligning the collective needs and wisdom of millions of individuals and entities.


By ruining this, the central banks have bought some temporary market price stability at the expense of legitimate price discovery.  Without that mechanism, mal-investments are now accruing, as they always do when speculation is rewarded over hard work. 


Making a sound investment decision requires smarts, effort and risk.  Feh!  Who want’s to go through all that when you can borrow at 1% and retire stock in your company yielding a 2% dividend? 


Who wants to figure out how to satisfy all those state and federal regulations involved in opening a new business when you can earn more by playing the speculation game in the financial ""markets""?


As Adam Taggart wrote recently:


When [the market correction eventually] happens, those who decided to look like an idiot early on and refuse to join the party (i.e., positioning their capital defensively), are going to look like geniuses. They will avoid the heartbreak of loss, and they will have capital to deploy when the dust settles, purchasing quality assets at (potentially historic) bargain prices.


It"s not an easy choice to make, or to remain steadfast in. It takes foresight, courage, and resolve. But it"s a smart choice.


Of course, cash savings is just one of a number of options for positioning your financial wealth defensively right now. For those looking to learn more about other ways to do so, we recommend the following progression:


  1. If you haven"t yet read it, read our free report The Mother of All Financial Bubbles to understand the full nature of the situation we"re living through today

  2. Read our report How To Hedge Against A Market Correction, to understand the most common strategies for protecting your portfolio from downside risk

  3. For those interested, I"ve shared how my own personal portfolio is positioned (Note: this is not intended as personal financial advice, but as an example to evaluate)

  4. Schedule a review focused on downside risk management with your financial adviser. If you"re having difficulty finding one experienced on this topic, we can suggest one to consider.

It"s unknowable exactly how much longer our unsustainable markets can remain at their record levels. But there is one thing we know for certain: we"re closer to their day of reckoning than we"ve been at any point over the past seven years. A recession is due soon by historical standards, and long overdue by fundamental ones.


When it happens, do you want to look like an idiot? Or would you rather choose to look like one now, so that you can look brilliant then?


Choose wisely.


Good luck everyone.  This is the most unusual period in all of economic, financial and monetary history.  Perhaps this time they’ve got it right.


But if not: Look out below.

Thursday, July 27, 2017

Bankers Ditch 7-Figure Salaries To Climb Aboard The ICO "Rocketship"

In just a few short months, companies – many of dubious legitimacy – have raised more than a billion dollars through ICOs. Some of the better-hyped offerings in the field of 900 new coins that have been created this year managed to raise tens of millions of dollars in minutes.  Investors, who were eager to throw money at the new coins, blindly hoping they would land on the next bitcoin or Ethereum.


With all this money flying around, it’s no small wonder that bankers in New York, Hong Kong and London are abandoning seven-figure salaries to try their luck in the nascent ICO industry, according to Bloomberg. Stories like this have become commonplace with every passing fintech trend, as bankers, fearing the technology’s potential to disrupt the banking business and threaten their bonus pool, hoping to cash in on the next technology enabled “revolution.”


Richard Liu, a former dealmaker at Renaissance China, left the world of finance for the told Bloomberg he left the banking world behind for the chance to climb aboard a “rocket ship” – in reality a $50 million hedge fund that’s invested in 20 ICOs this year, including Tezos, one of the most successful ICOs in the industry’s brief history.


“For Liu, who put together some of China’s biggest tech deals in his old job, the chance to shape the nascent arena outweighs the dangers of a market crash or crackdown. Loosely akin to IPOs, ICOs have raised millions from investors hoping to get in early on the next bitcoin or ether, and their unchecked growth over the past year is such that they’ve drawn comparisons to the first ill-fated dot-com boom. Yet with stratospheric bonuses largely a thing of the past, the allure of an incandescent new arena far from financial red-tape has proven irresistible to some.


‘Traditional investment banks and VCs need to monitor this space closely, it could become very big,’ said the 30-year-old partner at $50 million hedge fund FBG Capital, which has backed about 20 ICOs. He’s off to a quick start, getting in on this year’s largest sale: Tezos, a smart contracts platform that raised $200 million to outstrip the average Hong Kong IPO size this year of around $31 million.


‘Unlike the traditional financial sector, there are no ceilings or barriers. There’s so much to imagine,’ he said.”


Later in the piece, Liu rebutted Bloomberg’s concerns about parallels between the ICO frenzy and the run-up to the dot-com crash, arguing that trying to pick successful offerings presents an opportunity to “carve out a niche.”


“You want to be on a rocket ship,” Liu said. “If you join early, then every day you’re making history.”


The SEC’s declaration that all ICOs should be treated like securities for regulatory purposes is a groundbreaking ruling that will help weed out some of the industry"s bad actor by bringing a degree of oversight to the market. The rule change will likely slow the launch of new ICOs, as serious companies figure out how to register their securities, while some of the frauds decide it’s not worth the risk.  


Another trader who previously programmed trading algorithms at Bank of America plans to use an ICO to launch his own cryptoasset management firm. In an interview with Bloomberg, he described the ICO market in stereotypically lofty terms.


Justin Short, who created electronic trading algorithms for Bank of America Corp. before launching trading-related startup Nous, is preparing to launch his own sale of digital tokens to bankroll what he calls cryptoasset portfolio management. A former Wall Street floor trader, he likens the advent of ICOs to an episode half a billion years ago when many of the planet’s life forms came into existence.


“It’s a Cambrian explosion of ideas. But that means you have to put in your work to figure out which one is even likely to work,” he said.”


Ron Chernesky, the owner of electronic trading platform InvestFeed and a former trader, is so optimistic about ICOs that he’s using one to swap out equity-trading capabilities on his platform with cryptocurrency.


“Interest in ICOs remains sky-high. Ron Chernesky started his career as a trader on Wall Street 10 years ago, first on a trading floor and then running trading platform InvestFeed Inc. He’s now in the process of replacing U.S. equities trading on his platform with digital currency trading, and planned to conduct his own ICO to raise 28,000 ether -- worth roughly $6 million at current prices.


We’re completely ditching the model that we’ve been doing for the past three years and now we’re looking at cryptocurrency,” the 38-year-old said. ‘This is long term for us, we see this as the new gateway to the millennial way of investing and where everything is going from here.’”


One former Forex-trading architect at HSBC tried to illustrate exactly how different factors influence the value of an ICO using that most effective of descriptive devices, the sports metaphor.


“Former HSBC forex-trading architect Hugh Madden, currently Chief Technology Officer of Hong Kong-based ANX International, this month helped raise about $18.7 million for cryptocurrency exchange OAX. He likens ICO-token ownership to a football club membership. You don’t get special access but as the team gets better, more people become fans and the price goes up.


When a football club “builds more relationships with other clubs, gets more matches, and generally enjoys wider adoption, then more people want to be a part of it,” the 40-year-old said. “There is no limit to participants, but there is a limit to memberships that allow members to exert influence on the future direction of the club.”


Of course, as Bloomberg readily admits, valuing ICOs is an impossible task. Developers regularly stumble upon coding flaws in even some legitimate ICOs. Meanwhile, hackers have stolen tens of millions of dollars of investors’ money. Still, these flaws haven’t stopped the market from eclipsing the value of early-stage venture capital funding raised so far this year, as starry-eyed investors, inspired by the newly minted legions of bitcoin millionaires, gamble in the hopes of landing a 1000x return.
 

Tuesday, July 11, 2017

Spoofing Lessons From Andy Hall - The Oil AND Silver King

A Silver Legend Throws in the Towel on Oil


By Vince Lanci for Soren K. Group


BACKGROUND


In 2010 I wrote an anonymous article for Zerohedge on Silver manipulation. Anonymous because the article was in part an indictment of the market structure on COMEX at the time. I was afraid of backlash against me and my nascent family, having already having seen the underside  of a bus in 2003 via my own actions and the need for a conflicted, and unqualified compliance officer / bureaucrat Tom LaSala in danger of losing his job after a horrendous failure to protect the NYMEX electricity contract. This, according to NYMEX / CFTC sources then. But I digress. 


About the  author: Vince Lanci has 27 years’ experience trading Commodity Derivatives. Retired from active trading in 2008, Vince now manages personal investments through his Echobay entity. He advises natural resource firms on market risk. Over the years, his expertise and testimony have been requested in energy, precious metals, and derivative fraud cases. Lanci is known for his passion in identifying unfairness in market structure and uneven playing fields. He is a frequent contributor to Zerohedge and Marketslant on such topics. Vince contributes to Bloomberg and Reuters finance articles as well. He continues to lead the Soren K. Group of writers on Marketslant.


Hall WasThe Uncrowned King of Silver


For me, PhiBro was a mentor in how to not be a victim and to try to divine my opponents" intentions just by watching their trades. An exercise in applied empathy if you will. To study PhiBro is to study Andy Hall.


Andrew Hall is a legend in the trading community. He was instrumental in execution of the 1994 Silver squeeze and the 1997 Buffet Silver buy.  He was a manipulator of Silver to the upside. But metals were just his HOBBY. And when Hall had orderflow, he maximized returns for clients and the prop desk at PhiBro. The man knew how to front run! But without order flow..


Astenbeck"s  Returns.


https://www.marketslant.com/core/assets/vendor/ckeditor/plugins/widget/i...);">?


Maybe the seat makes the money, not the man in it? But we aren"t here to kick him. Rather to describe what the man is good at. and to describe what we observed from  him.


Andy Hall, Oil  Perma-Bull


His baby was oil. We remember being on the wrong end of many mini oil plays by his desk at PhiBro right before a refinery fire became public. Here is one play his desk loved to do at least once a month :


  • Hall Gets Long Oil > Broker buys Calls for PhiBro hard and sloppily  > Oil rallies > Refinery fire news hits > Oil rallies more > Hall gets out of longs > Cue the crying options traders.

This was brilliant because he played the most liquid market against news in a much less liquid one. And a refinery fire is not necessarily bullish oil. It destroys oil demand as the refinery shuts down.


But when the option broker telegraphs who is buying, and the PhiBro reputation precedes him, and the option marketmakers  rush like lemmings to buy futures to hedge their short deltas.... you get long!.


Hall Was Immune to Buffet"s House Cleaning


We also knew traders on his desk that got fired by Solly, PhiBro"s parent,  after Buffet came in 1994 to rescue them. Hall did not. Because Hall was in energy, and while he had his own position in Silver on both occasions, he was not the poor sole who took the fall in 1994. 


Why Hall Was Great


The reality is, it is not so  easy to be right without client flow behind you. Hall"s early success in oil on his own may have been in part a function of a secular bull market in commodities to begin with. Personally, our experience  has been that Hall was not a directional expert, but he knew when a market was lopsided and knew how to catalyze the exit problem for everyone else. He also was expert at creating exit strategies for his own massive positions. 


Once  I saw a broker in Silver futures laughing (in relief) and shaking his head after executing and seemingly butchering a 5,000 sell order. I knew this broker well and asked him: "Was the client upset?" His answer was " NO, He was laughing!" To which i prodded him: "Was this the big player you have?". His  response was: NO, THIS WAS THE CLIENTS ENERGY DESK TRADER. And HE WAS LAUGHING AS I FILLED HIM 20 cents LOWER THAN I SHOULD HAVE.


Apparently this was Hall. And he had been long from $3.00 lower in Silver. To top that, a silver options broker had bought 1,000 calls loudly 30 minutes prior, driving uo the futures price about 20 cents. This was the same energy tactic Hall used so often. And a lesson was learned.


Taking on the Banks


Possibly least understood was his acumen in playing the oil futures term structure. We saw and were informed of his massive plays where calendar relationships were out of whack and he stepped in to fix them. He would be the buyer of 2 year December futures after  a bank was done laying off producer hedges  for his "back-to-back" vig. Then he"d sell another month in which he thought the price was out of whack on the high side. He exploited distortions created by organic order flow. Then he waited to be right. And sometimes, he nudged himself in being right as these were illiquid contracts. He would test the resilience of the sell side (maybe the bank actually held onto some of the hedge given them by the client?) by buying in thin hours to see if they pushed back. This is spoofing by the way. But he wasn"t necessarily fishing for stops like a slow motion algo. He was looking for sellers as he bought. And if they didn"t buy, he"d keep pushing. 


I labelled this to all who would listen as an inverted  pyramid style. It was the antithesis of investing.  It went something like this:


  1. Already be long  (when wasn"t he?)

  2. Buy 1 contract

  3. Buy 2 contracts if the fill on the first one was poor

  4. Buy 10 contracts even worse

  5. Buy 100 contracts even worse, then bid for 1000 at that price

  6. Buy some calls which will create option related futures buying

  7. Sit back and see what happens.

  8. If the market takes off, sell as many futures as you were long 

  9. Use the calls as either a tail or convert them to synthetic puts


Bidding to Sell


I knew a  precious metals floor broker who actually lost his business because of executing for PhiBro in this fashion. The broker was bidding and showing  some ridiculous volume for one part of the PhiBro desk. And in between his announcing his bid he was selling to locals 10 cents under his bid.  He could not cross the trades as they were for the same firm, but from different desks / clients. The broker was accused of facilitating market manipulation.


Crime scene depicted, but pales by comparison to HFT/ Algo crimes which are floor tactics on streroids with no counterparty transparency.


What really happened was he was selling for a Phibro trader or client long, while simultaneously bidding for another Phibro person.  That broker was handing money to locals who ran from him, scared it was a trick. I saw this happen. And it was hilariously scary.  I"m sure some of the details are not right here, and I have an alternate explanation of what may have been going on at the PhiBro  desk, but it changes nothing. Phibro was bidding above where they were selling and neither side could get filled.


A Product of PhiBro Culture


To begin to try to understand Hall a bit one must understand the culture of PhiBro. That firm started in the least liquid products  imaginable: iridium and such. To be a marketmaker in assets like these, one must have a brilliant tactical mind for creating your exit liquidity. Hall has that skill. One must also recognize the right time to corner a market. Hall did this. And one must know how to disguise one"s intentions in a small market where participants are easily identified. The PhiBro trained Hall did this.


These survival skills lent themselves greatly to manipulations of Silver on more than one occasion (crushing overhedged producers), front running refinery fires on many occasions, and in recognizing distorted futures curves from undigested order flow (and subsequently taking the banks who were order-flow monkeys on)


Read on and keep the above in  mind when reading Hall"s letter. 


- VLanci@echobay.com


Andy Hall"s Letter to Investors 


as published in ZH


[emphasis by Tyler Durden]


July 3, 2017


Dear Investor,


The oil rout continued in June with prices entering bear market territory. Not only did sentiment plumb new depths but fundamentals appear to have materially worsened. Demand growth seems to be somewhat less than anticipated while supply keeps surprising to the upside. The expected acceleration in inventory drawdowns has not materialized – at least as evidenced by available high frequency data. Several weeks of lackluster inventory data from the EIA, along with reports of increasing amounts of oil in transit and in floating storage, disappointed expectations for accelerating stock draws following the arrival of peak seasonal demand.


Meanwhile, U.S. shale operators have continued to add rigs at a surprisingly fast rate thus raising the odds for significant oversupply in 2018, even if OPEC maintains its production cuts beyond Q1. Over the past month, the market has in effect priced in two negatives, one long-term, the other short-term.


The longer-term negative is that it is becoming increasingly evident that, under most reasonable scenarios, U.S. shale oil will be the marginal source of supply, at least until 2020. There are enough non+OPEC, non-shale production projects already in the pipeline (and which were sanctioned when prices were much higher than today) that incremental U.S. shale oil production alone can balance the market for the next two or three years. Moreover, and more importantly, it is now becoming apparent that the cost of this oil is significantly lower than was believed to be the case even a few months ago. That means the long-term price anchor for oil has moved lower. At the start of the year, the anchor was thought to be about $60 (Brent) and rising over time. Today, it appears to be closer to $50 (and possibly still falling). Prices for long-dated futures have therefore moved down to reflect this new perception.


The short-term negative is an apparent deterioration in the supply and demand balances for 2017. Until recently it looked like demand would exceed supply by as much as 1.5 million bpd if OPEC maintained its production cuts through 2017. This would have eliminated the global inventory surplus sometime in Q3 and resulted in a backwardated market. It now seems, however, that the supply deficit will be considerably smaller than originally expected – probably only around 0.5 million bpd. There will therefore still be sizeable excess stocks at the end of the year. This realization has resulted in the market moving into a steeper and uninterrupted contango with spot prices falling relative to deferred prices which, as just noted, have themselves ratcheted lower.


We discuss both these developments in more detail below. However, absent some geopolitically induced supply curtailment or a further cut by OPEC, oil prices are likely to be range bound around a level that limits the growth in shale oil production. That would mean the forward WTI strip ought to be somewhere below $50.


Shale is now the marginal barrel


Technological advances have continued to drive down well breakevens as well as expand the shale oil resource base in the U.S. In a recent report, PIRA estimated that there are now 80 billion barrels, or half of the recoverable U.S. shale oil resource base, that is economic at $50 Brent (say $48 WTI) or less. This represents some 215,000 well locations. Each of these on average can produce around 300 bpd in its first year on stream. The current horizontal oil rig count is 650 and has been growing at a rate that would bring the count to close to 800 by the end of the year. 800 rigs can drill about 15,000 wells per annum which means potentially 4.5 million bpd of gross new production. After deducting legacy decline this would translate into net production growth of more than a million bpd per annum, which exceeds the expected “call on shale” (demand growth less non-shale crude supply growth from non-OPEC, OPEC crude and other non-crude liquids). Today’s rig count or lower would be necessary to constrain shale oil growth to the 0.7- 0.8 million bpd of year/year growth in shale oil production that is probably required to balance supply and demand.


The market is therefore trying to find a price level that curtails rig additions (and/or well completion activity) to a level commensurate with the call on shale. Exactly what that price is can be debated and the truth is no one really knows. It depends on current and future rig productivity, how drilling and completion costs respond to rising oil field activity levels, the willingness of shale operators to outspend their cash flows and the availability and cost of capital to the industry.


Notwithstanding uncertainties surrounding all these variables, it does seem that the price needed for a given rate of growth in shale oil production has been falling over time. Well breakevens have dropped because of steep rig productivity gains and cyclical cost declines. They could fall further if continued secular gains in rig productivity outstrip the cyclical cost increases now resulting from higher oil field activity.


Over the past two years, average rig productivity in the U.S. Lower 48 states has grown by more than 20 percent per annum. In the Permian basin productivity grew by around 30 percent last year. These gains have been achieved through reduced drilling times from the use of pad drilling and increased well productivity from longer laterals, more intense fracking and higher proppant loadings.


Whilst the rate of rig productivity growth appears to now be moderating, it is unlikely to stop altogether. A recent Goldman Sachs analysis posits continued productivity growth for years ahead. This will be driven by higher rates of recovery of initial oil in place through the application of artificial intelligence and big data analytics. Goldman argues that this could eventually reduce breakevens to $45 and below. The best operators in the Permian like EOG already have well breakevens at, or even below, $40 WTI. As the rest of the pack catches up with the leaders, average breakevens are likely to fall further if Goldman is correct.


If the marginal cost of oil for the next 3 or 4 years really is headed to the mid-$40 range then OPEC’s attempts to push prices to $60 seem futile. It is unlikely that OPEC will find the cohesion necessary to keep prices at an artificially elevated level if all it does is accommodate rampant growth in shale oil production.


That line of thinking raises the possibility of yet another reversal in OPEC policy – abandoning supply management and letting market forces balance supply and demand. This would obviously result in significantly lower prices, at least in the short term. On the other hand, with many OPEC countries needing much higher prices for fiscal sustainability (for Saudi Arabia the level is over $80), there is an inherent instability which adds to the geopolitical risks to supply. But for now, it seems likely that OPEC, led by Saudi Arabia, will stay the course with its current policy of production restraint. Oil at $45-50 is preferable to it being at $40 or below, even if the loftier target of $60 has proven elusive.


With hindsight, OPEC’s attempts to manage supply were poorly conceived. Given the short response time of shale oil to changing prices, OPEC should have acted more quickly and more decisively. The production cuts should have been deeper and implemented immediately. As it was, OPEC talked up the market ahead of the actual production cuts thus helping to unleash a fresh wave of future shale oil production as emboldened operators upped their capex budgets and raised capital on the back of the higher prices. Additionally, OPEC ramped up production in Q4 2016 ahead of its mandated cuts, thus adding to the very stock excess they were hoping to eliminate. OPEC members also then inexplicably offset the impact of their cuts by drawing down their own inventories to maintain exports during Q1 2017. This made no sense given OPEC’s stated goal of reducing OECD inventories to their five-year average.


Fundamentals have deteriorated significantly


In implementing its production cuts at the start of the year, OPEC and its allies were aiming to eliminate the inventory excess. This would have allowed spot prices to rise relative to deferred ones, pushing the market into backwardation. A backwardated market would eliminate the “subsidy” shale operators have been realizing by selling forward to hedge production. This would therefore help curtail shale oil supply growth by removing this windfall hedging profit. But it clearly hasn’t happened. The spread between Dec 2017 and Dec 2018 futures contracts moved $3, from a $1 backwardation to a $2 contango, over the past month as it became increasingly likely that there would still be substantial excess inventories at the end of the year.


There are several explanations for why the expected supply deficit has not materialized.


  • Firstly, demand growth has been somewhat disappointing. Based on indicators of economic activity, demand in 2017 should be growing by around 1.7 million bpd, if not more. Actual growth, however, seems to be closer to 1.4 to 1.5 million bpd for reasons that are not yet clear.

  • Secondly, non-OPEC supply growth has been exceeding initial expectations – largely because of faster shale growth in the U.S. Forecast growth in non-OPEC supply for 2017 has been revised progressively higher by 0.3 million bpd. OPEC production is also now expected to be greater than seemed the case just a month ago because of the earlier than anticipated return of shut-in production in Libya and Nigeria. This will add around 0.2 million bpd of additional supply on average in 2017.

  • Finally, revisions to data for 2016 now show a small flow surplus of 0.1 million bpd whereas previously there had been a small flow deficit.

Together these changes amount to a 0.9 million bpd deterioration in the supply and demand balance for 2017 and an initially expected supply shortfall for the year of 1.4 million bpd now looks like it will be closer to 0.5 million bpd. Because of lower SPR purchases in India and China, as well as stock reductions in the OPEC countries, the drop in observed commercial inventories will be even lower – perhaps as little as 0.3 million bpd. This is much less than the rate needed to mop up the stock surplus – some 450 million bbls at the start of 2017 - and the market will almost certainly enter 2018 with a still substantial inventory overhang.


Moreover, at the rate at which oil drilling rigs have been added in the U.S., non-OPEC production has been on a path to grow by as much as 2 million bpd in 2018. With demand growth of, say, 1.5 million bpd and a 2017 flow deficit of only 0.5 million bpd, and with higher year/year production from Libya and Nigeria, that would imply an annual average stock build next year, even if the current OPEC production cuts remained unchanged for the whole of 2018, something which is by no means a given. It is this specter of renewed stock builds in 2018 adding to still inflated inventories that has panicked the market and caused the forward curve to move into contango. This reversal of the time spreads, combined with the drop in deferred prices to match a lower perceived marginal cost, has resulted in nearby prices collapsing, even though seasonal factors are becoming their most favorable.


In short, OPEC, the market and oil bulls have run out of runway. There are just 10 weeks before fall turnarounds kick in and crude stocks in the U.S. start to build again. Excess crude inventories in the U.S. are around 80 million barrels, up sharply since the beginning of June, reversing the trajectory seen in April and May when sequential crude oil draws were rapidly eliminating excess crude oil inventories.


In the past month, however, excess crude stocks in the U.S. are back to the levels seen this time last year and there now appears to be little chance that they can be eliminated before the fall – especially if the rate of inventory change seen in the data for the past three weeks is maintained. Moreover, Q4 2017 will see an acceleration in U.S. oil production as the impact of higher rig counts is increasingly reflected in higher production.


The main culprit for the disappointing stock draws in the U.S. is a stubbornly elevated level of net imports. While imports from Saudi Arabia have finally turned lower, those from other OPEC producers (notably Iraq) have risen. Crude exports have also fallen in recent weeks, at least if the preliminary data are to be believed.


Backwardation was meant to take care of excessive shale production in 2018 and beyond by driving deferred prices to levels that would constrain its growth. But stocks have not fallen fast enough to sustain backwardation so the whole futures curve has downshifted instead.


When the facts change…


For all the above reasons, it looks increasingly like oil prices will be rangebound for some time to come. Hitherto, it had been our view that oil would trend higher as prices would need to rise to a level that would justify investment in more costly sources of supply than just the core areas of U.S. shale. However, not only has the core shale oil resource grown significantly – above all in the prolific Permian basin – but breakevens have dropped because of secular productivity gains outpacing cyclical cost increases, at least for now. Furthermore, there has been no shortage of capital to fuel the growth in shale oil production and this has allowed operators to significantly outspend their cash flows. The marginal economics of the typical shale oil producer have proven to be no impediment to the industry’s resilience. The breakevens referred to earlier are based on half-cycle economics. Full-cycle costs that cover land acquisition, infrastructure and overhead are probably almost $10 higher. But companies base their drilling decisions on half-cycle costs even if this leads them on the path to eventual bankruptcy (to which the shale oil industry is no stranger) so long as they have access to capital. It’s quite possible that shale oil production growth can only be reined in by the capital markets rationing the supply of funds as industry management seems to be more focused on growth than generating free cash flow or even paper profits [ZH: this is something we have been pounding the table on since 2014, most recently in mid-June].


It also appears that the cost of developing other supply sources, such as deep water offshore, has been falling dramatically making them competitive with shale in many cases. Because of these developments, the cost curve for oil has become much flatter. There is now an abundance of potential supply at around $50 Brent. Prices will tend to oscillate around this long-term price anchor in response to changing inventory levels as the market tries to determine the right price to satisfy the call on shale. With the current inventory surplus and what looks to be its slow dissipation, markets are also likely to stay in contango, barring some sort of supply shock.


These developments call for a more opportunistic approach to the oil market than hitherto. Whereas it once seemed positions could be held with an eye to a longer-term secular appreciation, that is no longer the case. Indeed, the evidence is now in plain sight. Over the past year, the front month WTI futures contract has moved by double digits in percentage terms 10 times within a $40 - $55 band. This volatility has been accentuated by large financial flows into and out of the market by non-traditional investors and algorithmic trading systems. Attempting to capture just a percentage of those moves makes more sense than trying to ride what has turned out to be a non-existent trend, especially when contango inflicts a negative roll return on investors. The extreme volatility within a rangebound environment also argues for a more tactical and conservative approach to portfolio management.


For now, the market is heavily oversold with a record speculative short position. Q3 should still see decent stock draws even if they are insufficient to eliminate excess stocks. Also, increases in the rig count appear to be ending and could decline in the coming weeks and months. It also remains to be seen how quickly the increased drilling activity will translate into a commensurate increase in the number of completed wells and whether cyclical cost pressures will accelerate or bottlenecks develop. Already, the number of drilled uncompleted wells (DUCs) has been rising quite rapidly. There is also a non-zero chance that OPEC might surprise the market with a further “shock and awe” production cut. Taken together these considerations mean there is a good chance for a price recovery from current levels. However, this recovery will be limited for the reasons set out earlier and because of the overhang of potential selling from oil producers who are significantly underhedged for 2018.


Best regards


Andrew J. Hall


Chairman and CEO


Read more by Soren K.Group